There’s a good chance that if you’ve ever come across a story created by Aaron Koelker, you just had to share it with someone else. Restrained, compelling color palettes. Informative, approachable narratives. Simple, striking graphics. Aaron’s stories are more than just something to read. He has experimented his way into creating several immersive little worlds that are the perfect blend of sophisticated and cozy, inviting readers to lose themselves while they’re there — and that’s just what he wants.
I’m always hoping that people will forget they’re looking at StoryMaps for a little bit.
From an internship with the St. Johns County Public Works Department in Florida to his current role as a Geospatial Services Project Assistant for the NYS Office of Information Technology Services in New York, Aaron has been using ArcGIS StoryMaps for science communication professionally and personally for many years, beginning with the classic version in 2018. He has been at the forefront of creatively using new features in ways that have left even the StoryMaps team in awe — and inspires our global storytelling community to try their own hand at creating a little world for their readers.
So, needless to say, it was a delight to sit down with Aaron to discuss his evolution with StoryMaps, his creative process, and how he uses storytelling to make science more approachable. The following conversation has been edited for brevity and clarity.
Aaron, you mentioned that you somehow found your way into an environmental science degree, which seems to be an origin story for many in the geospatial industry. Could you talk a bit about your somehow?
Initially, I was interested in film school and was studying creative writing, but environmental science just happened to catch my attention. The visual design and storytelling aspects of cartography resonated with me — and as someone who also enjoys problem-solving, GIS was naturally intriguing. I thought it was really cool that I could use GIS to help solve tangible, real-world problems. Now looking back, there were signs that this is where I would end up: I was that kid always flipping ahead in textbooks, looking for the maps instead of listening. And let’s not forget winning the 6th grade geography bee.
How did your pathway evolve after taking the turn to environmental science?
I started with an internship with the St. Johns County Public Works Department in Florida, where they were using StoryMaps to highlight their capital improvement projects. I was largely just making edits and adding new items to the stories, but it was enough to get me excited about StoryMaps and what I could do with them.
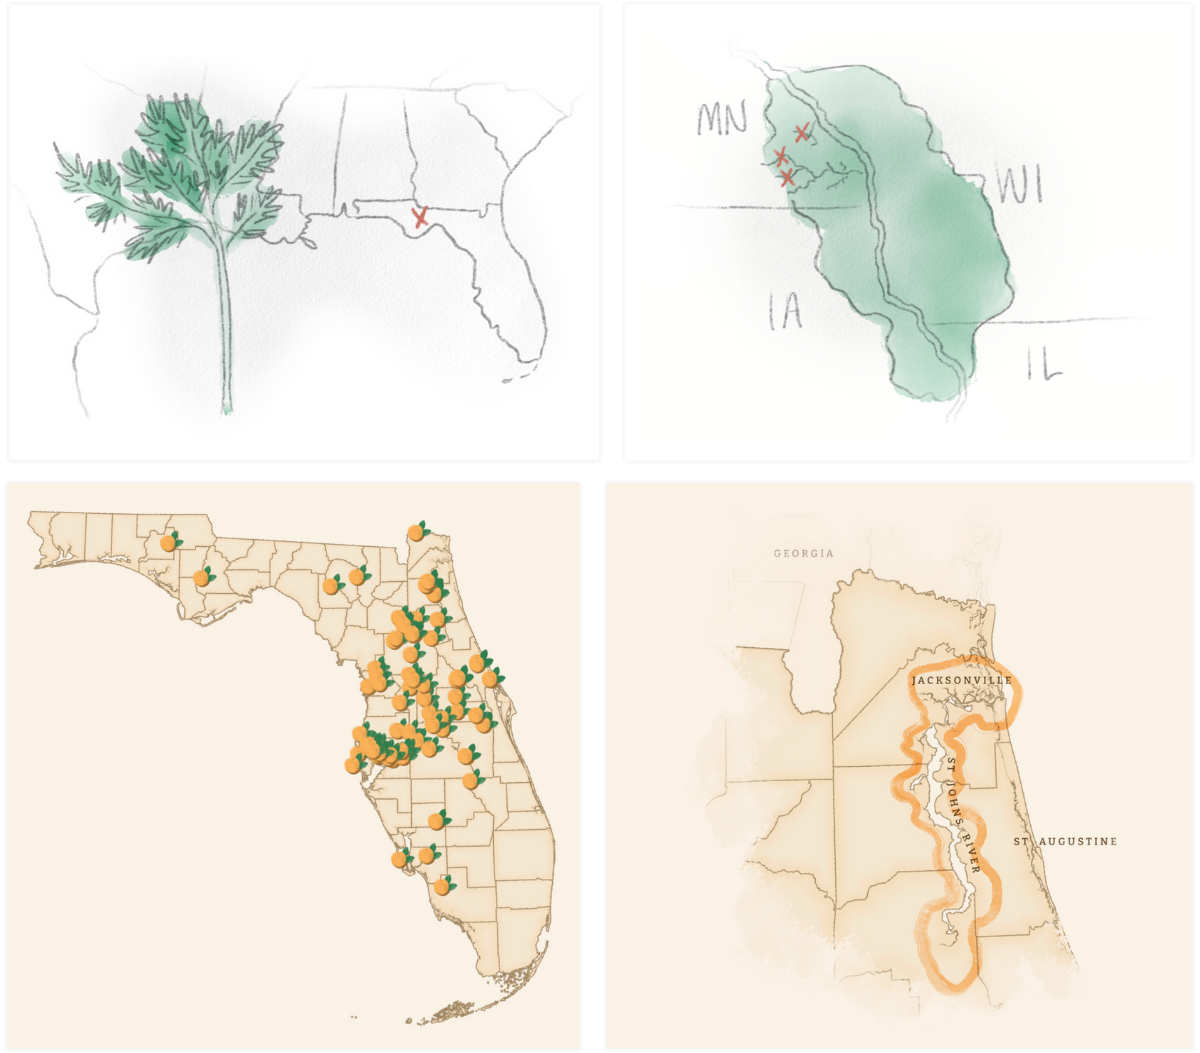
I then got a job with the Guana Tolomato Matanzas National Estuarine Research Reserve, where I again got to work on a project using StoryMaps. The story provided an overview of the reserve, detailing what they did and how they utilized GIS to maintain the landscape. Creating the story became a good way for me to learn about where I was working.
With your background in creative writing, it seems only natural that you would be drawn to using storytelling in science communication. Can you share your perspective on this?
The early professional work I was doing with StoryMaps wasn’t particularly narrative-driven. Still, the concept of researching and learning about a niche topic through crafting a story resonated with my curiosity.
At the time, I was fascinated by this particular place on the Florida coast, which was facing dramatic erosion and had fallen lighthouses as a result. I delved deeply into the history of this location to craft my first personal story using the classic version titled Lights, Capes, and Hurricanes: Tracking Change on the Forgotten Coast.
When creating this story, and then the many others since, do you have any particular intentions behind sharing it publicly?
I do hope that people gain something from my stories, that they walk away a little bit more informed than they were before. One story isn’t likely to change the world, but I do like the idea that little things can add up.
With that said, though, my guiding principle on these projects is always to let my curiosity guide me — and hope that if it’s interesting to me, it will be interesting to someone else. With the coastal lighthouse story, I have received emails from people who live in that area, sharing their own experiences, and I was even invited to their local planning group. Unfortunately, I had already moved by that point, but it was rewarding to know that the story had been found and resonated with readers.
Coastal lighthouses. Menhaden. Glacial gardens. Rocket launches. The citrus industry. Can you take us behind the curtains of your curiosity?
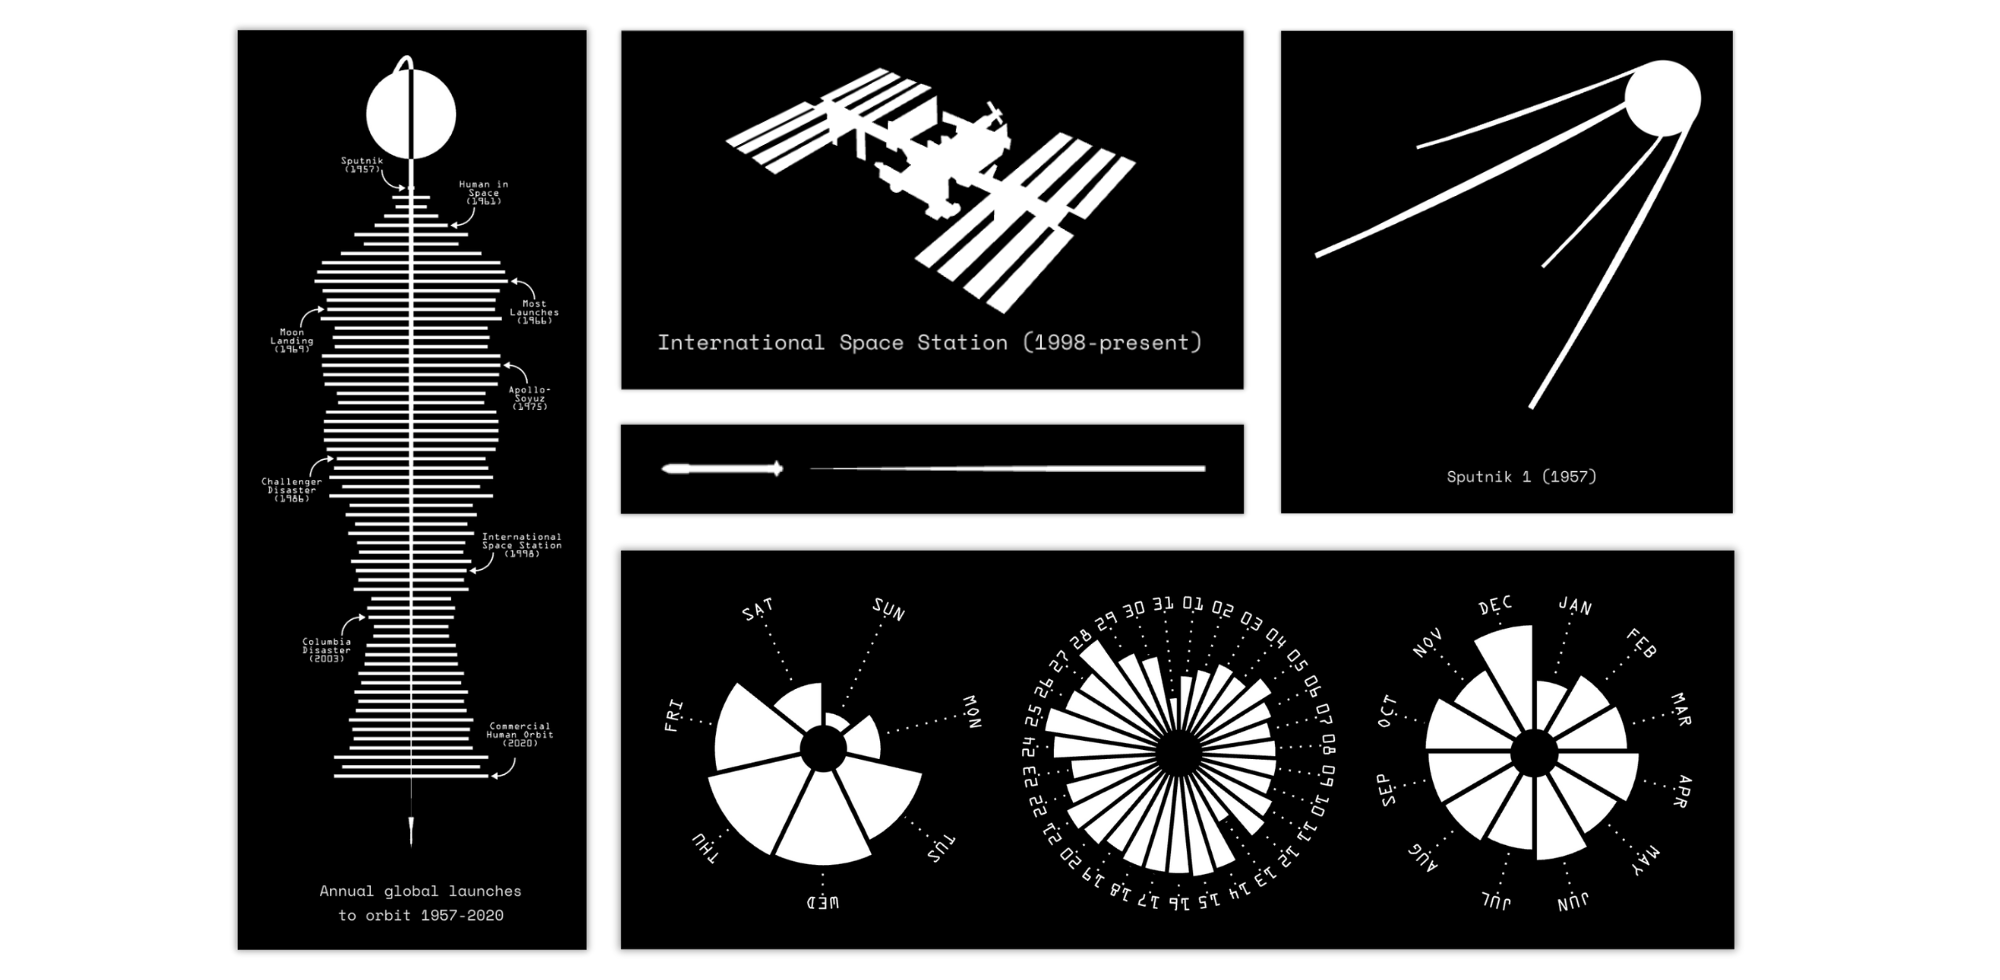
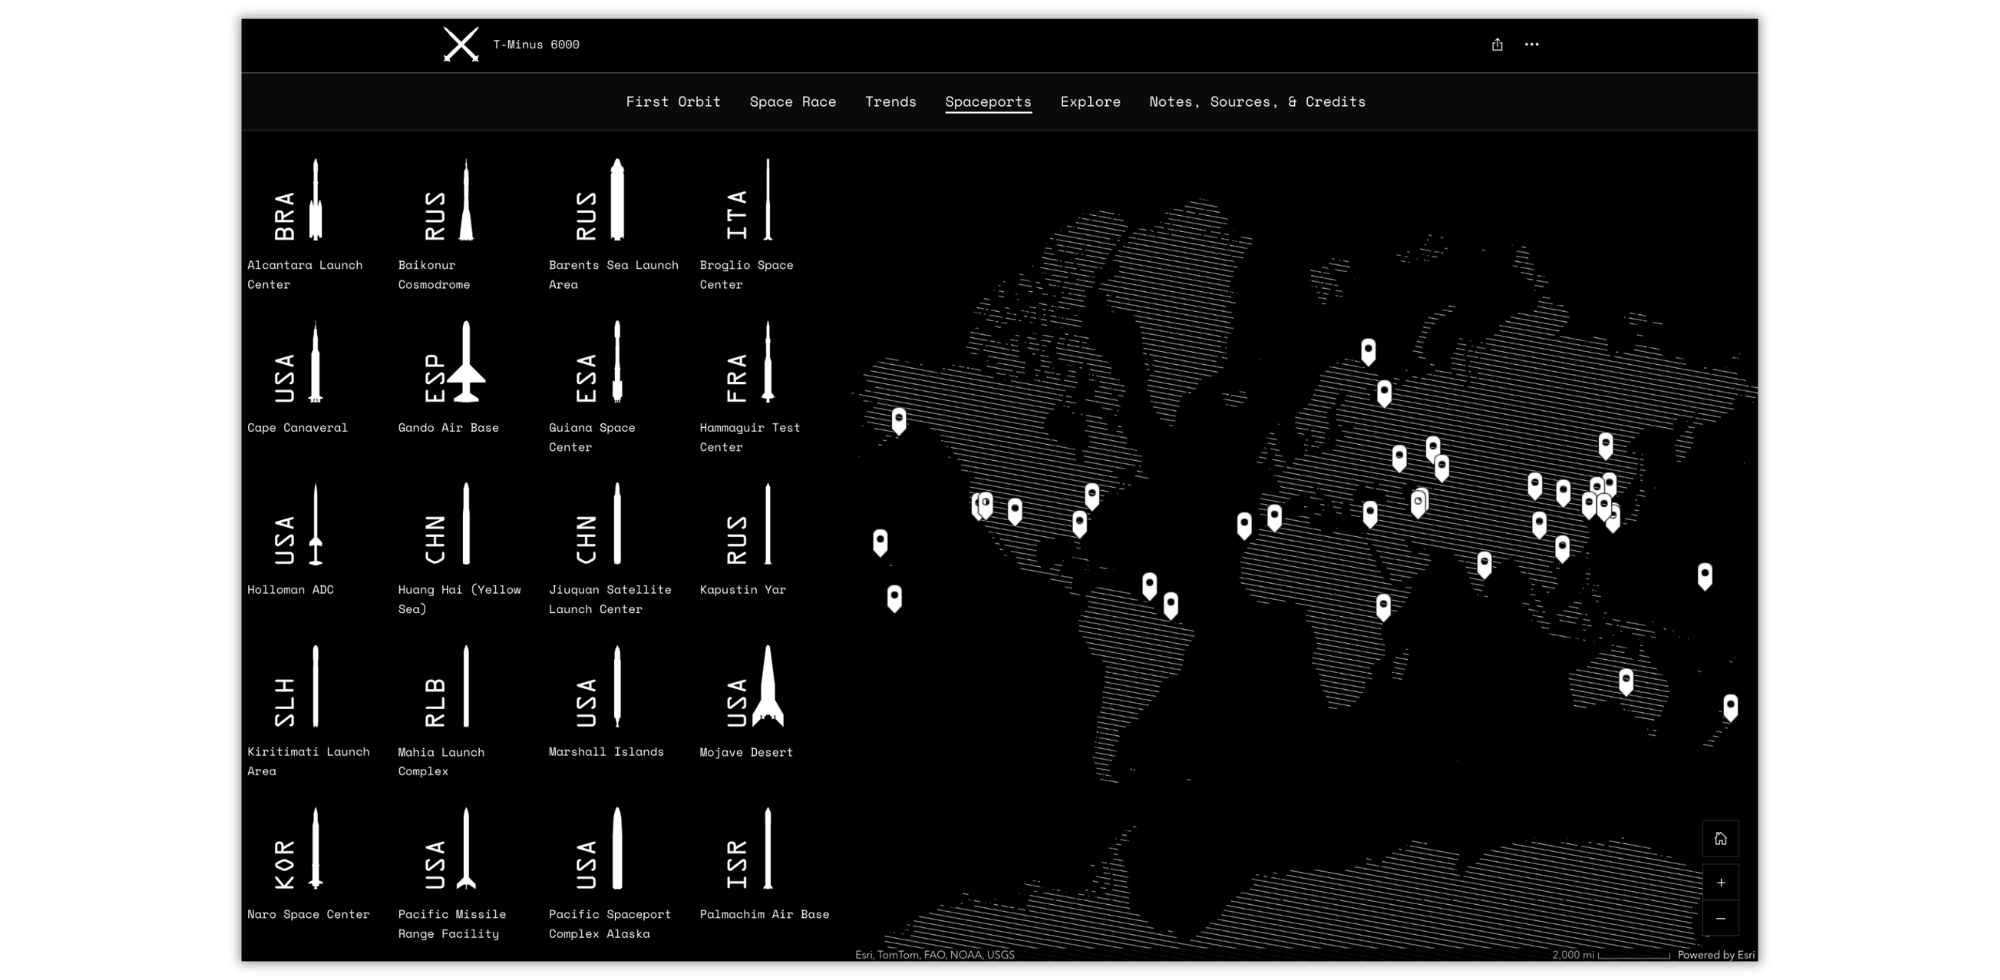
Some of them are just life experiences, like my dad working at the Kennedy Space Center in Cape Canaveral, Florida. He was always bringing home mission patches and other cool things, which sparked an interest in space exploration. And I’m always just cruising the internet for cool data. I follow astrophysicist Jonathan McDowell on social media, and he shared this data set that I just got so excited about (T-Minus 6000: Global Rocket Launches to Orbit, 1957-2020).
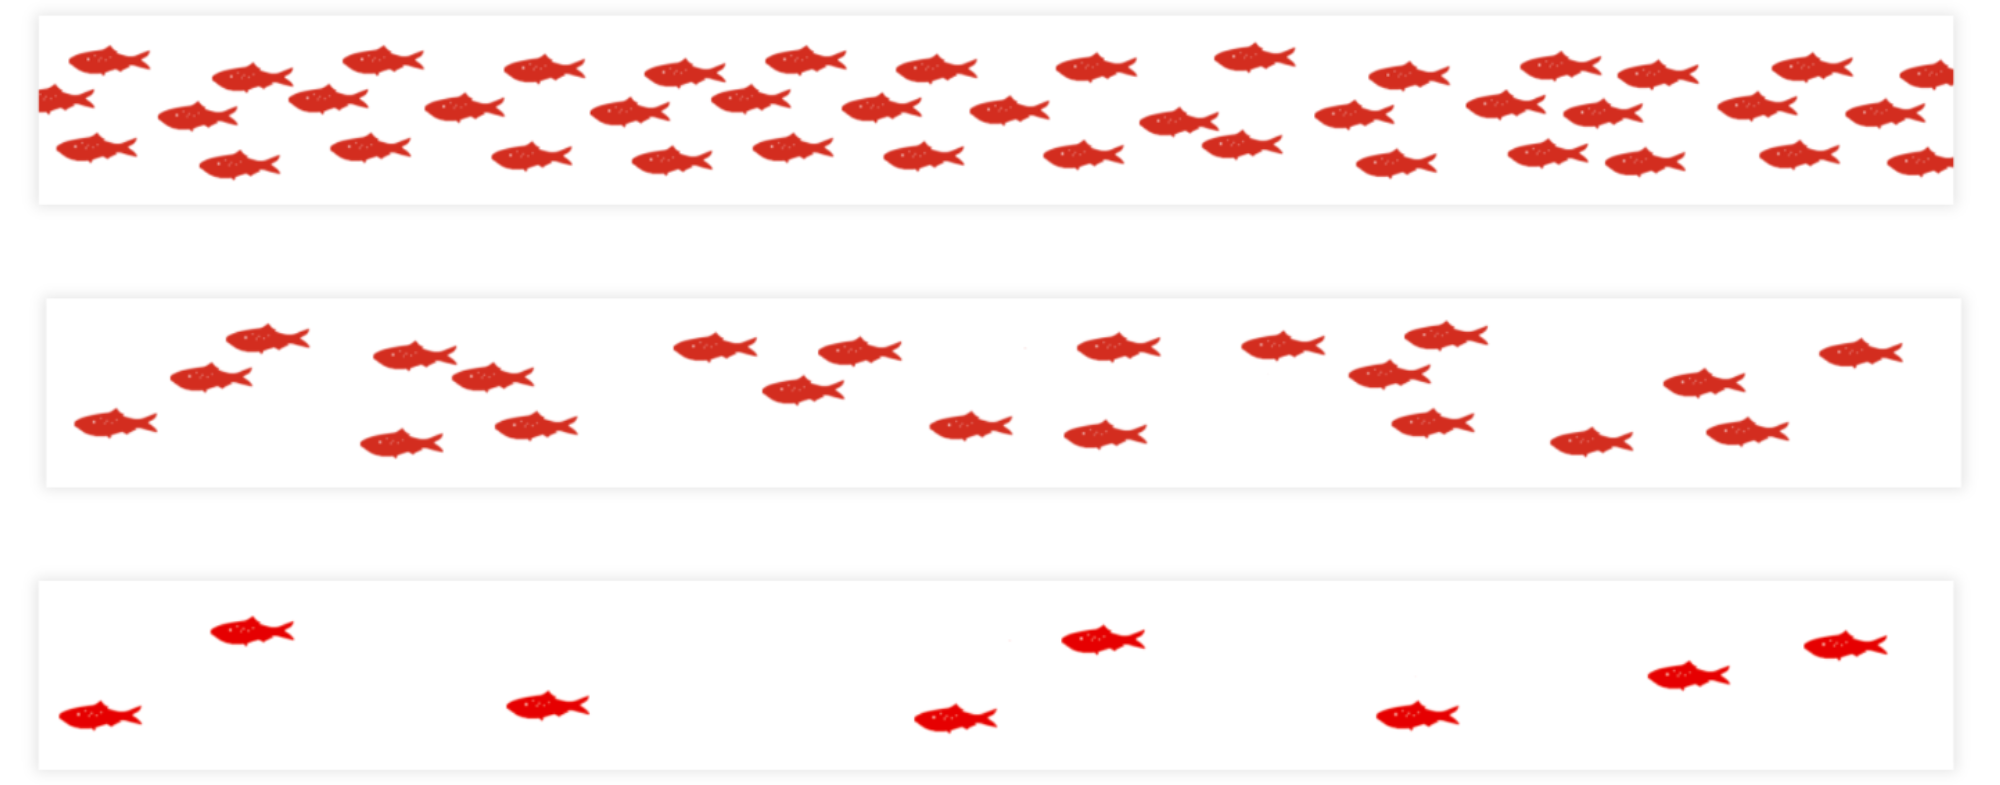
I read the book Cod: A Biography of the Fish that Changed the World by Mark Kurlansky, which is a great demonstration that non-fiction writing doesn’t need to be dry — rather, it can be kind of exciting. It also opened my eyes to fisheries, becoming part of the inspiration for writing Of All the Fish in the Sea.
A book by John McPhee titled Oranges. Longitude: The True Story of a Lone Genius Who Solved the Greatest Scientific Problem of His Time by Dava Sobel. The genre of microhistory greatly influences me, and I utilize this storytelling technique of delving deeply into a specific topic to communicate a broader concept.
With so many ideas bouncing around in your head, how do you decide which one to pursue deep enough to craft a story around it?
I have a note on my phone where I jot down anything of interest. I may never look at some again, but there are the ones that I keep coming back to — and the ideas that keep coming to mind are the ones that usually end up as projects. Currently, I’ve been thinking a lot about the Erie Canal and all the other canals in the state of New York. I’ve just finished a couple of books on the subject, so a story about that might show up at some point.
We’ll be waiting. Once you’ve selected your next story topic, what does your creative process look like?
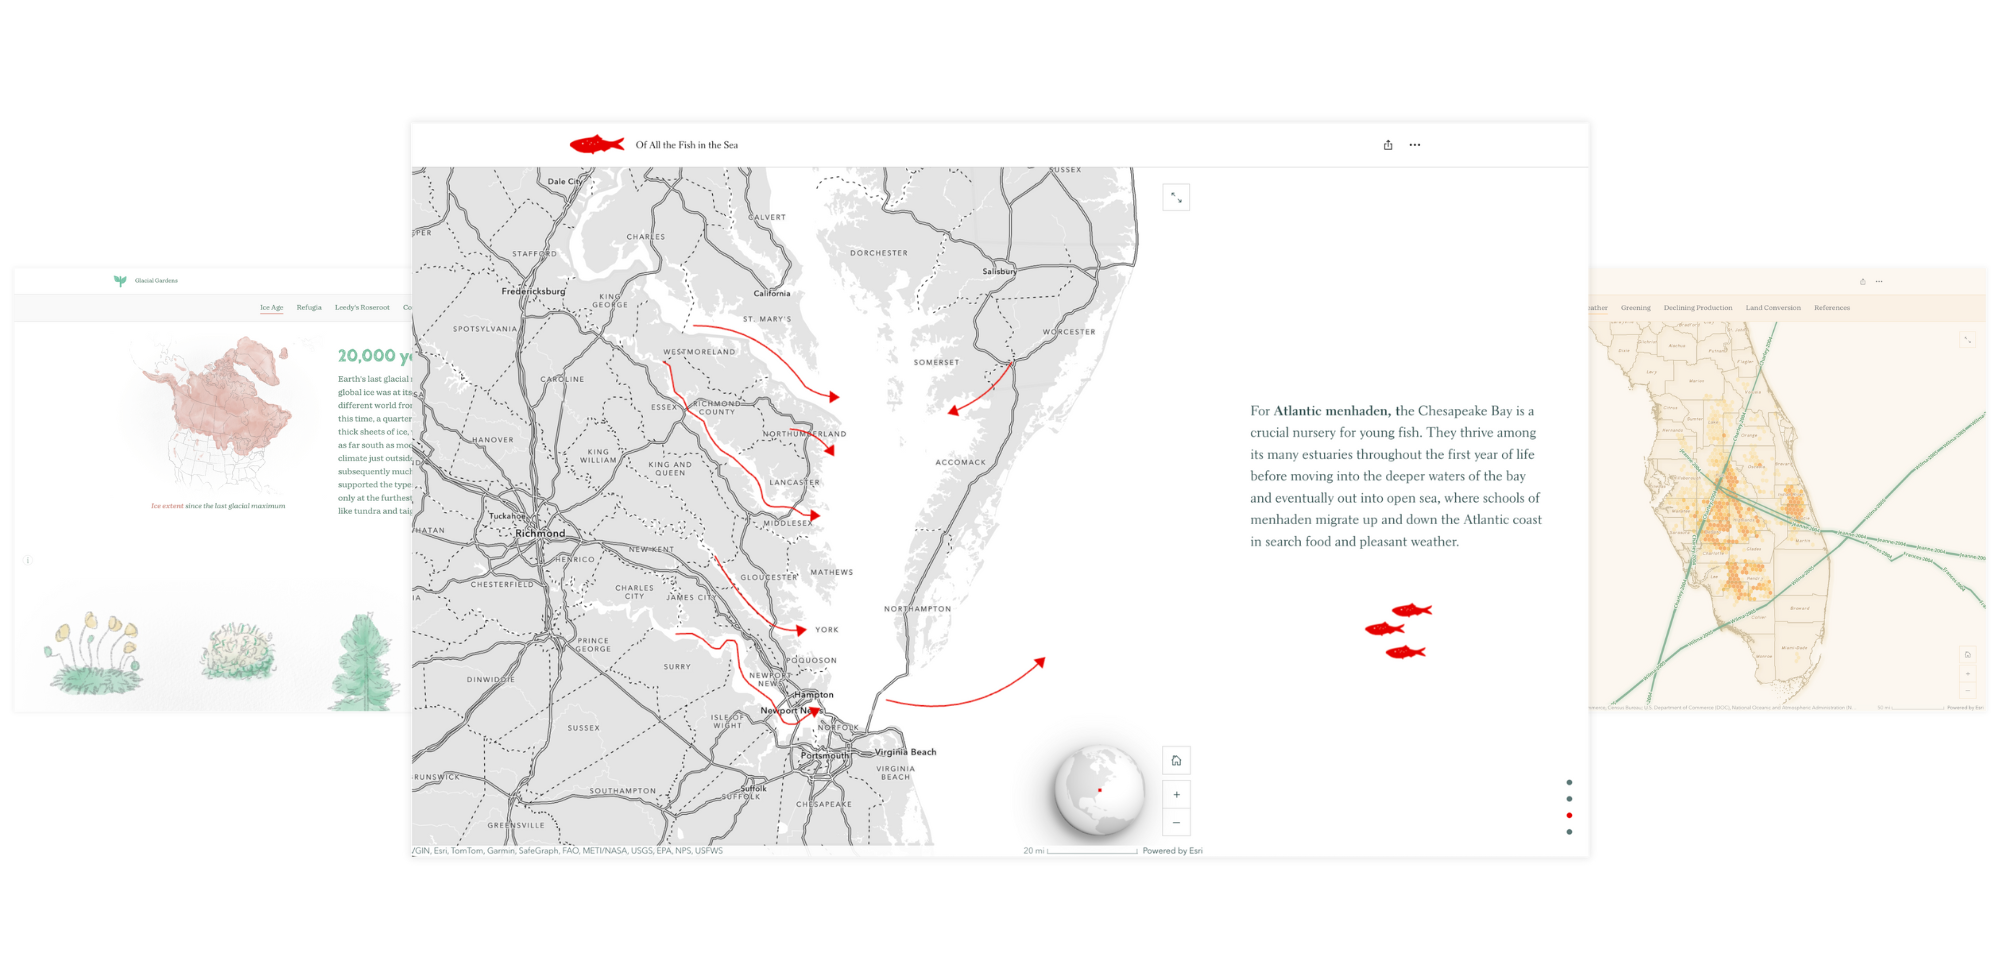
There are usually two approaches I have. One of them is question-based. With the menhaden story, some of the questions I was asking myself were: What’s the deal with this fish? Why is it used in industrial oil? What happened to the industry? Where did the fish go? So, from there, I’m looking for data and resources to first answer those questions and second, really emphasize or illustrate them. I was able to find total catch data, which I visualized using a bar graph. Then I also found a list of processing plants that could be mapped, which provides a better sense of geographical extent.
My other common approach is data-driven, as seen in the rocket launch story. I started working in reverse once I came across that data set. I didn’t know what story I wanted to tell, but I knew I wanted to do something with the data. I started by slicing and dicing the data in different ways until patterns or things of interest popped up, and then I crafted the narrative from there.
One of your standout skills is crafting a story that is just right in length — not too short, not too long. Being led by curiosity can often lead to tangents. How do you find that balance?
Deciding what to cut is one of the hardest parts of crafting a story, definitely. There’s always so much I could include, so I routinely check myself in terms of scope creep. I read my stories over and over, from top to bottom, constantly. By doing that, I can get a sense of what’s flowing right versus what is just sticking out. Something may be interesting, but that doesn’t mean it serves the story; instead, it just makes it too long.
This idea of repetition is important in managing the length of your story. Where else do you find it important when crafting a story that stands out?
I utilize practice and repetition to develop all of my skills, particularly those showcased in my stories, including design, writing, and cartography. I spend most of my free time making maps for fun, which gives me a lot of space for trial and error. I often run into dead ends with any of the graphics, charts, or maps I make because they just don’t work out. And all this repetition has helped me develop a certain amount of intuition, which I apply to making the final creative decisions for my stories.
Speaking of creative decisions, you’ve witnessed the evolution of ArcGIS StoryMaps very closely. Were there any new features in particular that informed your creative decisions in the builder?
Custom themes really kicked the door open for what I could do creatively, enabling me to craft a truly unique story. For the menhaden story, I came across a lot of black and white photos, so I wanted to incorporate that into my theme, and then added the red for its attention-grabbing sense of urgency.
When I’m looking at stories, I’m drawn to the ones where the author did something new or interesting — they’re sticky. Since that is my preference, I want to craft stories that do the same thing for others.
Aaron, thank you so much for sharing your curiosity with us! Before we go, is there any last piece of insight you’d like to share with our storytelling community?
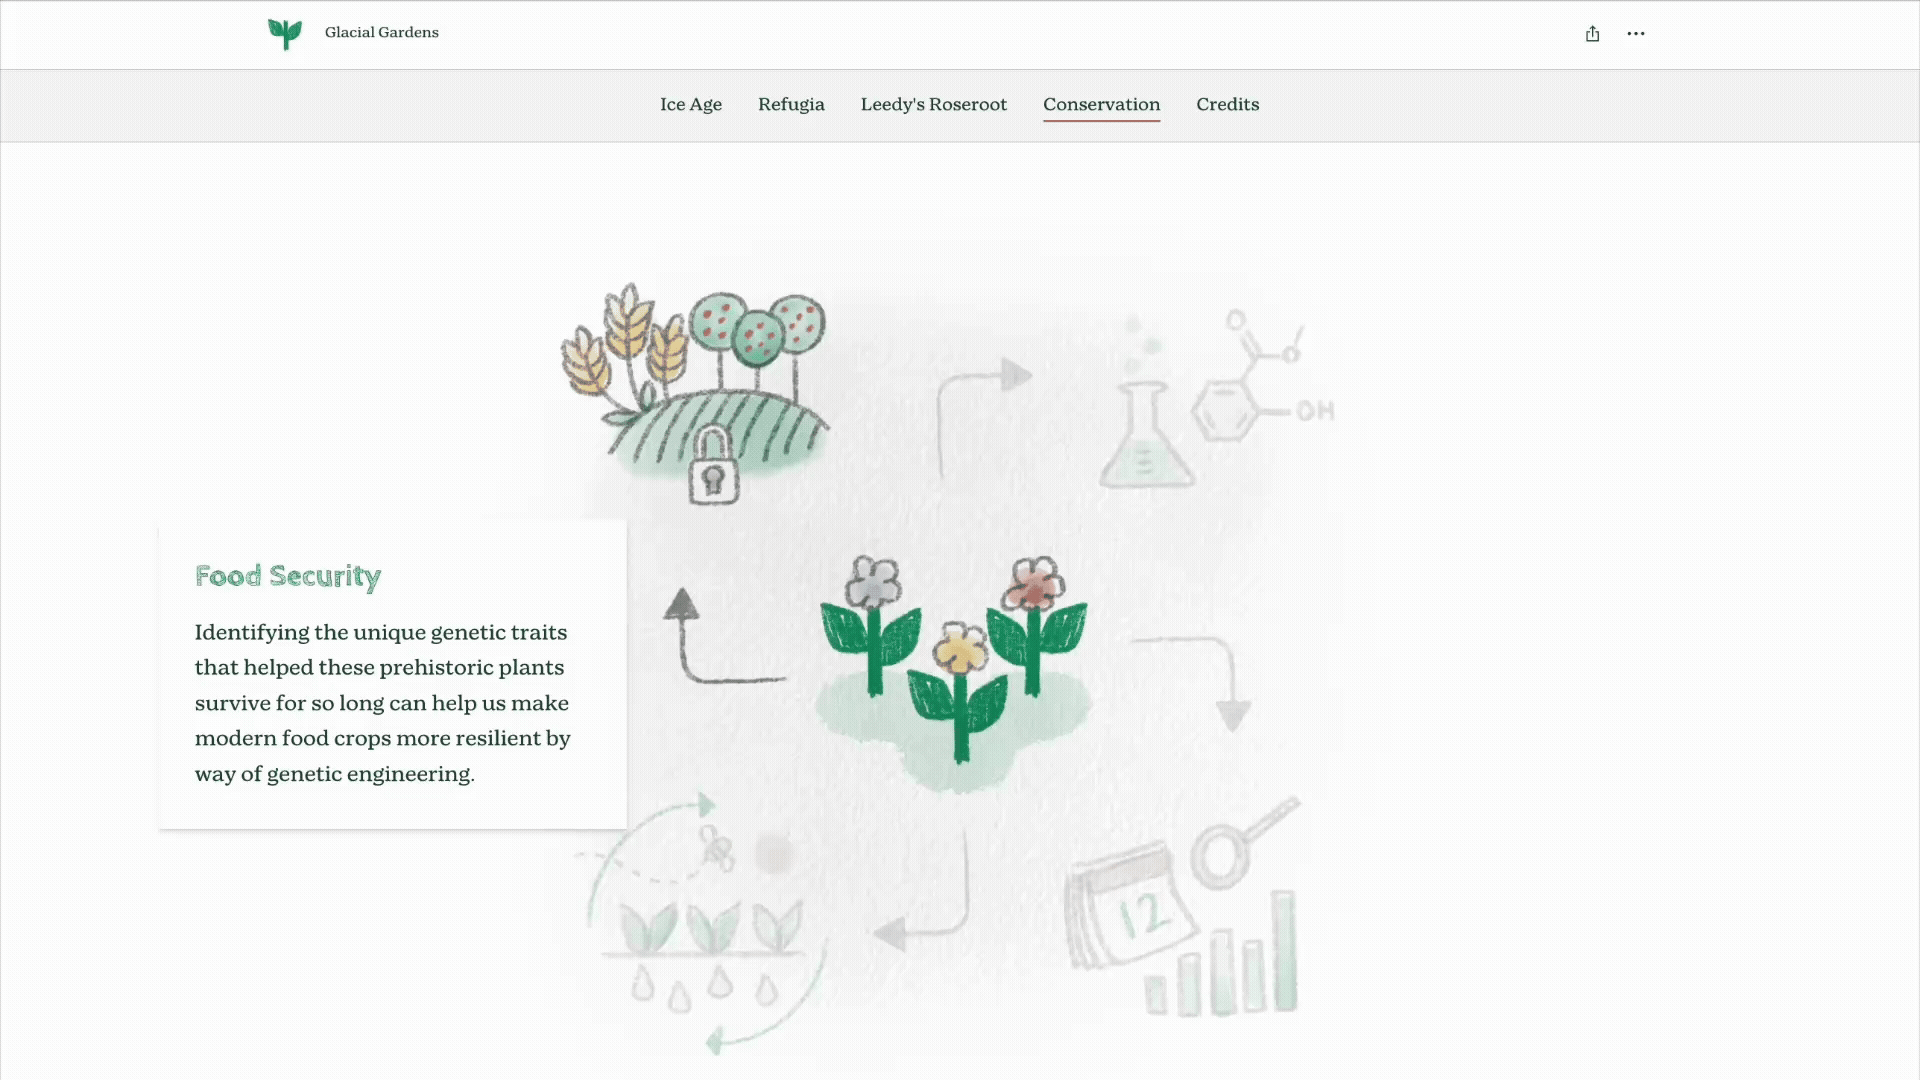
This conversation does make me wish I had a written process that I could easily share, but I’m not quite that organized. When I’m making these stories, I always try to relate the topic back to people and how it affects them — I think that’s really important in storytelling. What are the practical impacts or benefits of this? With the menhaden story, I wanted to highlight all the products that you might find this fish in, such as lipstick and dog food. With Green Oranges & Land: Challenges and Change in Florida Citrus, I wanted to share its relation to the state’s economy and its identity. And with Glacial Gardens: Relicts, Refugia, and Preserving Biodiversity, I aimed to explore the tangible benefits of studying and conserving these rare plant species.
This featured storyteller interview was prepared as a part of the August 2025 | Mapping marine life issue of StoryScape℠.
For more interviews and articles like this one, be sure to check out StoryScape℠, a monthly digital magazine for ArcGIS StoryMaps that explores the world of place-based storytelling — with a new theme every issue.


Article Discussion: