One major benefit of ArcGIS, over and above the powerful location intelligence capabilities of specific products, is that we are constantly improving the way ArcGIS products work together. For example, ArcGIS Survey123 now allows you to use content from ArcGIS Living Atlas of the World to build even more geographic intelligence into your forms.
For the uninitiated, Survey123 brings together the power of forms and GIS, allowing you to create, share, and analyze surveys with a geographic lens. Many organizations use Survey123 for their incident reports, damage assessments, and permit applications, and other use-cases such as citizen science, allowing others to collect information at their location.
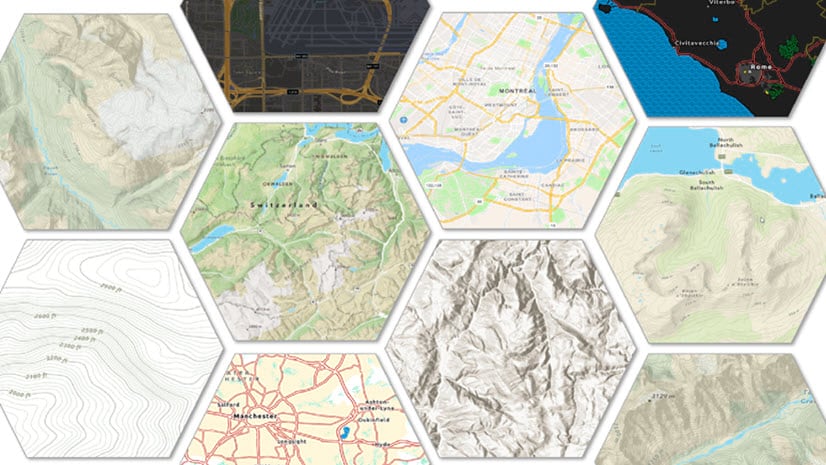
Living Atlas is the built-in content that is available throughout ArcGIS products. It’s the foremost collection of geographic information, including maps, apps, and data layers to support your work.
Leverage Living Atlas content when designing surveys
When you’re designing a survey, you can now use Living Atlas to:
- Make your survey maps more compelling
- Auto-calculate questions in your forms
- Create dynamic lists
We recently presented in-depth demos at September’s ArcGIS Survey123 Tricks of the Trade webinar. You can view the recording here. Let’s take a look at some of the highlights.
Make your survey maps more compelling
If you are designing a survey with a map displayed in the form, you can use content from Living Atlas to build that web map. This can help orient your respondents and provide necessary context, as well as make your maps (and by extension, your survey) more compelling, which can bump up response rates.
For example, in the web form below, the Outdoors basemap from Living Atlas is used in a question to help hikers report problems on a trail.

Not only does it look great as a backdrop against the trail layer, but it also provides accurate contour lines which provides context to respondents. Use basemaps such as Streets, Human Geography, or in the case, Outdoors to help orient your respondents so they can provide more precise locations when completing the survey. When adding a map question to your survey, click Expand to see available basemaps, or click Edit to bring in maps from your content, content from your groups or organization, or Living Atlas.
 and Edit. The Expand (32) button is highlighted, and clicking it exposes 32 basemaps from Living Atlas. This screenshot has it set to Human Geography Map.")
Do calculations based on answers to questions in your forms
 Median Household Income layer, what is the median household income in the census tract of the address in Question 1?\" The question also has a calculator icon next to it, indicating that this question uses a calculation.")
If you’re familiar with Survey123, you know that you can use responses from survey questions and build calculations right into the feature layer that Survey123 generates. Now you can do that with geographic responses (addresses or points on a map). Combine that address with other layers within Living Atlas, such as median household income, and extract data from that layer into your survey results.
Start by adding a question, and edit the calculation configurations. Select Layer as the source of the calculation, and add a layer from Living Atlas that will supplement your survey data. Next, select the field whose value you want to extract, and set the geographic filter to the question that captures the address.

The median household income field will show up in your feature layer of survey points, and the values will come from the layer in Living Atlas. Specifically, it will be the income of the tract in which the address entered intersects. You don’t have to do the joins later on!
You can even hide this question from the survey so that the respondents don’t see it. Less is more, so it can be helpful to hide questions that don’t require a response from your survey takers.
Dynamically populate dropdown lists
You can use the features in a layer in Living Atlas combined with the location entered earlier in a survey to populate a dynamic list in a dropdown survey question. For example, there are over 700 species in this Critical Habitat for Threatened and Endangered Species layer. But, you can show a small subset of those species as options filtered down using location. Set the filter to whatever buffer you’d like, say, if the habitat polygons are within 30 miles of the location entered in the map question.
Then when a respondent working in San Diego responds to the question, “What threatened or endangered species or habitat do you focus on the most?” they will see this:

Compare that to what a respondent working in Miami will see:

The beauty of using layers in Living Atlas for this is that it’s authoritative, it has geography connected to it, and if it’s a live feed, it always has the most up-to-date list of features.
Also, by using a dropdown survey item rather than a free-response text item, you are helping to ensure data quality. A dropdown list encourages respondents to pick the one that’s their answer, rather than write in their answer. Respondents can enter the same species (or other types of answers) in different ways, necessitating a large data cleaning job. Creating a dynamic list helps to avoid this.
Leverage Living Atlas content in your future surveys
This was a brief overview of what was demonstrated more thoroughly in the webinar. Check out previous Tricks of the Trade webinar recordings on Esri Community’s Survey123 page, where you can also post questions and interact with fellow survey creators.
We encourage you to experiment with your surveys – punch up your maps, add an appropriate calculation, or add a dynamic list. We are looking forward to seeing how you use Living Atlas content to build geographic intelligence into your surveys.


Article Discussion: