
One of the most impactful components of using GIS for planning and community development is how it moves discussions from strictly reactive to proactive. ArcGIS Urban can support you with a data-driven approach to planning and urban design, the build out of multiple development scenarios, and further engagement with property developers to identify designs that meet the characteristics and needs of a neighborhood.
To walk through how to get started with ArcGIS Urban, we are placing you in a previously industrial waterfront district of Mission Bay in San Francisco where you’re interested in developing the area to support an increase in affordable housing options and jobs. To visualize and analyze your planning scenario, you’ll use ArcGIS Urban – a 3D scenario planning tool that allows you to sketch build out scenarios, test land-use and zoning code changes, and evaluate your design with interactive metrics.
In this example you will:
- Create an Urban Model for Mission Bay
- Add your 3D basemap and parcels
- Author a new plan
- Sketch new buildings
- Add a new zone
- Create a new metric
- Conduct a shadow analysis
You will need:
- ArcGIS Urban license
- An ArcGIS Online account with a Creator user type.
If you need an ArcGIS Urban licensed account, you can sign up for a free trial through Learn ArcGIS.
Create an Urban Model
You can create an Urban Model through ArcGIS Online on the Content tab.
- Sign into your ArcGIS Online account and click Content.
- Click Create app and select Urban.

3. Click New and for Template, choose US Default. Give it a name such as “San Francisco Mission Bay” then click Set up Urban.

The application will take a few minutes to create services. The USA Default template will open onto a blank Scene. The USA Default template includes basic data for zoning types, building types, overlays, and project statuses that you can use instead of importing your own data.
Add your basemaps
Now that your Urban Model is created, you will add your custom basemap layers and parcel data.
1. In the search bar, search for and select Mission Bay, San Francisco, California.
The map zooms to the area.
2. Press the X in the search bar to remove the location point.
3. On the top right of the toolbar, click the Manage button.

The Data Manager tab will open.
4. Under 3D Base Layers, for Existing buildings layer for schematic visualization (SceneLayer), click the Select Item button.

The Portal Item Picker opens.
5. From the dropdown select ArcGIS Online.
6. Search for and select Buildings_MissionBay, owner: Learn_ArcGIS. Click OK.

7. Under 3D Base Layers, for “Existing buildings layer for imagery visualization (SceneLayer)”, click the Select Item button.
8. From the dropdown select ArcGIS Online.
9. Search for and select “Nearmap_Mesh_MissionBay”. Click OK.
10. Scroll down on the main settings page to the Initial Visualization setting and choose Imagery .

3D mesh datasets offer cost effective and highly realistic context for your work. This example will use a sample 3D mesh of San Francisco from Nearmap, learn more about 3D coverage in your city.
Add your parcels
Now you’ll add the parcel data. Normally, when you first setup your urban model, you would bulk upload the entire city’s parcel data, zoning data and more, but for this example you will only include parcel data for Mission Bay. If needed, you could also draw individual parcels into the plan. For more information, read through the Prepare data and Add and configure layers documentation.
1. On the data manager toolbar, click Layers and select Parcels. On the parcels page, click Add.
2. Set search to ArcGIS Online. Then search for and select District_Parcels_MissionBay, owner: Learn_ArcGIS. Then click OK.
3. In the next window, you have an option to match attribute fields to be used in the model. For this example, we will skip this step, click OK.
4. A blue loading bar will appear while ArcGIS Urban imports the parcel data. Once finished, it will read 1,786 have been imported and also validated. Click OK.
5. On the top left of the toolbar, click the back arrow button to return to the overview.

3D buildings are added for the city of San Francisco. You can navigate around the scene by left-clicking to drag, right-clicking to tilt and using the mouse wheel to zoom.
6. For the rest of the tutorial we’ll switch basemaps, click the hamburger menu, then click Imagery.

Draw the planning area
The planning area defines the extent of the plan. This planning area is also where you will later author your plan with building types and space use types.
1. On the top right of the overview toolbar, click the Add button and select Zoning Plan.
2. Tilt your view to a more top-down perspective by clicking the tilt view button, then click the north arrow button.

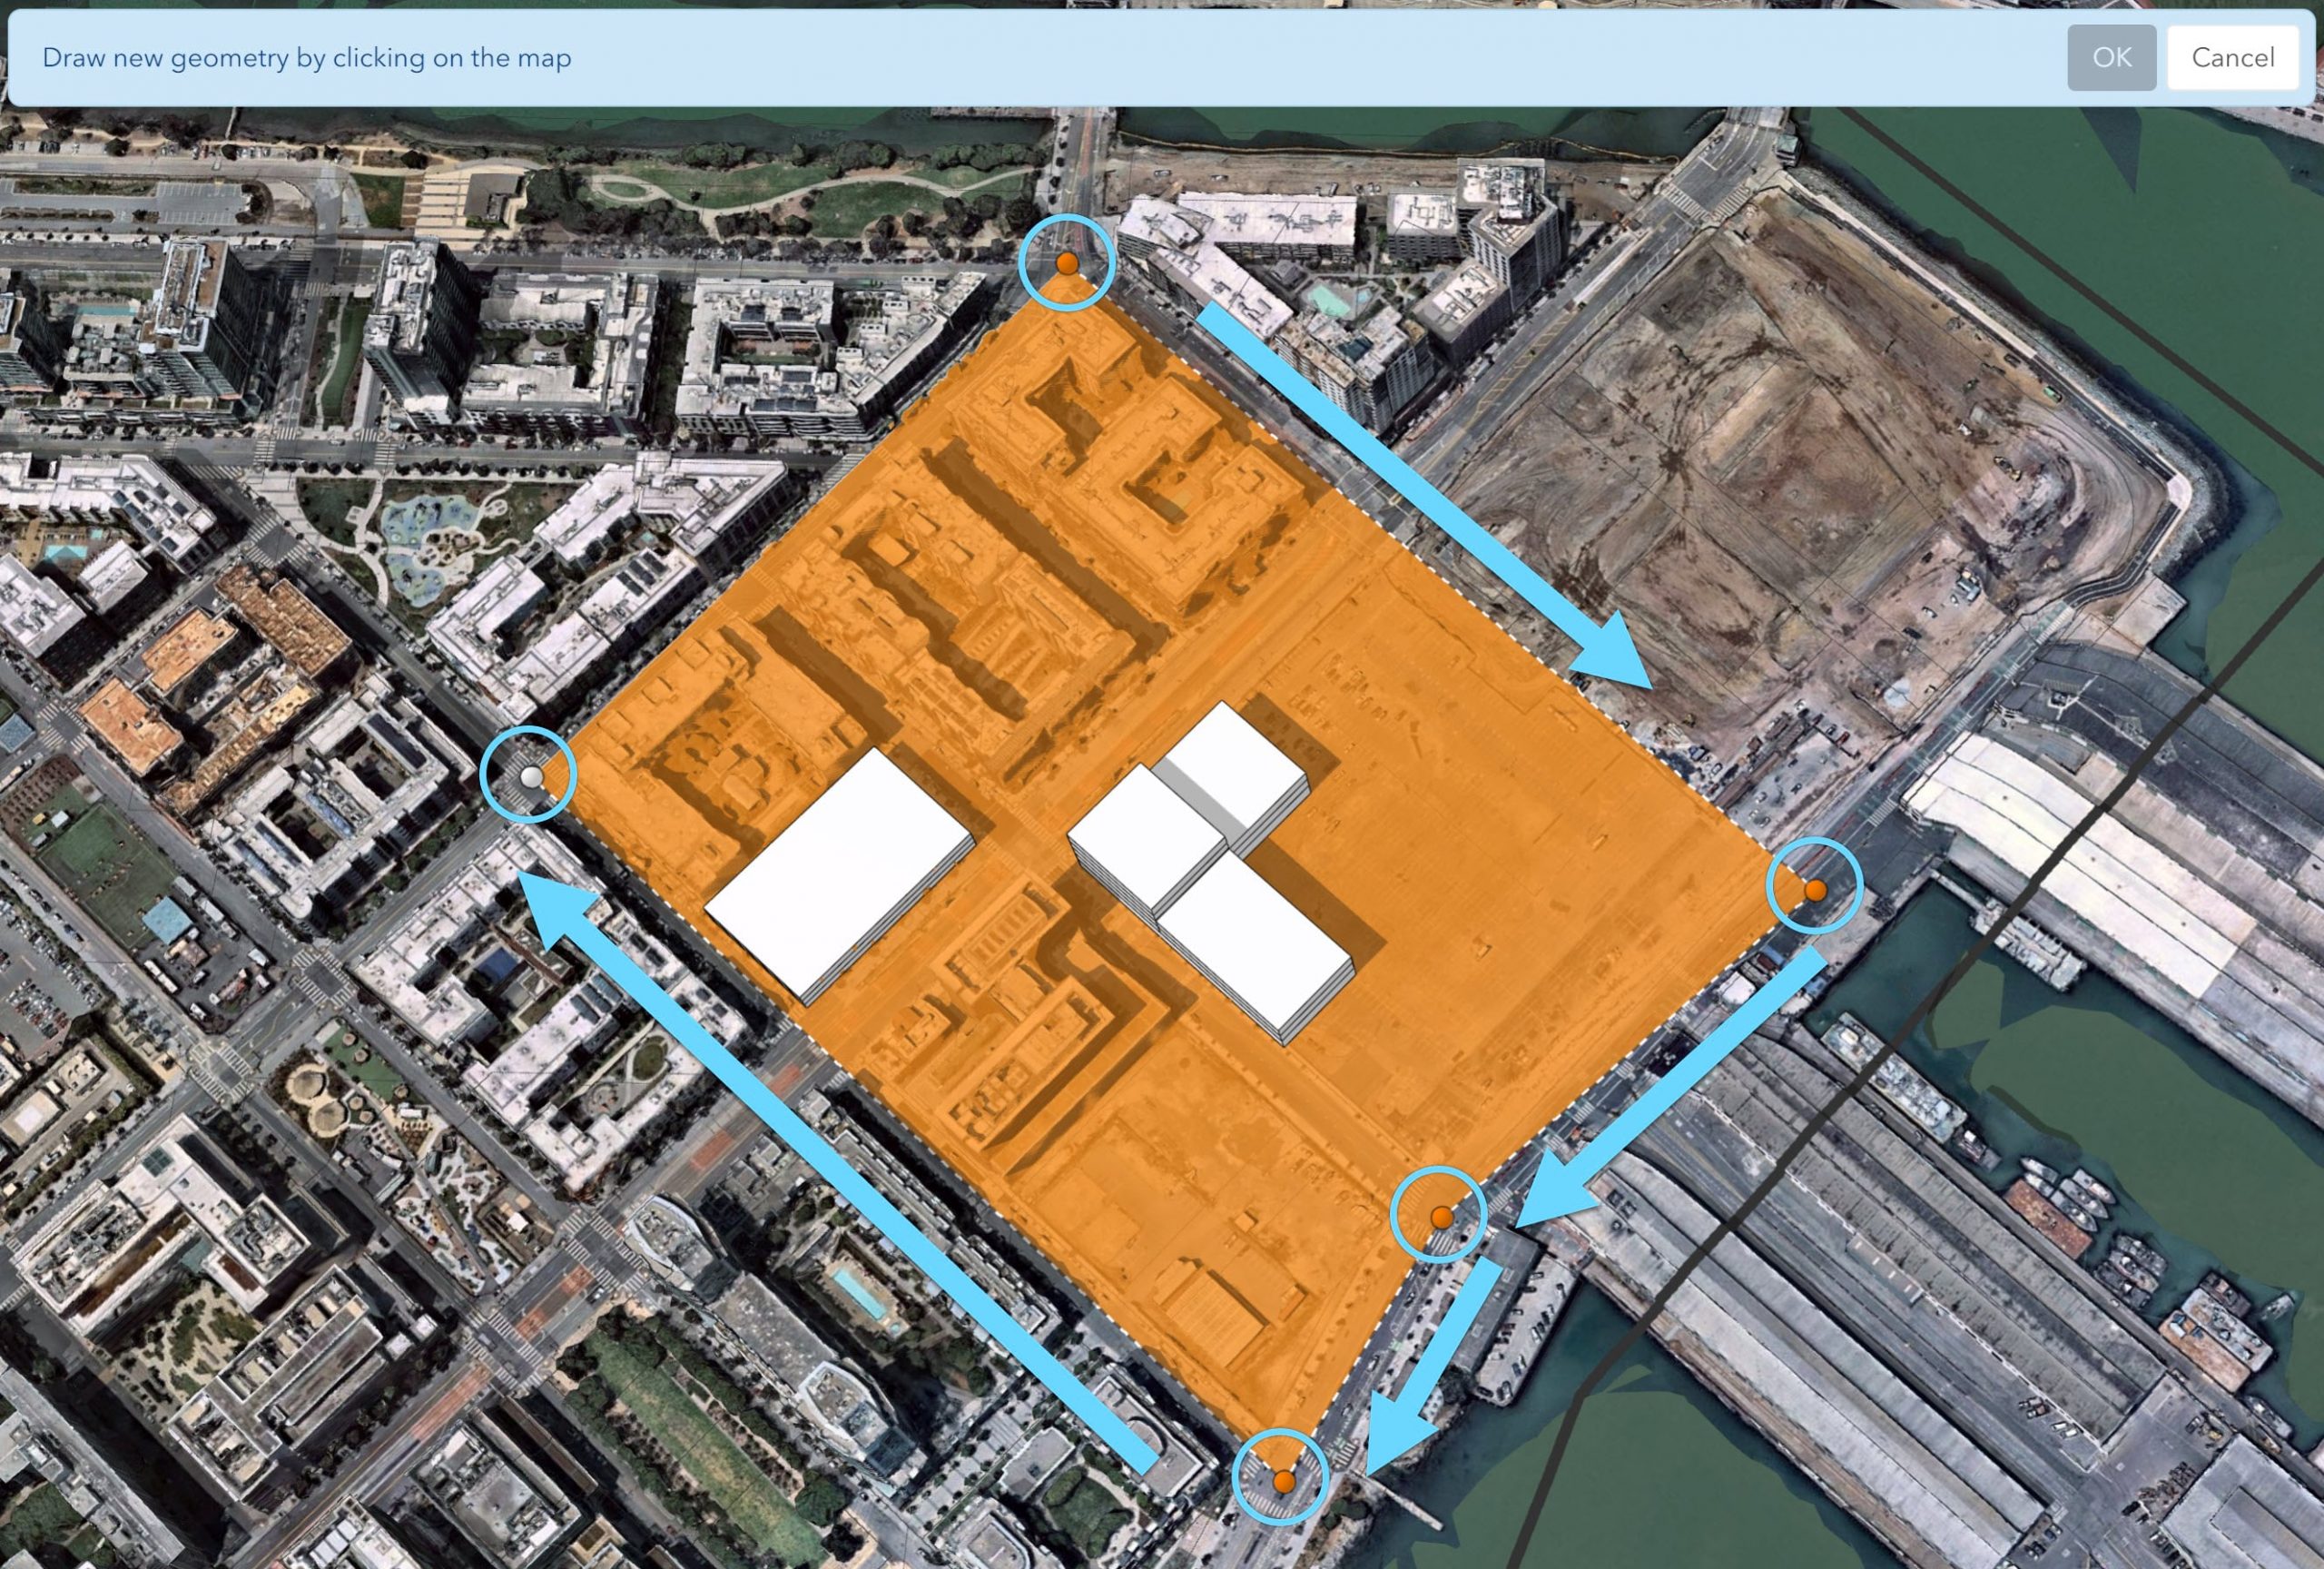
Now it’s time to draw your plan area which will extend from the Chase Center stadium, up to the Mission Creek Channel.
3. Draw your plan area by clicking points around the map, similar to the example below.
4. Double-click to finish drawing. You will then have the option to name your plan and provide a general address. Then click OK.
- Name: Mission Bay Plan
- Address: Mission Bay, San Francisco

5. Once the plan has been created, click Open.

Sketch new buildings
Once a plan has been created, it can be authored in ArcGIS Urban. You can edit the plan by drawing features, such as new buildings, parcels, or zoning boundaries. We’ll start by applying a building type to one of the parcels within the plan. Then we will select another parcel to draw a building from scratch.
1. After opening the plan, select Scenario 1.
2. Select the following parcel towards the middle of the plan area next to the residential apartment blocks. Similar to the image below.

3. With the parcel selected, click Modify, then Apply Building Type.

4. Choose Low-Rise Office to apply the building to the parcel.

When applied to a parcel, building types respond the underlying zoning codes that may have been imported into ArcGIS Urban. In this case we have not imported zoning layers yet and the building will choose to maximize coverage and heights selected on the building type itself. We’ll be adding a new zone to our plan in the next section to illustrate the effects this may have on the building.
5. Next, we will sketch a new building from scratch on the large vacant parking lot across the street. First select the parcel associated with the parking lot. Then select the Edit Spaces
6. Choose the Draw New Building Space

7. Start drawing a new building by first clicking on the corner of the parcel. Notice how the tool will snap to the parcel edge and also symbolize successfully snapping to the corner by showing an orange circle.

8. Keep drawing the new building by following the side of the parcel down the street and clicking once more to set a new node. Note that snapping to perpendicular edges is enabled automatically and is symbolized by an orange square. This will allow you to square off this side of the new building.

9. Continue drawing your new building until you come to the parcel edge. Double-click to finish drawing.


11. With the building still selected, you can switch the space use type by clicking the ellipses. Let’s choose to make this new building Residential Multi-Family and also edit the Floor Height to 20 ft.

12. Now let’s add a few more floors to our new building. Select the floor you would like to duplicate, then click the Duplicate Each time you click, you will generate a new floor.

13. You can further refine the building form by choosing the tool for the edit you’d like to make. You can select the individual floor you want to adjust, this includes deleting the selected floor. Have some fun and create your own architectural masterpiece.

Note: You can also draw new building spaces on top of existing ones. Snapping and other drawing guides will help you add towers and more than one space use type on a single floor level.

Add a new zone
Zoning boundaries can be uploaded as a feature layer through the data manager (similar to how we added parcels in a previous step) or new zones can be drawn manually in the plan. Since you are just getting started here in your first plan, you will manually add it.
1. On the toolbar, click Zoning. The zoning workflow toolbar appears.

2. On the vertical toolbar, click Edit Geometry then click Add.

A drawing interface will appear along with transforming your mouse pointer into the first node in the new zone polygon that we will be drawing.
3. Draw your new zone polygon by clicking once in a nearby intersection, then by clicking repeatedly until you have completely encased your two buildings. Double-click to complete your new zone.
4. You can also adjust your polygon by moving the individual nodes or by clicking on the smaller mid-point nodes. When you are happy with your new zone, click OK.
The zoning boundary is added to the view and the Single Family Residential (SFR) zoning type is automatically assigned. In the right panel, you can see the total breakdown of zoning types by land area.
You also have the option of splitting zones (and parcels) through the Edit Geometry toolbar.
5. Select the Split icon, which looks like a pair of scissors, and snap to either end of your zone to divide your zone along the main street. Double-click to finish your split line. Then click Split.
6. The result will be two zone polygons that can each be assigned a new zone. Click Done to end the edit session.

7. Now we will assign a zoning type to each of the new polygons. Select the first zone that encompasses our first building, click Modify in the right panel, and select Mixed-Use.
8. Then select the second zone that encompasses our custom building, click Modify, and select General Commercial.
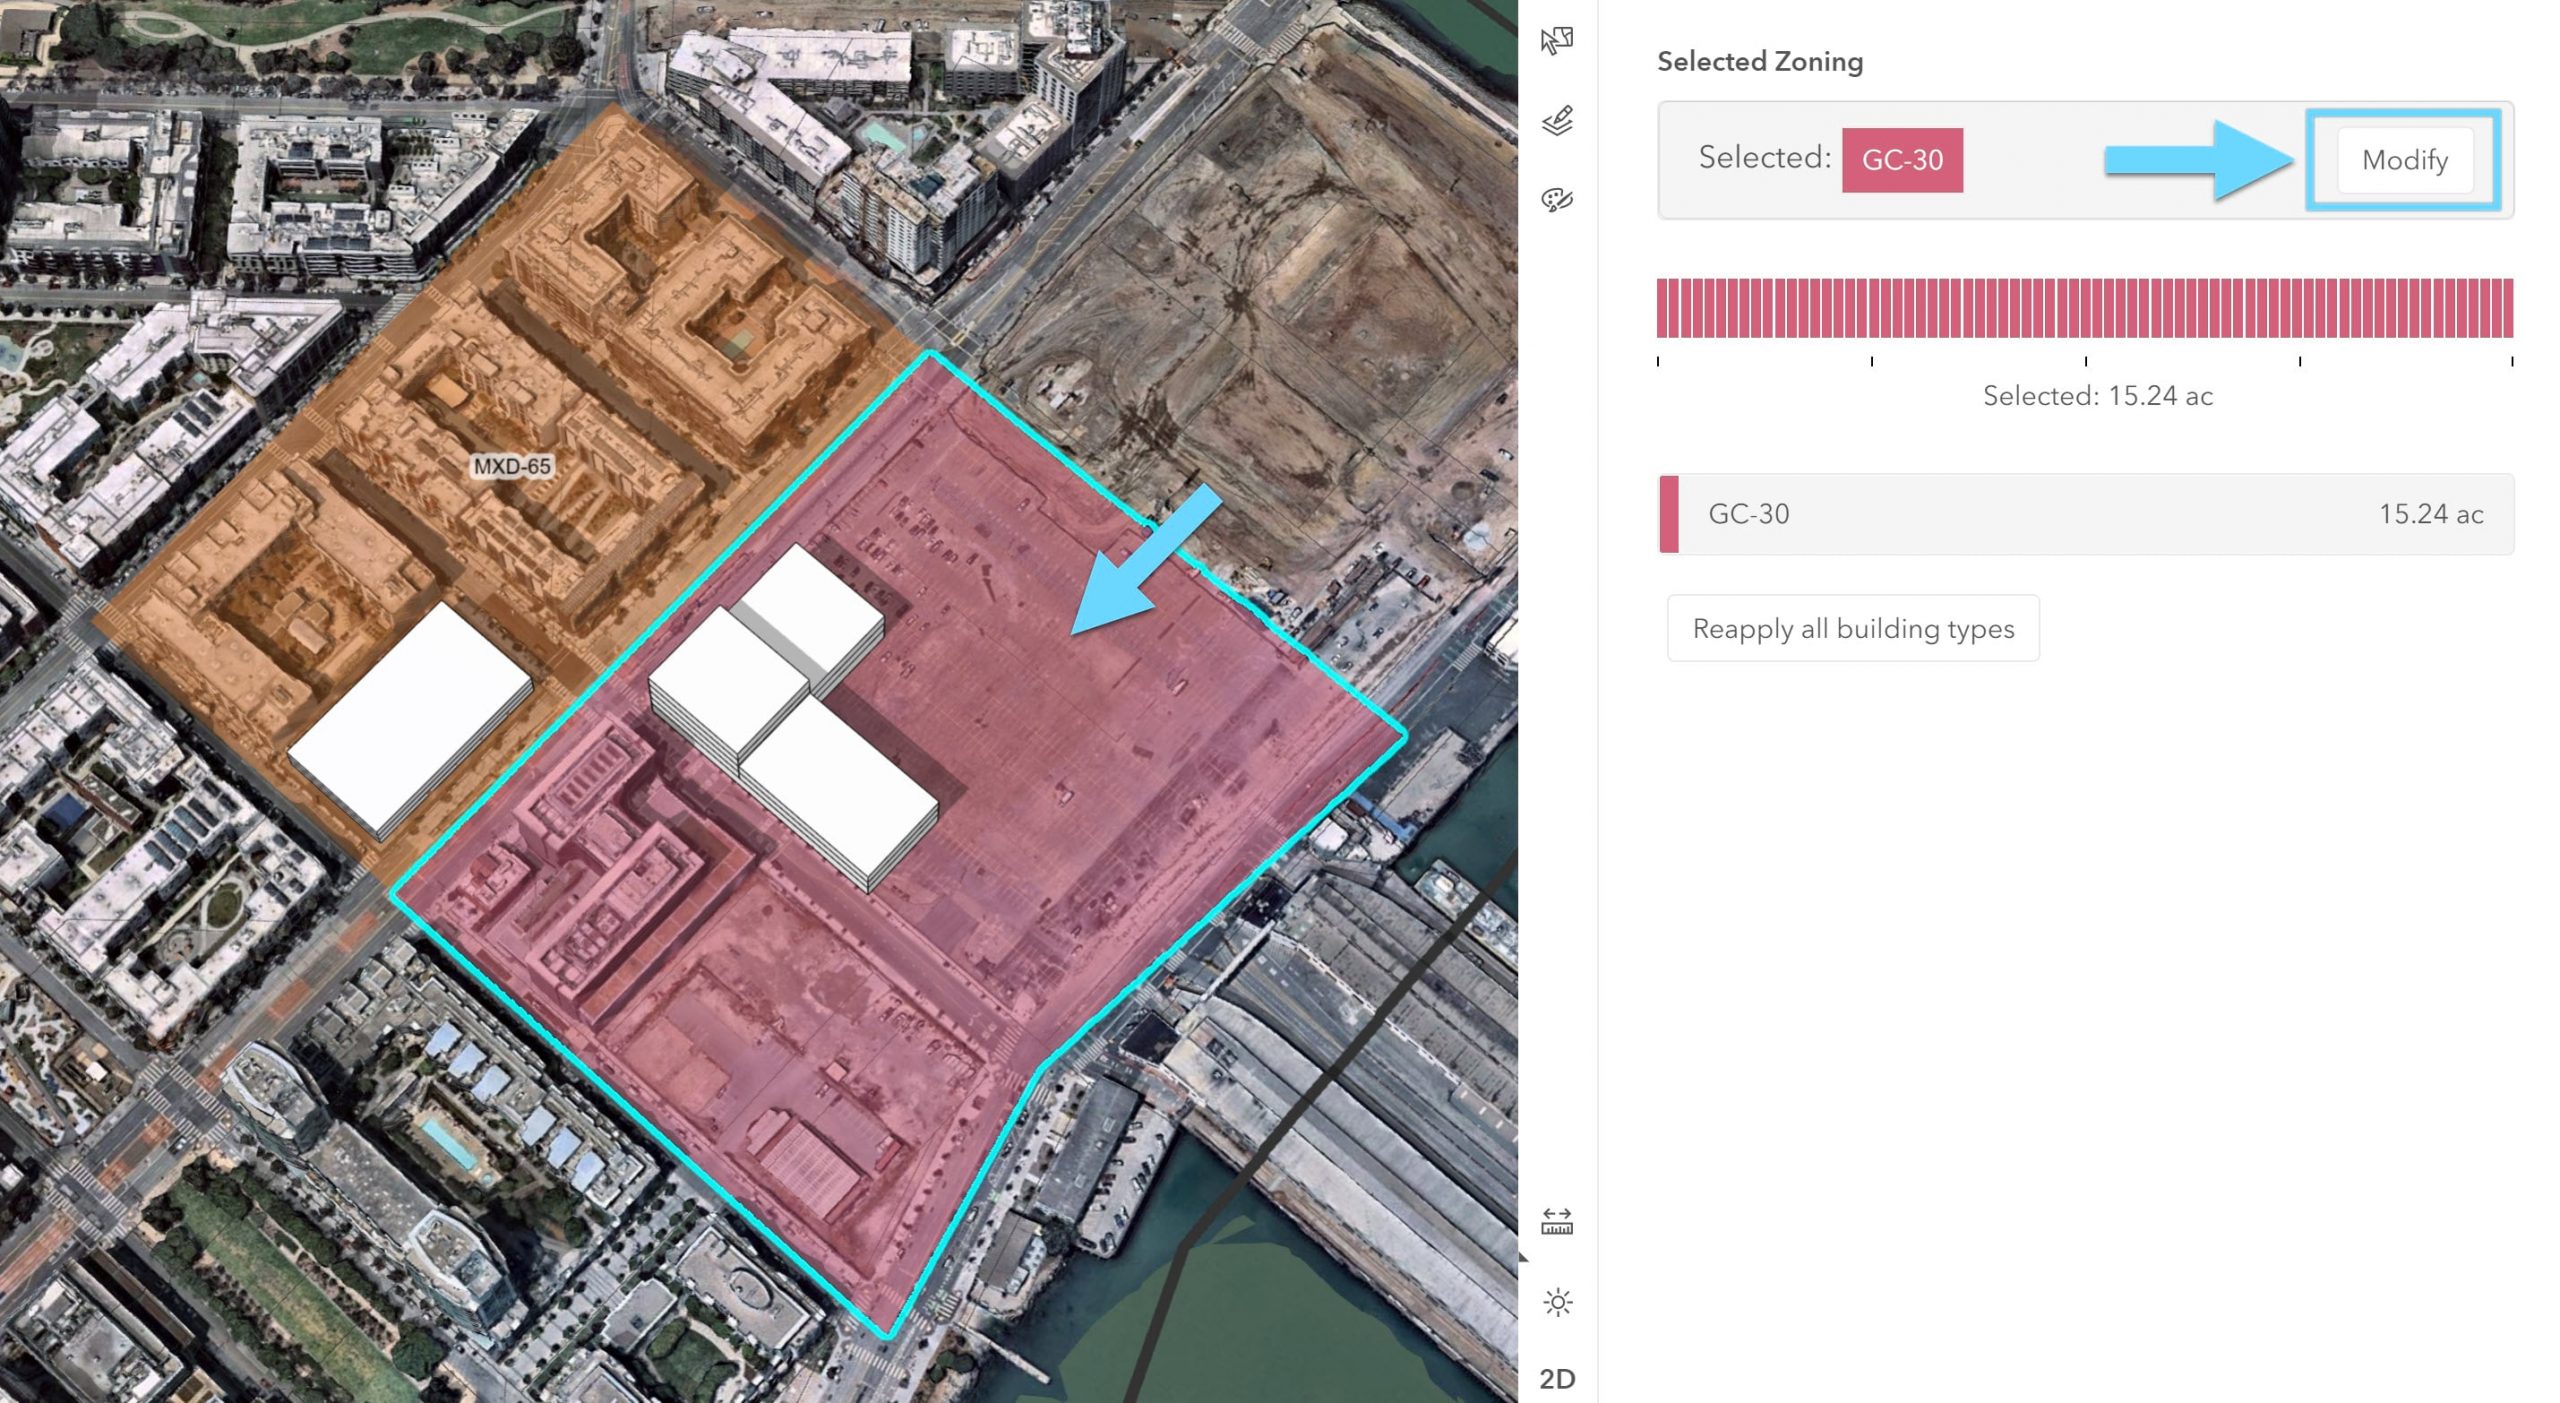
Now that we have applied two zones to our plan study area, we will now explore how the parameters programmed into the individual zone types can impact the form of buildings that may be applied to parcels that overlap the zones that may exist.
9. Select the orange Mixed Use zone and click the name MXD-65 in the right panel.

10. Now we will alter some of the default parameters in this example zone. Scroll down and click on Tier 1, then change the Front street setback to 5 ft and the Side interior setback to 20 ft. Once you have made the edits, scroll down and click
11. You will be prompted with a warning that you are about to modify an existing zone, click Yes.

12. Now let’s find out how our new setbacks may impact our buildings. Click on the Development icon to return to the toolset focused on parcels and buildings.

13. Zoom in to your first building (Low-Rise Office), select the parcel, click Modify in the right panel, and then choose Reapply current building type.

You will notice right away that the edges of the parcel now produce a setback based on the underlying zoning parameters. If you were to apply a new zone or continue editing the parameters of the existing zone, you will find that these changes will be reflected on the building itself.
14. Setback parameters are unique in how they each reflect a specific parcel edge orientation. You can change the edge orientation for a selected parcel by clicking on the Edge orientation.
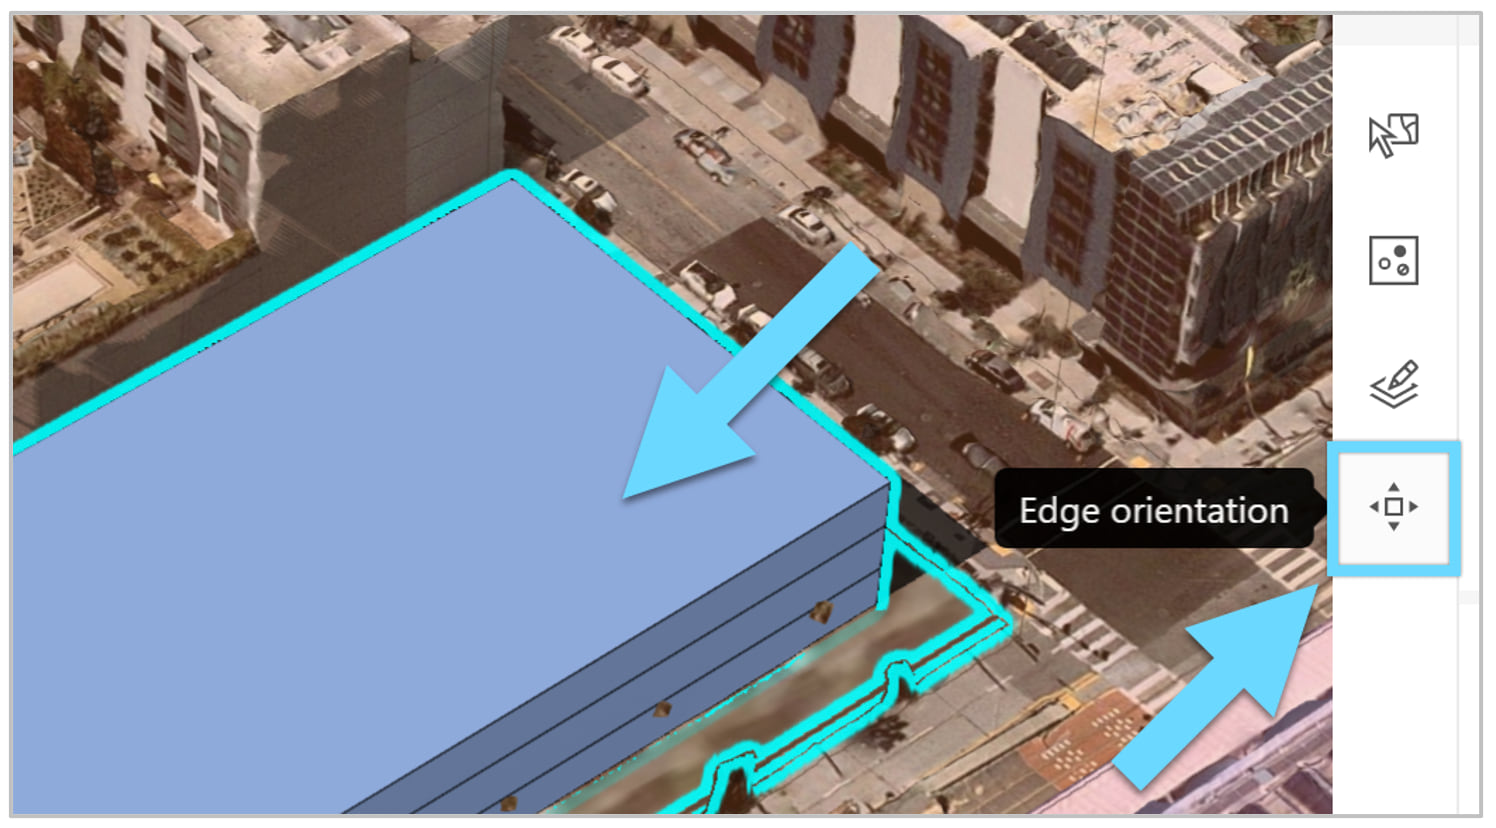
15. You can then select individual edges of the parcel and set their orientation. Select the edge of the parcel along the main street, click Front and then click Street. This will update the label accordingly. Then click Done.

16. Reapply the building type to see the effect. Click Modify in the right panel, and then choose Reapply current building type.
17. Double-click the building and select a floor to continue editing the form of the overall structure on the parcel. Custom edits will no longer automatically respond to zoning changes, but you will always have the opportunity to reapply the original building type.

You have so far learned how to apply building types and sketch new buildings on parcels as well as applying and modifying zoning. We will now explore how custom metrics can be used to compare planning scenarios and provide a better idea of how our plan performs.
Create a new metric
A plan’s dashboard allows you to compare scenarios and report on important metrics within the plan related to total jobs, residential affordability, parking supply and demand, and overall financial performance. The metrics are calculated based on the space use types assigned to each building within each parcel.
For example, residential space use has a net square area that can be divided by apartment unit size to give you a total number of household units. These units can then be multiplied by 80% and 20% accordingly to output metrics that provide the total market rate and affordable unit counts. To create a summary of residential affordability in our plan, we will build this example.
1. To add your own metric and edit existing metrics, click the plan name, and then click Configure.

2. Once the plan settings have opened, click the Metrics tab in the navigation bar at the top.
3. The Metrics tab gives you an overview of the metrics that currently exist within the plan. The metrics are visualized in a dependency graph to provide easy visual indication of the inputs and outputs. Click the Add button in the top right.

4. Metrics can contribute to the creation of new metrics. For the first new metric we will utilize the pre-defined Household metric as an input and calculate Market Rate Units, then click OK. Then click the Add button again, and for the second new metric, we will utilize the Household metric as an input again and calculate the Affordable Units. Both new metrics should be filled out similar to the example images below:

Once added, these two metrics will be visualized in the dependency graph linked to Households.

Now we need to create a new metric that combines both Market Rate Units and Affordable Units into a single summary that can be used to visualize the overall Residential Affordability of the residential space use within our plan.
5. Click the Add button, then name your new metric and add Market Rate Units as the first source. In this case we will select Constant as the weight and enter the number 1. This constant will be used to add the Market Rate Units as an individual value in the weighted sum. Then click Add Source.
6. Now fill out the second source one in a similar way but this time using Affordable Units as the input. Select Constant as the weight and enter the number 1. Notice how the calculation preview simplifies to show the Market Rate Units + Affordable Units. Click OK.

The resulting metric will be visualised underneath the previous two metrics.

Now we will add the default parameter values to our residential space use type.
7. Click the Types tab in the navigation bar and select Space Use Types.

8. Click the ellipses button next to the Residential Multi-Family space use type to launch the editor.

9. Once the editor has opened, click on the Metrics parameters Type “units” into the search bar to filter the list to only the two that we will be editing. Then enter 0.2 into the Affordable Units default and enter 0.8 into the Market Rate Units default. Click OK.

These two parameters will be used to designate 20% affordable and 80% market rate according to the input of total household units.
10. Click the back arrow button in the navigation bar to return to the plan.

11. Once the plan has opened back up, click the Dashboard icon. The dashboard then appears.

12. You can arrange the order of your dashboard and choose charts to display information. Click the Edit Dashboard button which resembles a pencil.
13. Scroll down to the bottom of the panel to find the Summary of Residential Affordability. Click and drag the title of the metric to move it up to the top of the dashboard.

14. Click the Edit Dashboard button once again to close the edit session.
15. The Residential Affordability metric should now be shown at the top of your dashboard.
Click the number on the metric to see the details like the description you might have added along with the inputs. The metric itself is also visualized on the model highlighting the space use types within the plan that contribute to the selected metric.
16. In the Dashboard view click the Edit Dashboard button and then the settings icon to chose a new chart type.

17. For this metric select a Vertical Bar Chart and click OK.

18. Press the Edit Dashboard button again to close the editing mode and then click the number of your metric to open the detail again.
You will see that the Vertical Bar Chart now shows up in the Dashboard and in the details of the metric.
19. Click the X button in the top right of the metric details card to return to the dashboard view.

You have now created two new metrics (market rate units and affordable units) and then summed them within a third metric to create a dashboard that visualizes a detailed breakdown of the units present in the default Households metrics. Your scenario is currently private, but when you are ready, you can also share it with stakeholders. The scenario can be exported to a web scene for use within StoryMaps or Hub websites and shared with the broader community alongside narratives that support your decisions.
Conduct a shadow analysis
Shadow regulations are common across major cities which seek to limit the amount of shadows that can fall across a park or nearby buildings through the day. Proposed towers can also accidentally cast a shadow where you might not expect it and by prioritizing sunny areas for outdoor activities, you can ensure the design works for everyone. Therefore, alongside other interactive analysis tools, ArcGIS Urban enables you to assess shadow impact across your scenarios.
1. To analyze the shadow caused by your scenario, mouse over the analysis button in the bottom right of the viewport. Then choose Shadow duration.

This will launch the shadow analysis and default to coloring the shadow threshold for areas in greater than two hours of shadow. Depending on when you launch the tool, it will choose your local date and time.
2. You can pick a date by using the drop down, select December 21st or around the winter equinox to display the day with the most shadow of the year.
3. Then adjust the threshold value to 4 hours in order to identify areas that will have the greatest impact from the new development.
The threshold value is defined in hours. Setting the default value to 4 hours means that only the areas in your scene that are covered by shadow for more than 4 hours are displayed.

4. You can also choose from two additional visualization modes; Total shadow duration which depicts the accumulated shadows over a period of time or Discrete shadows to better identify the individual time intervals.

In this tutorial, you’ve created a new plan for Mission Bay by adding a basemap and parcels then you created new proposed buildings. You authored a zoning district, then edited the underlying setback parameters. Finally, you analyzed the impact of your proposed development by creating new metrics for affordable and market rate units in addition to visualizing a summary of residential affordability within the dashboard.
Learn more about ArcGIS Urban by visiting the product page and exploring more content in the Learn ArcGIS gallery.


Article Discussion: