One of the most exciting and powerful features provided to electric customers by the ArcGIS Utility Network is the ability to manage, validate, and analyze their electrical network as one continuous system, from generation sources through transmission lines, down to their distribution circuits. This article will show you how to use the model provided in the Electric Utility Network Foundation solution to model your complete electric GIS. If you’re interested in more content like this, I recommend you check out the Learn ArcGIS Utility Network for Electric learning series. You can also try these hands-on tutorials related to this article:
- Create and Manage Subnetworks
- Edit and Validate Subnetworks
- Perform Quality Assurance on Subnetworks
Because the tools and processes used to manage this GIS information are new, we have put together a series of blog posts to introduce you to the language and tools used when working with the utility network to create, manage, and perform quality assurance on the correctness of your electric systems.
What is a Subnetwork
Before we go too much further, we need to discuss the concept of a subnetwork in the utility network. Most networks can be broken down into different areas based on the equipment that is supplying or regulating service. Each of these areas is referred to as a subnetwork, and any feature that manages a subnetwork is called a subnetwork controller. We use these general terms because the utility network is used to model many types of networks and each network has its own definitions for the different types of subnetworks it manages. Each type of resource managed by a utility network is called a domain; the definitions for each type of subnetwork managed by each domain are called tiers.
Most traces in the utility network rely on the subnetworks you’ve created to perform their analysis. These subnetwork traces depend on this information because the system needs to know where the source (or sources) for a subnetwork is to perform upstream, downstream, isolation, and of course subnetwork and subnetwork controller tracing. Once you’ve defined subnetworks you also unlock additional capabilities such as the ability to create and manage system diagrams for your subnetworks and generate an aggregated subnetwork line to represent the subnetwork and summarize important information about it. You can even have the system maintain a field that shows you which subnetworks a feature belongs to or supports.
To learn more about the capabilities and workflows associated with creating and managing subnetworks refer to the Subnetworks topic in the online help.
With those definitions out of the way let’s look at the tiers associated with the electric domain in a utility network. The tiers associated with this model are Transmission, Subtransmission, Distribution, and Secondary.
The following diagram shows how the electric tiers are organized, with the higher voltage tiers on the left and lower voltage tiers on the right.
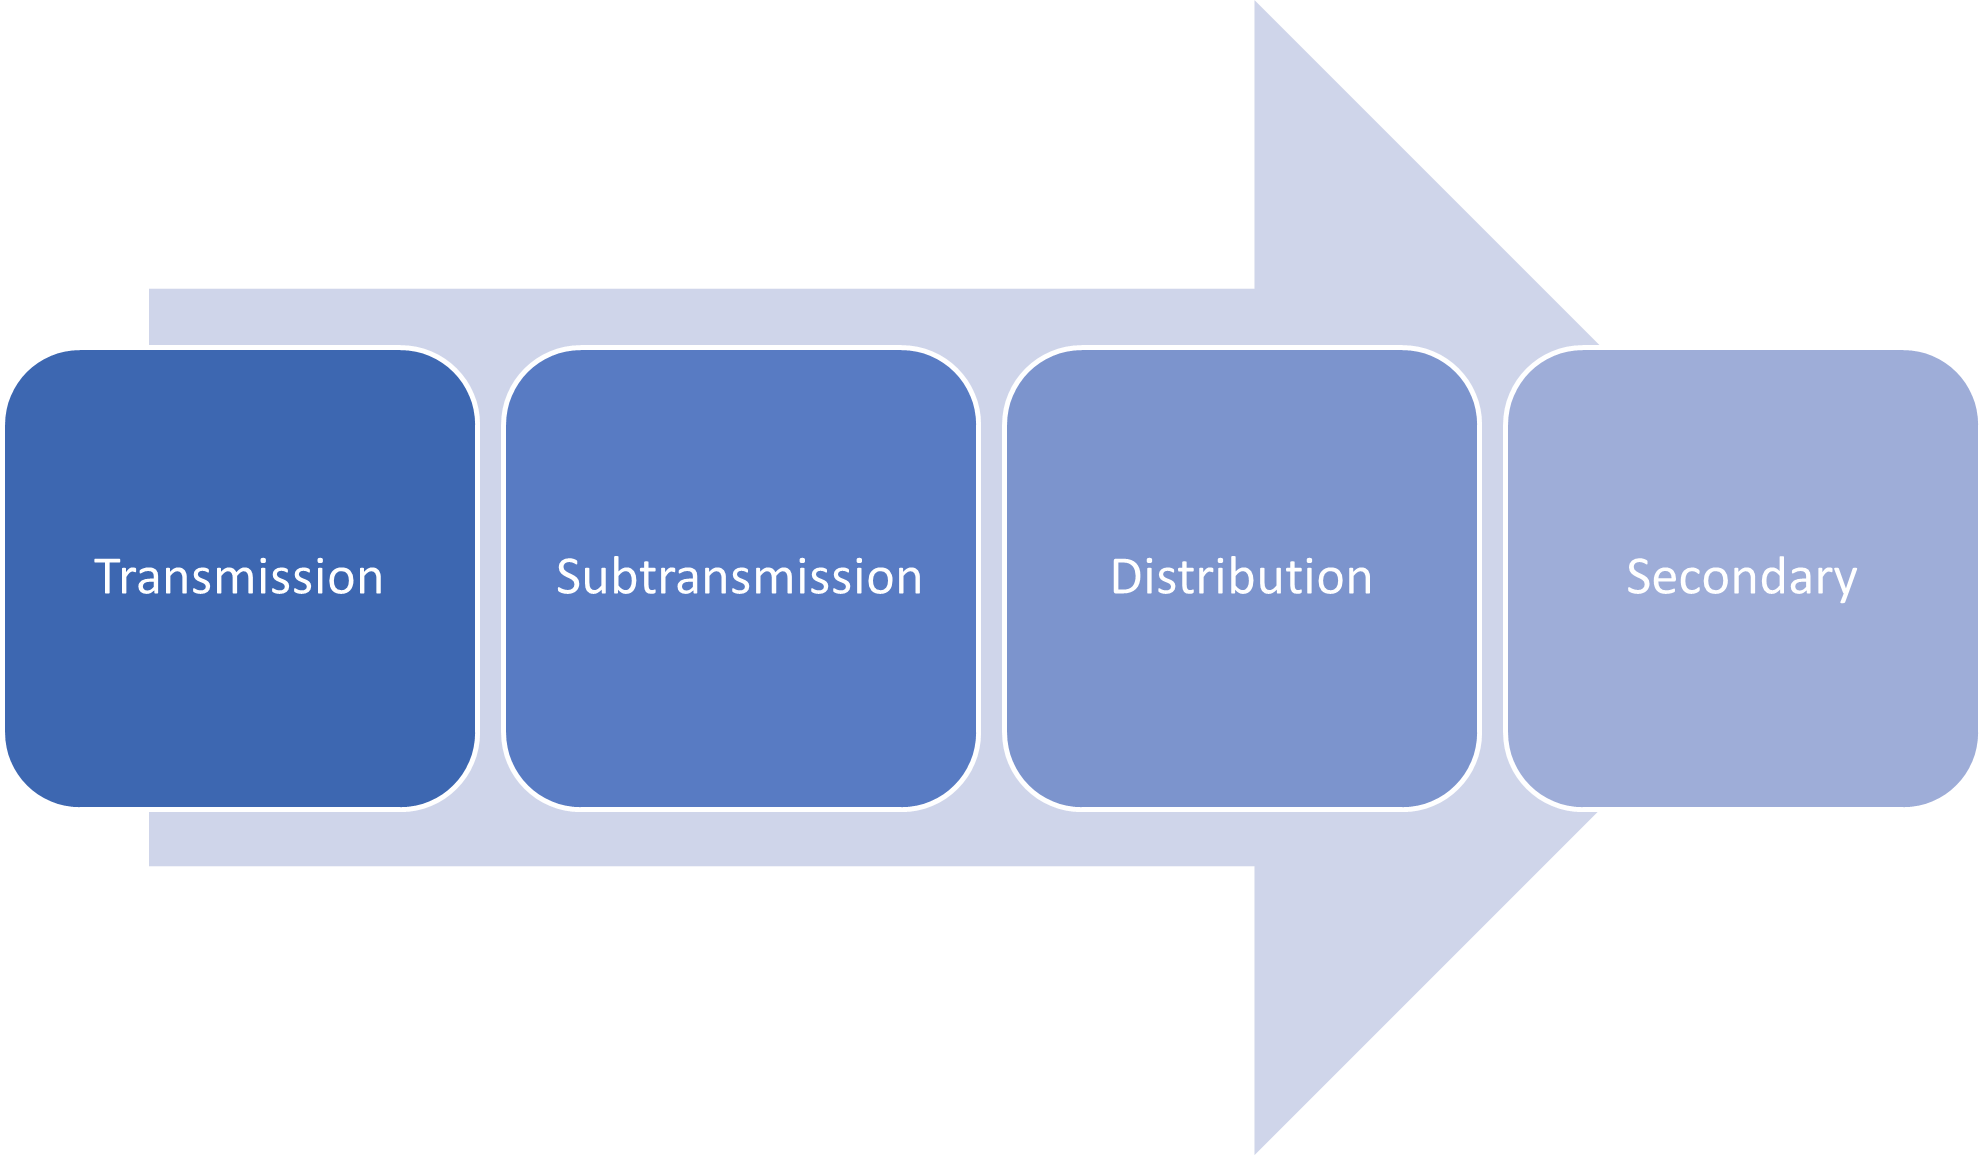
For those of you who aren’t familiar with how electric models are constructed, here is a brief definition of what each of these tiers do:
- Transmission – This tier represents the high voltage infrastructure used to move power from the locations where it is generated to the areas where it is distributed to customers. Each subnetwork starts at a location where power either enters the system or where power is transformed between different voltage levels.
- Subtransmission – The subtransmission tier is a bit harder to define because it means different things to different groups. Subtransmission is high enough voltage that it can efficiently move power over hundreds of miles but is low enough voltage that it can be managed and used to provide service to customers using distribution equipment with a high enough rating.
- Distribution – This tier contains the medium voltage equipment that is responsible for delivering power to most customers. It begins at the substation, where high voltage power is transformed into medium voltage power, each substation then has one or more circuits that are used to distribute the power to the customers in the surrounding area.
- Note: Some models include low-voltage equipment in the distribution tier, while others will explicitly model their low-voltage equipment using a separate tier.
- Secondary – This tier contains the low-voltage lines and equipment that are used to provide power to most residential and commercial customers.
- Note: While it is possible to model all secondary data using subnetworks, most utilities will typically only create subnetworks when their secondary networks are large and complex as with a secondary mesh network, due to the overhead of naming and managing the additional circuits.
Now that you are familiar with the purpose of each tier, let’s walk through a few examples of how to create subnetwork controllers in a sample dataset so we have a fully connected electrical system that spans all the way from the transmission to the secondary.
Creating a Subnetwork Controller
First, let’s talk about how to create a subnetwork controller. To create a subnetwork controller, you need at least six pieces of information
- Tier Name – This is the tier to which the new subnetwork belongs.
- Terminal – This is the terminal on the device that the subnetwork will originate from.
- Note: Because the electric model is source-based, you will typically use the downstream terminal on the device. The exceptions to this are described below.
- Subnetwork Controller – This is the device that will act as the source for the subnetwork.
- Subnetwork Controller Name – This is a unique identifier for the device.
- Subnetwork Name – This is the name of the subnetwork it controls. If a subnetwork has multiple controllers, then they should all have the same subnetwork name, but different subnetwork controller names.
- Line(s) – The line(s) connected to the terminal on the device associated with this subnetwork.
Even if you’re not familiar with the utility network model, you should be able to quickly identify these pieces of information, with the exception of the terminal. Every subnetwork controller is required to have at least two terminals, one of which is considered to be upstream. The terminals on a subnetwork controller allow the system to identify upstream/downstream flow and in turn ensures that the subnetwork flows in the correct direction.
Once you’ve identified these six items, you’ll want to look at the objects connected to each of your controllers and figure out which terminal on the device they are connected to. This is a straightforward process for things like circuit breakers and transformers, but it may be more difficult in areas where equipment is owned and maintained by one utility and operated by a different utility.
Topology Errors
The first thing we need to check before we create this system is to make sure that the topology for the system is valid. You can still create a subnetwork if you have errors in your data, but you won’t be able to trace or update it until all the errors in the system have been resolved. For this reason, I recommend utilities adopt a zero-tolerance policy for dirty areas and errors in their database! The quickest way to check the number of errors in your utility network is to right-click the utility network layer in your map, select properties, then look at your network properties.
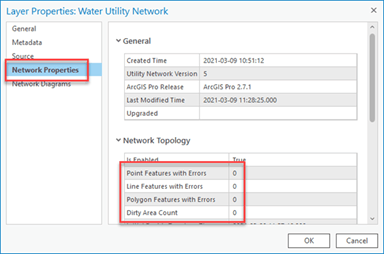
If you see zero errors and zero dirty areas, then you’re in a perfect place to start creating subnetworks! If you have errors in your topology, then you’ll need to review and resolve them. If you have dirty areas, but no errors, then you need to use the validate topology tool to resolve those outstanding issues. Check out my previous blog post for a guide to resolving the most common topology errors for electric networks for a refresher on how to do this.
Once we have validated all our dirty areas and resolved all errors, we’re ready to start creating subnetworks!
Creating Transmission Subnetworks
Transmission companies have typically not used GIS to model their connectivity and are often the most curious about how and what to model with subnetworks. The most common types of transmission subnetworks modeled in the utility network are generation sources, voltage systems, and transmission lines. In this section we will be looking at how a generation plant and a transmission station are connected in the Electric Utility Network Foundation sample data.
Generation Source
The first subnetworks we want to configure are the ones for hydro generation in our centralized generation station in the south. The output of these generators provides power to the transmission substation to the north.
| Property | Subnetwork Controllers |
| Tier Name | Transmission |
| Terminal | CBD: Line Side |
| Subnetwork Controller | HV-GEN-23
HV-GEN-24 |
| Subnetwork Controller Name | HV-GEN-23
HV-GEN-24 |
| Subnetwork Name | Rock River Generation |
| Line(s) | The high voltage line between the centralized generation station and the transmission substation should be connected to the line side terminal on the generation device. |
Once we create these subnetwork controllers, we can then trace the subnetwork (shown in yellow below) and see that it is providing power to the high-voltage power transformers in the transmission substation.
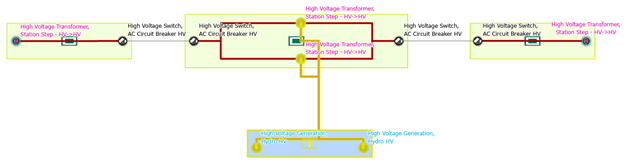
Why does the trace stop at the power transformers and not continue to the rest of the substation? This is because we’ve configured these power transformers to be subnetwork controllers for the 115 kV system, which we discuss below.
Voltage System
For our voltage system, we will use the same example as above. We can see there is a 115 kV system powered by 4 transformers. Two of them are connected to our generation station, and the other two are supplied power from higher voltage systems. The table below shows the subnetwork controllers we created for this system.
| Property | Subnetwork Controllers |
| Tier Name | Subtransmission |
| Terminal | 2wXFR:Secondary |
| Subnetwork Controller | Power Transformer 1 in Western Station
Power Transformer 1 in Northern Station Power Transformer 2 in Northern Station Power Transformer 1 in Eastern Station |
| Subnetwork Controller Name | HV-XFR-191
HV-XFR-79 HV-XFR-80 HV-XFR-241 |
| Subnetwork Name | 115 kV |
| Line(s) | The high voltage lines internal to the station should be connected to the secondary terminal of each transformer. |
In the graphic below you can see the 115 kV system traced in yellow.
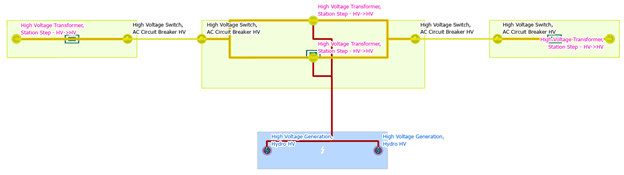
Using this configuration, we can trace downstream from our generation into our 115 kV system, as well as trace from our 115 kV subtransmission system into our transmission system to identify all upstream generation as well as any interconnects.
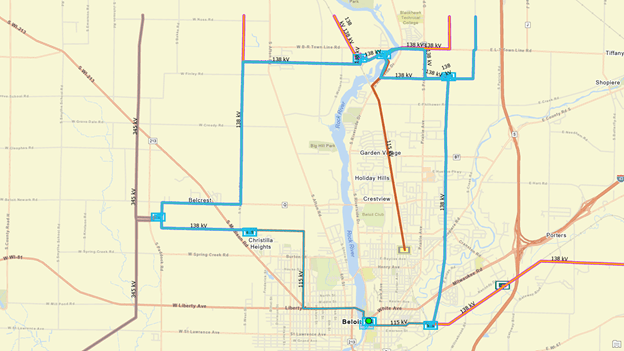
Transmission Line
In the previous examples, we demonstrated how the utility network can be used to model the voltages of a transmission system (and this is the way that we recommend you model your transmission systems); however, many transmission utilities have historically focused on modeling their transmission system using transmission lines. Consider the following example where we have two transmission lines that connect three substations.
Because Esri recommends creating and managing your transmission data using voltage systems, we recommend that you make use of the Batch Trace tools created as part of the Utility Data Management Support Tools by the ArcGIS Solutions teams. You can learn more about this tool by visiting the following GitHub IO page.
The rest of this section only applies to customers who wish to not use a voltage system model, and instead want to model their transmission lines as transmission subnetworks.
To create these transmission subnetworks, we make the circuit breakers at either end of each transmission line a subnetwork controller. By doing this you will break any voltage systems you have defined because each transmission line is modeled as being downstream of each circuit breaker. The voltage system traces will then stop at the circuit breakers because the downstream trace from the power transformer cannot trace upstream through a circuit breaker. The result of this is that your network data will only be traceable on transmission lines, and much of your substation internals will appear de-energized.
I have included the definitions for each subnetwork below. The first transmission line is the 138 kV line between the Dielh Rd, Willow Lake, and Naperville substations.
| Property | Subnetwork Controllers |
| Tier Name | Transmission |
| Terminal | CBD:Line |
| Subnetwork Controller | Circuit Breaker in Diehl Rd Station
Circuit Breaker in Willow Lake Station Circuit Breaker in Naperville Substation |
| Subnetwork Controller Name | HV-SW-241
HV-SW-749 HV-SW-879 |
| Subnetwork Name | Diehl-Willow-Naperville 1 |
| Line(s) | The high voltage conductors on the line side of the breakers.
When the breaker has busbar on both sides, visually determine the line side of the breaker. |
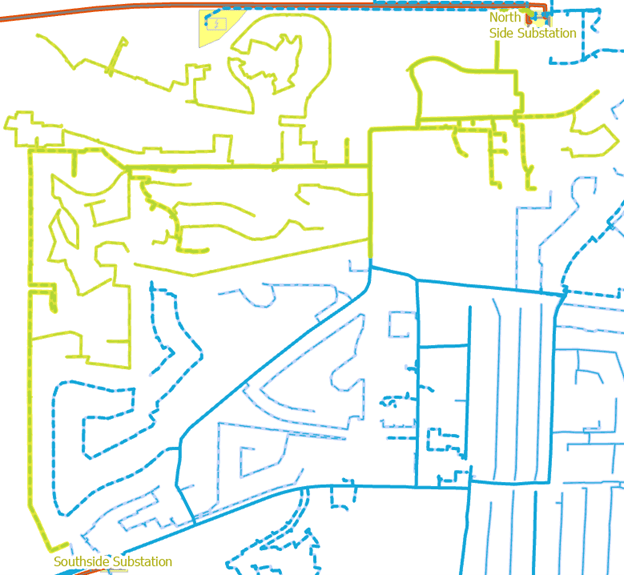
The second transmission line is the 115 kV line between the Naperville and Southside Substation
| Property | Subnetwork Controllers |
| Tier Name | Transmission |
| Terminal | CBD:Line |
| Subnetwork Controller | Circuit Breaker in Naperville Substation
Circuit Breaker in Southside Substation |
| Subnetwork Controller Name | HV-SW-1024
HV-SW-1067 |
| Subnetwork Name | Naperville-Southside 1 |
| Line(s) | The high voltage conductors on the line side of the breakers.
When the breaker has busbar on both sides, visually determine the line side of the breaker. |
After creating these subnetwork controllers, we can then trace these subnetworks to see the extents of our transmission lines, highlighted in yellow below.
Now that we’ve stepped through how to model transmission let’s look at how to model several types of distribution subnetworks.
Creating Distribution Subnetworks
Electric distribution companies have historically only used GIS to model their medium voltage circuits. Because of the investments they’ve made in distributed resources and grid modernization there has been an increased need to begin modelling the internals of substations to support grid analytics and advanced engineering analysis models. In this section we’re going to be looking at the subnetworks associated with the Naperville and Southside substations in the Electric Utility Network Foundation.
Creating a Radial Distribution Circuit
We’re going to start with creating the distribution circuits in each of these substations that are responsible for service in our area of interest.
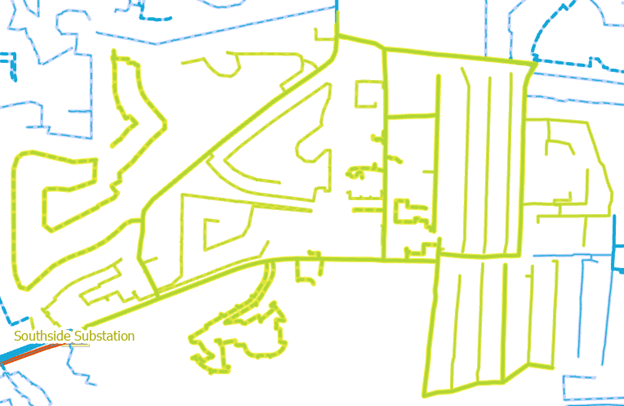
In the Southside substation we will create a subnetwork in the eastern most bay called RMT001 with the following properties:
| Property | Subnetwork Controllers |
| Tier Name | Distirbution |
| Terminal | CBD:Line Side |
| Subnetwork Controller | Circuit Breaker in Bay 5 of Southside Substation |
| Subnetwork Controller Name | MV-CB-16 |
| Subnetwork Name | RMT001 |
| Line(s) | The medium voltage connector between the circuit breaker and the station disconnect switch at the edge of the substation. |
You can see the layout for this substation below:
After creating the subnetwork controller, we then validate the controller and run update subnetwork to ensure we’ve connected everything properly. We can then confirm the extent of our subnetwork by tracing it.
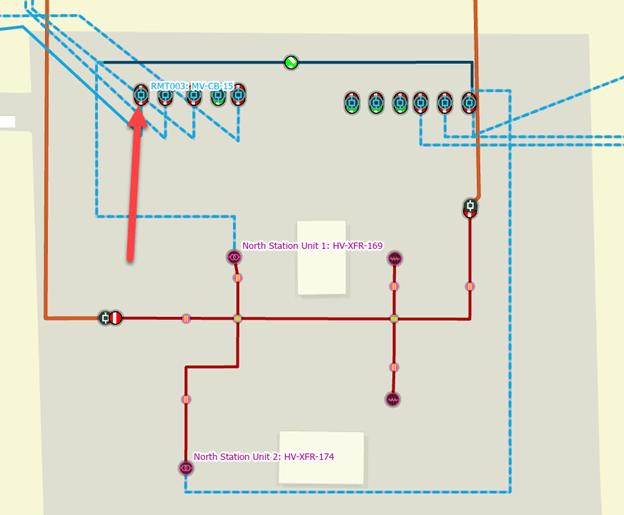
Next, we will create a subnetwork controller for the western-most circuit breaker in the northwestern bay of the Naperville substation.
| Property | Subnetwork Controllers |
| Tier Name | Distirbution |
| Terminal | CBD:Line Side |
| Subnetwork Controller | Circuit Breaker in Bay 6 of Naperville Substation |
| Subnetwork Controller Name | MV-CB-15 |
| Subnetwork Name | RMT003 |
| Line(s) | The medium voltage connector between the circuit breaker and the station disconnect switch at the edge of the substation. |
You can see the layout for the substation below, with the relevant circuit breaker called out in the northwestern bay.
Once again, we validate the controller and run update subnetwork to ensure we’ve connected everything properly. We can then confirm the extent of our subnetwork by tracing it.
Now that we’ve created our distribution circuits, let’s look at how to model the substation so we can include it in our analysis.
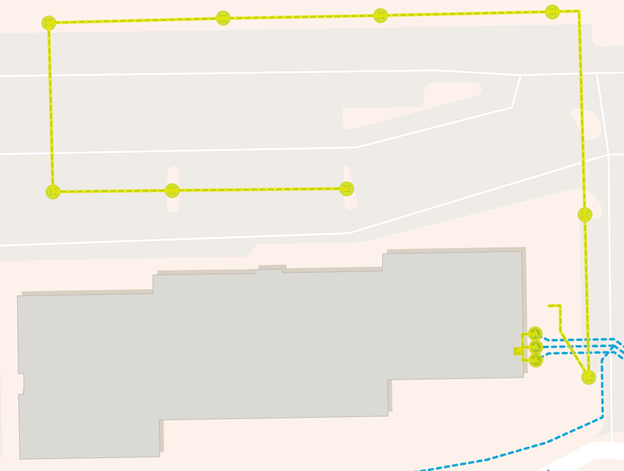
Creating a Distribution Station
The design and construction of distribution stations can vary quite a bit. At a minimum, they should consist of a power transformer that steps down transmission voltage to distribution voltage and have one or more protective devices that act as circuit sources. How much additional detail you model in the substation will depend on how much data you have available and are willing to maintain in the GIS. From a network modeling perspective, what’s important is that we create a subnetwork for each power transformer in the station that models all the busbar, switching, protective, and voltage regulation equipment.
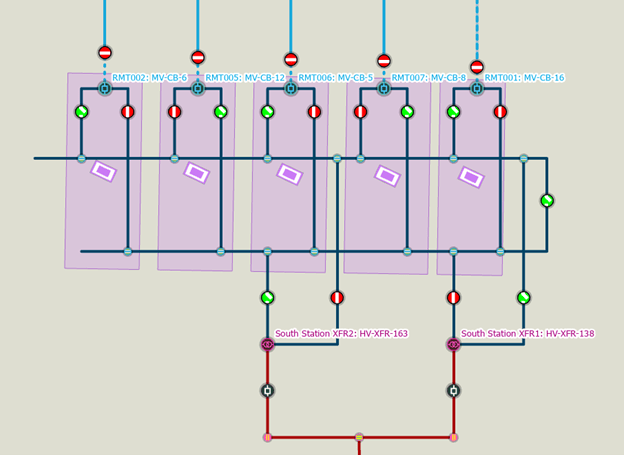
The following image shows the key features of the Southside substation.
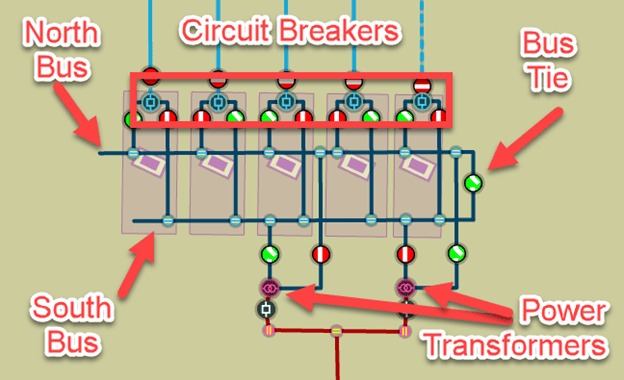
For the Southside station we can see that we have two power transformers. Because each of these transformers operate independently from each other we will create them as separate subnetworks. Let’s start with the transformer on the right.
| Property | Subnetwork Controllers |
| Tier Name | Distribution |
| Terminal | 2wXFR:Secondary |
| Subnetwork Controller | Power Transformer for the northern bus of the Southside Substation |
| Subnetwork Controller Name | HV-XFR-138 |
| Subnetwork Name | South Station XFR1 |
| Line(s) | The medium voltage busbar that connects the transformer to the north and south bus of the substation. |
We can see that this transformer is now providing power to the southern bus of the substation along with three of the five circuit breakers in this station. We can also see that this transformer handles providing power to the RMT001 circuit we created in the previous section.
Next, we’ll create the subnetwork controller for the other transformer.
| Property | Subnetwork Controllers |
| Tier Name | Distribution |
| Terminal | 2wXFR:Secondary |
| Subnetwork Controller | Power Transformer for the northern bus of the Southside Substation |
| Subnetwork Controller Name | HV-XFR-163 |
| Subnetwork Name | South Station XFR2 |
| Line(s) | The medium voltage busbar that connects the transformer to the north and south bus of the substation. |
We can see that this transformer is now providing power to the northern bus of the substation along with two of the five circuit breakers in this station.
Now that we’ve created power transformers that connect to our circuit breakers, we can run traces from our power transformers into the distribution circuits themselves. You can see an example of this trace below.
Creating Secondary Subnetworks
While all electrical distribution systems have low-voltage lines, only some model them as separate low-voltage circuits. Typically, low-voltage networks are only modeled as separate circuits when they are serving many customers and are relatively static. It is possible to create low-voltage circuits for smaller, irregular areas but the overhead of creating and maintaining unique names outweighs the benefits. There are other, more scalable solutions to managing these dynamic systems. The following examples will show examples from the Naperville dataset for the three most common types of low-voltage networks: a spot network, a low-voltage radial network, and a low-voltage mesh network.
Spot Network
A spot network is a location where two or more transformers from different circuits are connected on the low side to a single site. They often serve large commercial buildings, hospitals, or other important infrastructure because they provide power from multiple sources and are therefore more reliable.
In the example below we have two buildings on a campus that require this extra reliability. Each of these buildings has a dedicated set of three transformers, with each transformer served from a different circuit.
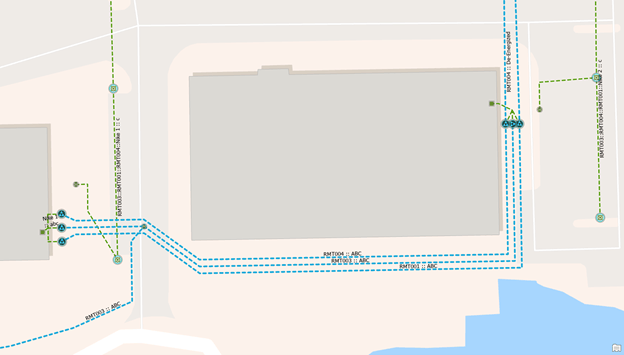
You can see the definition for each of the subnetwork controllers for the first spot network below:
| Property | Subnetwork Controllers |
| Tier Name | Secondary |
| Terminal | 2wXFR:Secondary |
| Subnetwork Controller | Medium Voltage Pad Mounted Transformers |
| Subnetwork Controller Name | MV-XFR-X, MV-XFR-Y, MV-XFR-Z |
| Subnetwork Name | Nike 1 |
| Line(s) | The low-voltage conductor connected to the secondary side of the pad mounted transformer. |
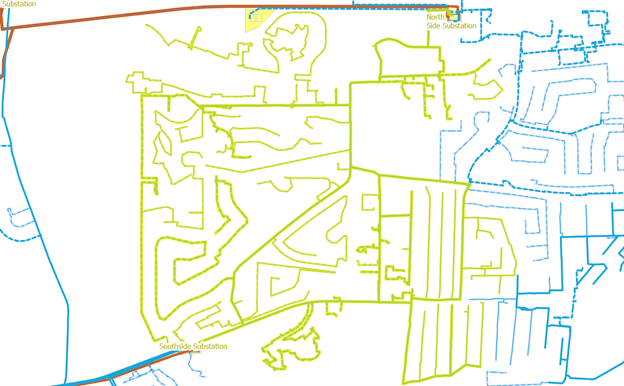
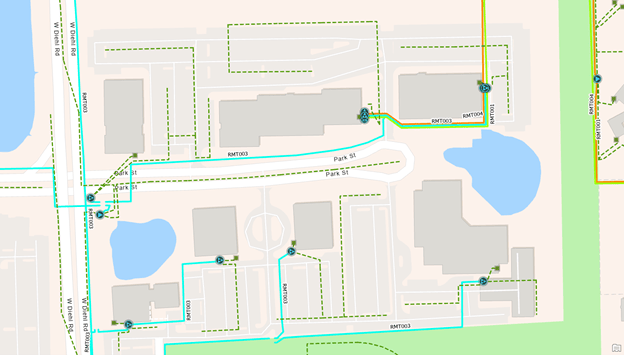
After creating, validating, and updating this new subnetwork we can trace it to confirm that it is providing power to the building, as well as the streetlights in the adjacent parking lot.
If we symbolize the lines in the area using their subnetwork name, we can get a better appreciation for how the connections at these buildings differ from the other buildings on this campus.
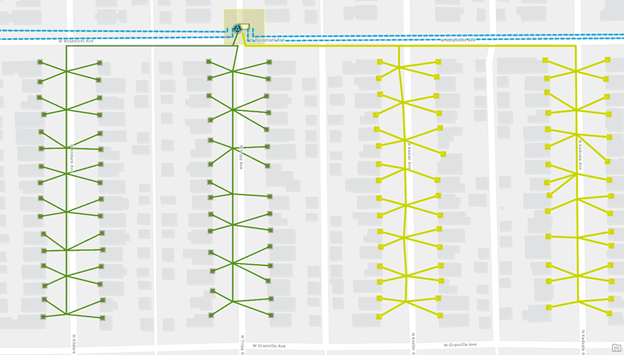
Low-Voltage Radial Network
Low-voltage radial networks are most often found where a single, large distribution transformer is responsible for providing power to one or more low-voltage circuits for an area. You can find an example of this below with the Sauganash low-voltage networks. This neighborhood has a large distribution transformer with several low-voltage circuit breakers that you can see below:
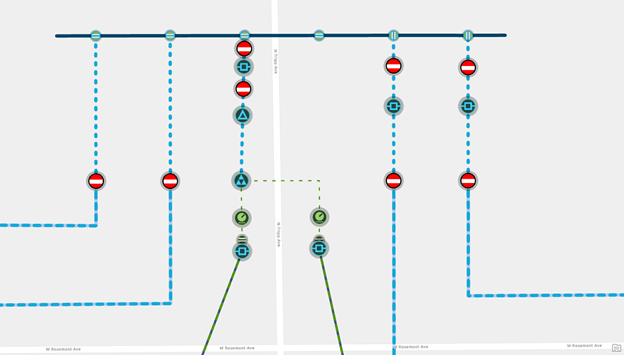
Each of these low-voltage circuit breakers is associated with its own subnetwork. You can see the definition for the first circuit breaker below:
| Property | Subnetwork Controllers |
| Tier Name | Secondary |
| Terminal | CBD:Line Side |
| Subnetwork Controller | Low-Voltage Circuit Breaker |
| Subnetwork Controller Name | LV-CB-1 |
| Subnetwork Name | Sauganash 1 |
| Line(s) | The low-voltage conductor connected to the line side of the low-voltage circuit breaker. |
Because each of these networks is separate, we need to create a second controller for the second low-voltage circuit breaker.
| Property | Subnetwork Controllers |
| Tier Name | Secondary |
| Terminal | CBD:Line Side |
| Subnetwork Controller | Low-Voltage Circuit Breaker |
| Subnetwork Controller Name | LV-CB-2 |
| Subnetwork Name | Sauganash 2 |
| Line(s) | The low-voltage conductor connected to the line side of the low-voltage circuit breaker. |
Once everything has been connected and validated you can see the features associated with each subnetwork below.
Low-Voltage Mesh Network
Low-voltage mesh networks are used to provide highly resilient and reliable service to a dense urban area by creating large low-voltage grids. Each of these grids is fed by dozens of transformers, and these transformers are in turn fed by many different circuits. Because these systems are expensive to design and maintain they are relatively uncommon. Typically, these are found in cities with large commercial districts where the potential loss of power justifies the investment in resiliency.
We will review a smaller example below where we have created a low-voltage mesh network to provide power to a small neighborhood. This neighborhood is powered by four transformers that are all connected to form a single network.
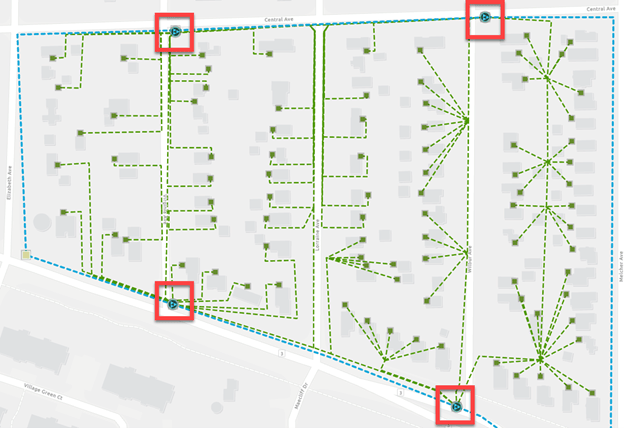
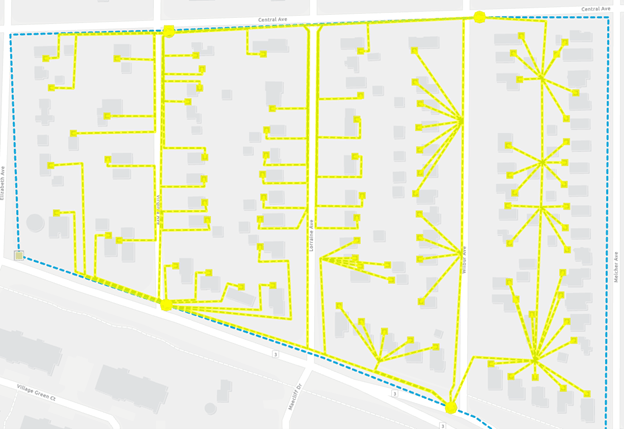
Below you can find the definitions of each subnetwork controller in this subnetwork:
| Property | Subnetwork Controllers |
| Tier Name | Secondary |
| Terminal | 2wXFR:Secondary |
| Subnetwork Controller | Network Transformers |
| Subnetwork Controller Name | MV-XFR-1204, MV-XFR-1205, MV-XFR-1206, MV-XFR-1207 |
| Subnetwork Name | Warrenville Mesh |
| Line(s) | The low-voltage conductor connected to the secondary winding on each transformer. |
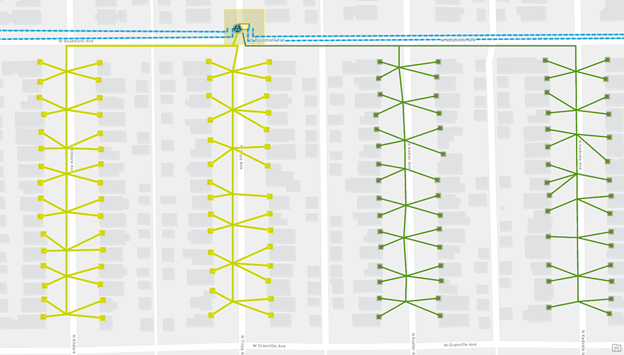
Once all the controllers have been created and validated, we can trace the network and see that all the services in this area are being fed by all four transformers simultaneously.
Conclusion
You should now have a better understanding of what subnetworks are and how to use the Electric Utility Network Foundation to create and manage the diverse types of subnetworks found in electrical utilities. In our next blog, we will discuss the process for validating subnetworks, along with how to resolve the most common types of validation errors you’re likely to encounter in your data.
If you’re interested in more content like this, I recommend you check out the Learn ArcGIS Utility Network for Electric and Learn ArcGIS Utility Network for Sewer and Stormwater learning series. You can also try these hands-on tutorials related to this article:
- Create and Manage Subnetworks
- Edit and Validate Subnetworks
- Perform Quality Assurance on Subnetworks


Article Discussion: