Driving throughout the city, parks, and downtown, I cannot ignore the fact that the number of individuals struggling with homelessness continues to increase. Feeling sympathetic, I begin to wonder how these individuals got here. Did they receive available assistance to try to prevent this outcome? Were there obstacles or delays in support that pushed them to such dire circumstances? What could their communities have done to prevent this?
What many may not acknowledge is that to effectively prevent and decrease the number of individuals experiencing homelessness, the effort must start with data-driven decisions. The foundational data with which to begin comes from the annual Point-in-Time (PIT) Count, a Department of Housing and Urban Development (HUD) requirement for a census of sheltered and unsheltered people experiencing homelessness, usually performed on one or a few nights in January. This count provides insight into demographic and location trends among the homelessness population, as well as health, social supports, homeless history, and attitudes and experiences with resources. Many are still using a paper-based processes for conducting the PIT count which can be time consuming. Furthermore, filtering through volunteers’ handwritten notes can lead to recording errors as paper-based surveys are copied into Excel spreadsheets for analysis and reporting. The result may be an incomplete and inaccurate picture of a community’s homelessness crisis.
Several leading government agencies have turned to geographic information system (GIS) technology to conduct the PIT count and leverage the near real-time results to understand the extent of the homelessness crisis, see which communities are being impacted the most, analyze causes and contributing factors, and allocate resources to areas with the most need. Esri’s complimentary ArcGIS Homelessness Point-in-Time Counts solution a collection of tools and capabilities to conduct the PIT count, makes it easy for governments to conduct their counts by:
- Modernizing the PIT count process
- Enhancing PIT count data visualization
- Generating reports for HUD in seconds
Modernizing the PIT count process
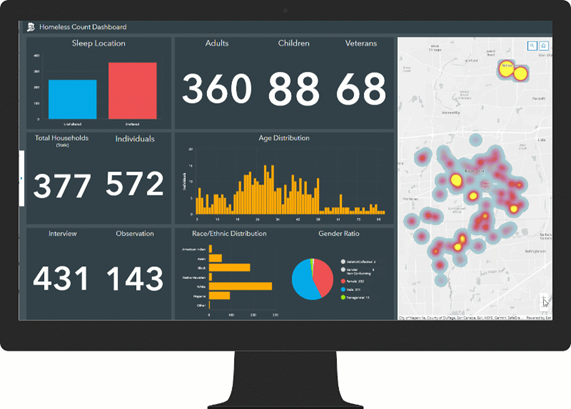
Conducting the PIT counts is already a time consuming and resource intensive process. Most communities rely on volunteers to help canvas an area and perform the surveys. Usually, volunteers are sent out with paper-based surveys that need to be legible, tracked to avoid loss, and protected in inclement weather. Completed surveys are then uploaded into a central data platform, such as an Excel spreadsheet, to create the required HUD report which can take days to weeks after the count has been conducted. By leveraging the Homelessness Count Survey included in the solution, all volunteers can interview individuals experiencing homelessness using their mobile devices. All collected data automatically uploads to the Homelessness Count Dashboard, so the health organization does not need to do this manually. When volunteers are working in a connected environment, that data upload is instantaneous as each survey is submitted. If the volunteers are working in an unconnected environment, the data upload will occur when they return to a connected location.

Enhancing PIT count data visualization
Many of us love to get our hands on raw data, exploring and interrogating it for key insights. But decision-makers need results. Data visualizations that show key indicators and impacted areas quickly and clearly are the answer. With the Homelessness Count Dashboard health organizations can visualize the PIT count survey results in real-time, ensuring first that all areas in their communities are canvassed. Then this data can be leveraged after the count to make data-driven decisions. The dashboard is interactive and allows users to select values such as gender or age to refine and target resource allocation and program funding to different areas within their communities.
Generating reports for HUD in seconds
HUD has specific requirements that communities must follow when submitting their PIT Count report. With this ArcGIS solution, health departments can generate reports meeting the HUD requirements with the HUD Report Notebook. This reduces the time organizations may have to spend on cleaning up their survey results, allowing them to instead focus on leveraging this data to enhance social services, reallocate resources, and implement additional homelessness prevention modules.
The PIT count could be seen merely as a time-consuming federal requirement, however by leveraging GIS technology, health organizations can reduce the time spent on conducting the actual count and generate accurate data to efficiently and effectively provide the help and resources to their communities need.