By Tyrand Fuller, Director of Strategic Initiatives; Marissa Robins, Communications/Strategic Initiatives Intern; and Tom Withers, GIS Specialist
The Suffolk County Water Authority (SCWA) is an independent public benefit corporation that has been providing high-quality drinking water to its customers since 1951. It is also one of the largest groundwater suppliers in the nation, serving approximately 1.2 million residents in Suffolk County, New York.
New Requirements, Challenging Work
The 2021 US Environmental Protection Agency (EPA) Lead and Copper Rule Revisions (LCRR) require water suppliers to provide a complete inventory of service lines, including the material type of the privately owned portion and the utility-owned portion. This inventory must be completed by October 2024. Water suppliers are also required to develop plans to replace any existing lead service lines. Without an accurate and up-to-date inventory, it would be impossible to comply with the LCRR.
In response to the LCRR, the SCWA has taken it upon itself to ensure that customers have full knowledge about their water service lines and see how the authority is continuing the goal of providing high-quality drinking water that meets and exceeds all regulations. The SCWA must maintain an accurate inventory of all lead service lines so that it can have them replaced with a safer alternative, such as copper. The SCWA decided to utilize geographic information system (GIS) technology to ensure that the corporation is meeting the requirements of the LCRR. Web-based GIS applications provide an efficient visual database of service line materials, allowing water suppliers to easily access, track, share, and update their inventory.

The SCWA relied on service line records—tap cards—to keep track of service line installations. These tap cards, known as form 31s, were originally all paper. Storing, retrieving, and updating information on customers was an arduous process that took a long time to complete. The records were not easily accessible, and there was no way to quickly update them. In 2015, the SCWA hired a firm to digitize the paper tap cards. The SCWA’s IT staff also developed an electronic process to store new digital tap cards, known as form 205s. These forms were stored in the authority’s customer information system, SAP, which serves as the SCWA’s main system of record.
Although SAP could store the tap cards and attach details to customer accounts, there were still issues determining where there were gaps in the records and quickly visualizing where information needed to be updated. This made it difficult to create a full inventory of service lines.
Web-Based GIS Makes Data Accessible
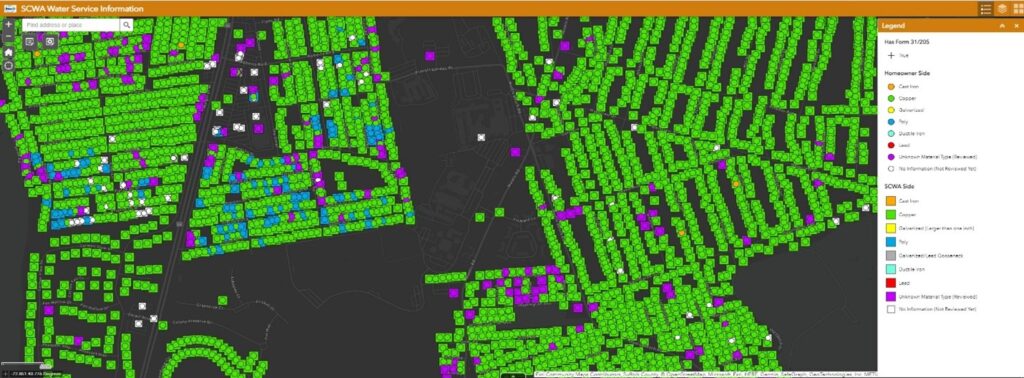
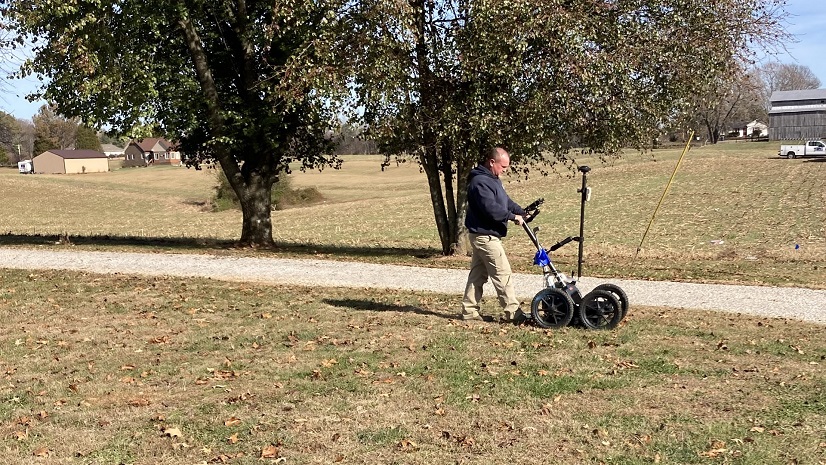
The introduction of web-based GIS applications through ArcGIS Enterprise enabled the SCWA to solve many of the problems associated with developing an accurate service line inventory. Utilizing GIS, SCWA staff created applications to visually track and edit the inventory of all service lines in the authority’s system. Staff members could update the material types of the public and private portions of the service line as well as indicate how the information was obtained, whether through public records, institutional knowledge, direct observation, or customers. Hyperlinks to downloadable PDFs of the tap cards were also added to one of the applications so that users could instantly view service line records of each home while editing within the application. The integration of the hyperlinked tap cards saved valuable time, as staff could see which homes’ information needed to be updated. The inventory is updated by field crews making observations and resolving work orders. In addition, inventory information is easily accessible to senior staff.
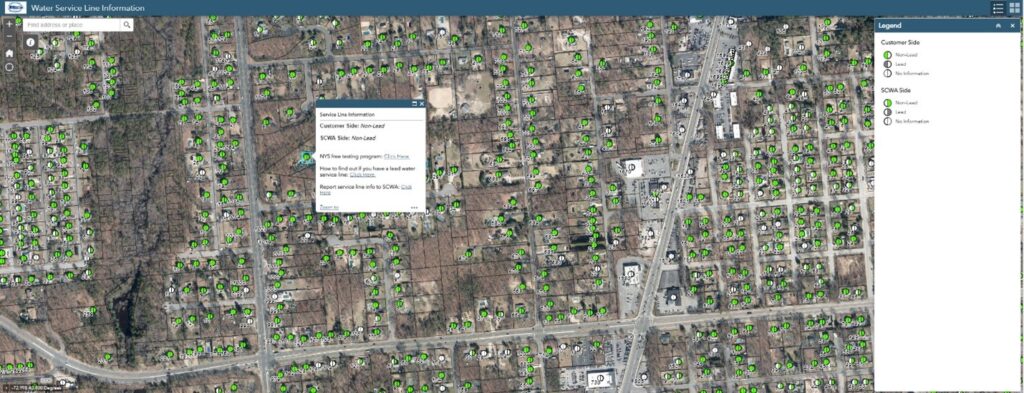
The lead service line GIS applications also enabled the SCWA to easily share information with its customers. Operations, communications, and GIS staff worked to develop a section on the SCWA website to educate customers on the EPA’s lead and copper rule revisions and provide an application that customers can use to search for their home and instantly identify whether they have a lead service line. This is done by utilizing a color-coded system and corresponding legend. The lead and copper application makes it easier for customers to have a better understanding about their homes and drinking water. The application also has a hyperlink to an ArcGIS Survey123 form that customers can use to help identify and update any missing records of service lines that may exist in their home.

We’re well on our way on our inventory and this website will help us to track progress, elicit the help of the public in identifying the type of service line they have, and [educate] the public on all aspects of the rule revision . It’s an enormous undertaking, so cooperation from the public is essential to identifying service line materials.
The Effort to Meet the LCRR Deadline
To monitor the development of the LCRR inventory, the SCWA also created a dashboard that allows staff to see real-time progress toward the October 2024 inventory deadline. Furthermore, it enables the SCWA to quickly filter through the data and identify any problems that could arise, such as incorrect data being added to service lines. The ability to quickly see the progress of the overall service line inventory, pinpoint areas where records needed to be updated, and see where lead service lines need to be replaced has enabled the SCWA to create a central point of information that can be understood at a glance. This also has enabled the SCWA to quickly respond to any inquiries or concerns that its customers may have.
The GIS lead and copper application has been a major time saver. We can easily access the scanned tap cards and update material types. At times it has also created a friendly competition among our staff to see who can get the most done in the shortest amount of time.

The valuable tools available through GIS have enabled the SCWA to quickly identify any potential problems and take the necessary steps to address them. GIS has also enabled the SCWA to easily share information with its customers and keep them informed about this important issue. Overall, the SCWA has been able to efficiently maintain its LCRR inventory and provide high-quality drinking water to its customers by utilizing GIS.
Using GIS for our lead service line inventory has been invaluable to our team. With the ability to access and update inventory data instantly, we have been able to save countless hours and maintain a more accurate and up-to-date inventory. It has improved our efficiency and ultimately enabled us to better serve our customers.
Stay Connected with Esri’s Water Team
ArcGIS is an extensive information system that enables modernization of workflows with easy-to-use applications for the field and office. Strengthen your organization with smart water solutions that will increase efficiency and provide insight for decision-makers. Visit Esri Water Utilities web site for more information.
Join the Water Utilities Community
Follow #EsriWater on social media: Twitter | LinkedIn
Subscribe to the Water Industry newsletter “Esri News for Water Utilities and Water Resources“
Learn how Esri provides mapping and analytics for Lead and Copper Rule Compliance


