Architects and urban designers are often asked to address challenges that go far beyond individual buildings. Access to jobs, mobility choices, equity, and quality of life shape how successful a place ultimately becomes. Public transit plays a central role in these outcomes, yet it has often been difficult to integrate meaningfully into early design decisions.
Recent work from Esri’s ArcGIS Business Analyst team demonstrates how this is changing. By making global transit data consistent, accessible, and spatially precise, Esri is helping the AEC industry bring mobility into the core of design thinking rather than treating it as an afterthought.
Why Transit Accessibility Belongs in Early Design
Urban form and transportation are inseparable. Transit influences where density works, how mixed-use development performs, and whether neighborhoods are truly walkable. When transit access is strong, designers see more active streets and resilient communities. When it is weak, even well-designed places can struggle to meet the needs of residents and workers.
Historically, transit data has been fragmented and difficult to apply at the scale architects and urban designers work with. As a result, transit considerations often enter the process late, after key design decisions have already been made.
A different approach begins with a simple question: what if transit accessibility could be evaluated for every building in a city? This reframing allows designers to move beyond general assumptions and understand access in a clear, location-specific way.

A Building-Level View of Transit Access
One of the most valuable outcomes of this work is the ability to assign a transit accessibility score, from 1 to 100, to individual buildings. These scores account for factors such as proximity to transit stops and frequency of service.
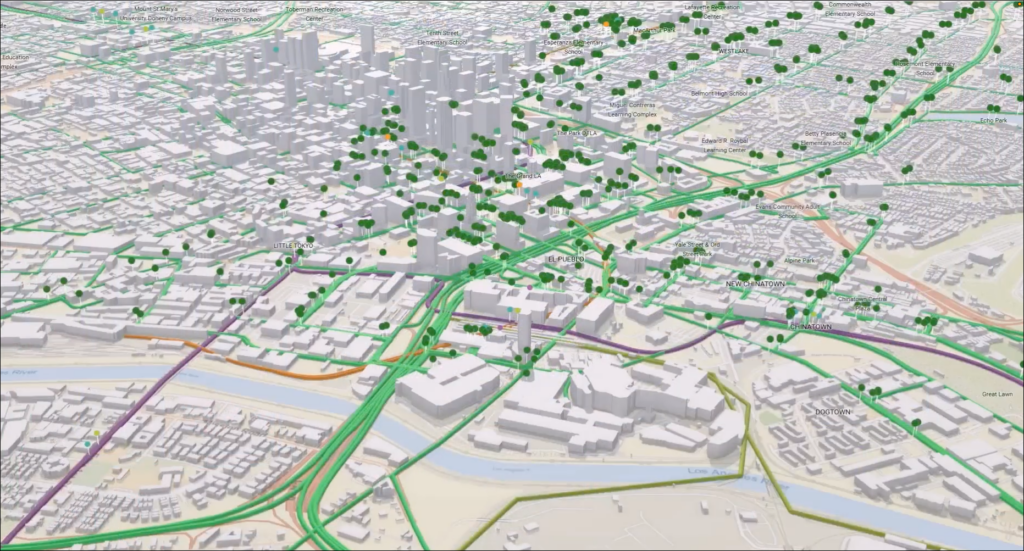
When mapped across an urban area, patterns quickly emerge. In downtown Los Angeles, for example, buildings with strong access to transit contrast sharply with nearby neighborhoods where residents face long and unreliable commutes. For designers, these visual patterns reveal where land use, density, and mobility align, and where they do not.
This level of clarity supports better decisions around site selection, building program, massing, and the placement of housing, employment, and services. It also creates a shared language for collaboration between designers, planners, and transit agencies.
Designing with Equity in Mind
Transit accessibility is not only a technical metric. It reflects real social outcomes. In many communities, trips that take minutes by car require hours on public transit, with limited evening or weekend service. These conditions shape daily life in ways that are often invisible during the design process.
For people without access to a private vehicle, including seniors, families, and residents of underserved or rural areas, long transit commutes can limit access to jobs, healthcare, and education. From an AEC perspective, this raises an important question: who can realistically use the places we design?
By bringing transit accessibility into design workflows, teams can better evaluate how projects support equitable access and whether they truly serve surrounding communities.
Global Transit Data, Ready for Design Workflows
To support this shift, Esri has released World Transit Stops and World Transit Routes through the ArcGIS Living Atlas. Built on the GTFS standard, these datasets cover most of the United States, entire countries across Europe, and growing portions of Canada, Australia, New Zealand, Mexico, and other regions.
The scale is significant, representing millions of transit stops and hundreds of thousands of routes worldwide. More importantly for the AEC industry, the data is consistent and ready to use. Designers can incorporate reliable transit context into site analysis, corridor studies, master planning, and urban design without assembling datasets from multiple sources.
This accessibility helps bridge the gap between transportation planning and design practice.
Seeing Opportunity Through Movement
When transit data is visualized alongside buildings, employment centers, and land use, cities tell a different story. Clusters of transit stops reveal areas of foot traffic and economic activity. Overlaying workforce data shows where large numbers of employees rely on transit and where gaps in service limit opportunity.
By aggregating transit accessibility scores and comparing them with employment levels, designers and planners can identify mismatches between where people work and how they get there. These insights support more informed transit-oriented development strategies, station area design, and long-term urban transformation.
For architects, this means designing with a clearer understanding of how projects fit into the daily movement patterns of a city.
Tools That Support Collaboration
ArcGIS Business Analyst complements these datasets with infographics that support rapid analysis and communication. Designers can create walksheds around transit stops and quickly understand nearby demographics, labor force characteristics, commute profiles, and local destinations.
These tools are especially valuable in collaborative environments, helping align designers, public agencies, developers, and community stakeholders around shared evidence rather than assumptions.
Designing Cities That Work Better for People
Integrating transit accessibility into design is ultimately about creating places that function well for everyday life. When designers can see how access varies block by block, they are better equipped to shape environments that support opportunity, health, and long-term resilience.
As the AEC industry continues to address urban growth, sustainability goals, and social equity, transit-informed design will play an increasingly central role. With global transit data now available and expanding, architects and urban designers have a powerful new lens for shaping connected, livable cities.
Designing around transit is no longer an aspiration. It is becoming a practical, data-driven foundation for better design.
To explore more examples of how AEC firms use GIS, visit esri.com/aec.
GIS-Powered Insights for Public Transit: download the guide.