The energy of the 2026 Special Olympics USA Games in Minneapolis was unmistakable. Across venues and gathering spaces, thousands of athletes, coaches, families, volunteers, and spectators arrived with a shared sense of purpose: to celebrate courage, inclusion, and the power of sport. But behind every race, match, ceremony, and cheer was another story unfolding quietly in the background, the story of the teams working to keep a complex, multisite event moving safely and smoothly.
That behind-the-scenes mission depended on more than good planning. It required real-time awareness, fast coordination, and a shared understanding of what was happening across venues, transportation routes, command centers, and field teams. As part of Esri’s GIS for Good initiative, senior solution engineer Colin Cate and director of emergency management solutions Carrie Speranza, CEM, helped the Special Olympics USA Games emergency and consequence management team use ArcGIS to turn location data into operational confidence.
Turning Location into Operational Awareness
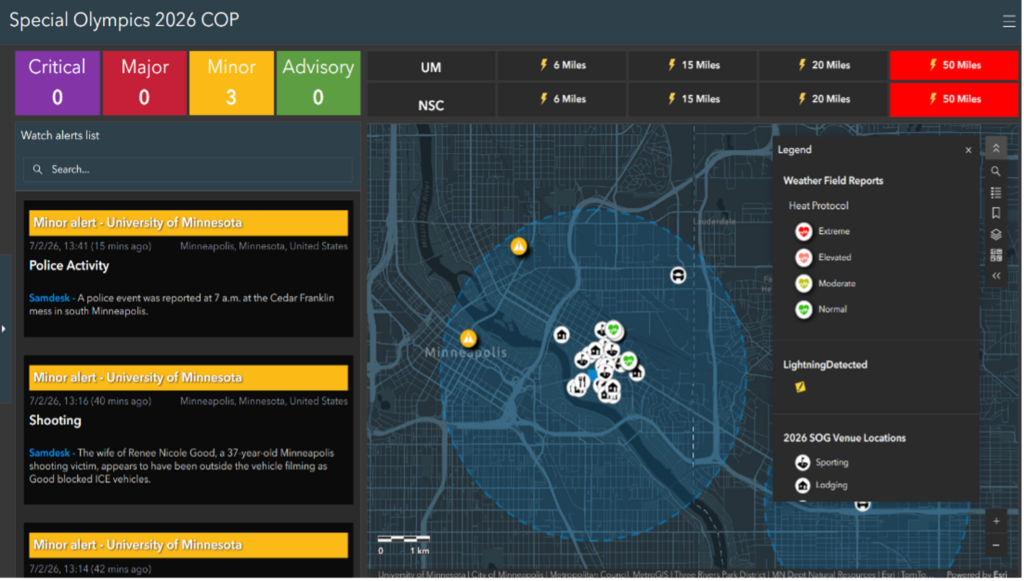
At an event of this scale, the smallest issue can quickly ripple across the operation. A weather cell near an outdoor venue, a transportation delay, or a staffing need at one site can affect decisions miles away. The emergency and consequence management team needed more than a dashboard; they needed a living common operating picture that could help decision-makers see the Games unfold as they happened.
“With nearly 3,000 athletes competing across multiple sports venues, we needed a single, real-time view of the Games. ArcGIS brought together weather, transportation, and field information so our teams could anticipate issues, coordinate across venues, and make informed decisions that kept the Games safe and running smoothly,” said Wayne Kewitsch, director of emergency operations for the 2026 Special Olympics USA Games.
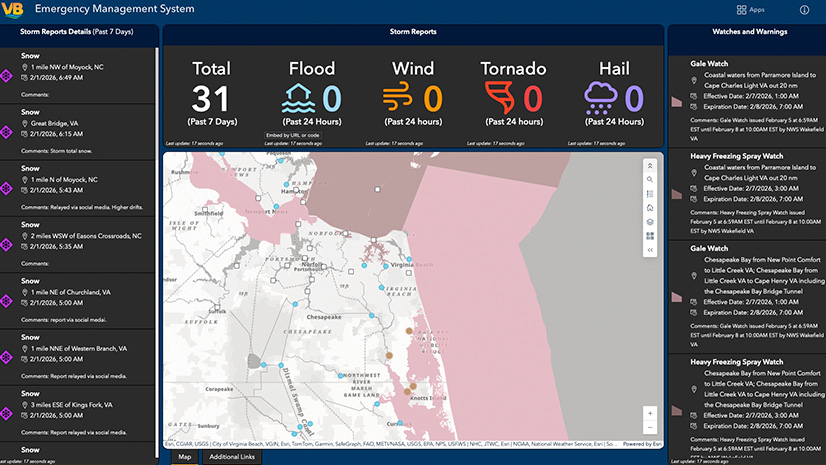
The vision was to bring critical operational information together in one place so teams could monitor venues, outdoor sites, emerging issues, and the overall tempo of Games operations. The dashboard was designed for the people closest to the action, including Special Olympics staff and Main Operations Center volunteers supporting daily operations.
Geography became the thread that connected the entire operation. ArcGIS made it possible to see people, places, infrastructure, weather, transportation, and incidents in relation to one another. Instead of tracking separate streams of information, leaders could look at a map to understand where attention was needed, how one issue might affect another, and which decisions needed to be made next.
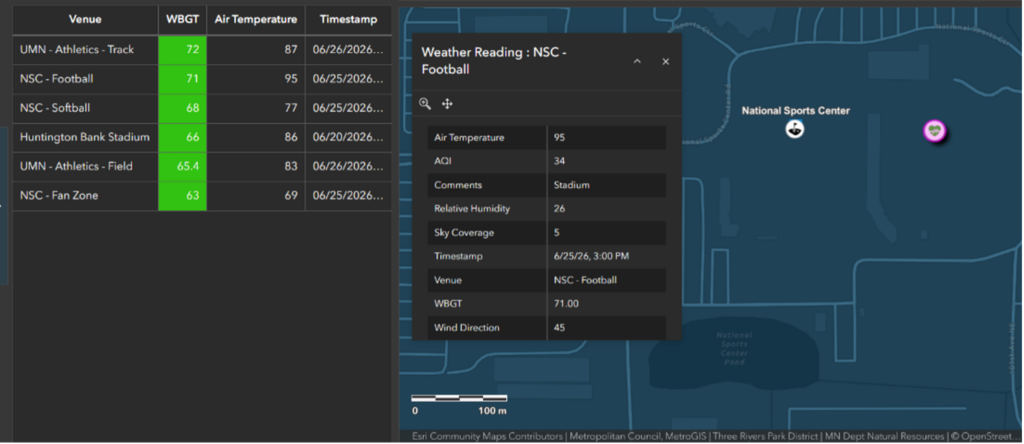
Esri’s Colin Cate helped to design the dashboard. “Situational awareness and player safety remained top priorities for event coordinators,” he said. “By integrating threat intelligence from Samdesk, lightning detections from Baron Weather, and field observations collected by university students into a common operating picture, the Main Operations Center gained real-time visibility into evolving conditions and potential risks across the event landscape.”
Practical Tools for Field Staff and Command Centers
The work for the Games was not limited to command center operations. Esri also supported the development of ArcGIS Survey123 forms that gave field staff a simple, reliable way to report what they were seeing on the ground. From an issue at a venue to an observation from a deployed team, information could move quickly from the field back to the people coordinating the response.
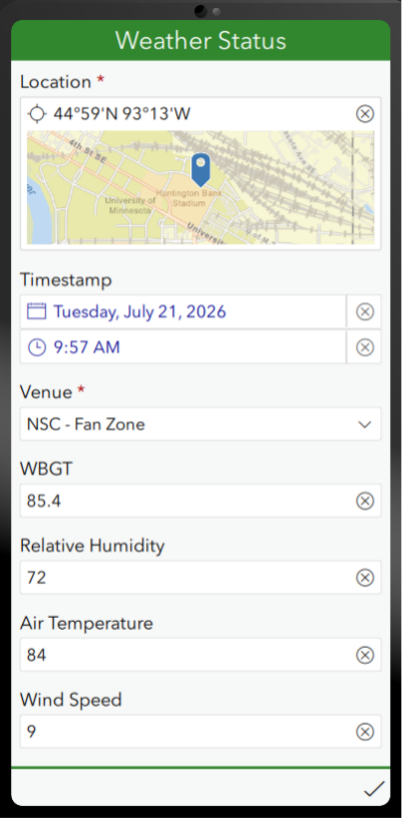
That connection between the field and the command center helped reduce delays and improve context. The solution also incorporated weather monitoring at outdoor sites and transportation data, including bus movements to and from venues. For an event built around the safe, reliable movement of athletes, staff, volunteers, and attendees, these details were not simply operational data points; they were part of the experience the Games team was working to protect.
“ArcGIS became an essential tool for our Main Operations Center and venue teams, especially when weather required schedule adjustments and operational changes across multiple competition sites,” said Kewitsch. “Having everyone working from the same real-time information improved coordination, accelerated decision-making, and helped us safely manage a dynamic, multi-venue event serving nearly 3,000 athletes and the thousands of coaches, officials, volunteers, families, and fans who made the Games possible.”
Technology Integration and Partner Data Feeds
Real-time awareness depends on connection. Esri’s Watch Center Solution served as the backbone of the common operating picture, enabling rapid deployment of real-time monitoring capabilities through ArcGIS Velocity analytics and configurable Experience Builder and Dashboard application templates. Weather alerts, transportation updates, field reports, and threat intelligence all matter, but their value increases when they come together in one shared view through the Solution. ArcGIS served as the place where those separate signals could be organized, mapped, and understood as part of the same operational story.
That integration helped the Games team move from monitoring information to acting on insight. As conditions changed, teams could better understand potential impacts, coordinate across functions, and make faster, more informed decisions.
With support from Esri partners Baron Weather and Samdesk, the Special Olympics USA Games team gained a more complete view of the environment surrounding the Games. Baron Weather provided real-time weather data to support outdoor venue and safety decisions, while Samdesk contributed real-time threat intelligence to help teams maintain awareness of emerging incidents or disruptions. Together, these partner feeds strengthened the common operating picture and gave the operations team a clearer view of what was happening around them.
A Mission-Driven Partnership
The 2026 Special Olympics USA Games were a celebration of ability, determination, and community. Esri’s support was grounded in a simple belief: When people responsible for safety and coordination can see clearly, they can act with greater confidence. By combining dashboards, field reporting, real-time partner feeds, and expert support, GIS helped transform a complex event operation into a shared, location-aware mission.
Athletes and families never saw the technology behind the Games, and that was the point. When operations run well, the focus stays where it belongs: on the athletes, the competition, and the community gathered to cheer them on. Behind the scenes, ArcGIS gave the safety, logistics, and coordination teams a clearer view of the whole picture and the real-time intelligence they needed to support the moments everyone came to celebrate.
To learn more about tools for information sharing and collaboration, visit this website.