A Customer Spotlight Story
Oman Electricity Transmission Company (OETC), established in May 2005 after the country’s electricity sector was restructured, now operates as a subsidiary of Nama Group. OETC is responsible for planning, financing, developing, operating, and maintaining Oman’s high-voltage transmission network (132 kV and above). OETC supports the nation’s economic growth and energy security by keeping the grid stable and delivering electricity efficiently.
CHALLENGE
The GIS department was stretched thin. Internal requests multiplied as more departments discovered the value of geospatial data. In addition, it was tasked with supporting a major transmission network expansion, including a project interconnecting northern and southern Oman. This process created an unprecedented demand for data, analysis, and reporting, all of which had to be delivered quickly.
Manual reporting only made matters worse. Departments requested statistics through emails or spreadsheets, and the GIS team had to pull, clean, and distribute the data. This reporting was time-consuming and created inconsistencies, as different teams often worked from slightly different versions of the same information. Delays were inevitable, and collaboration suffered.
Meanwhile, data quality presented another layer of complexity. Frequent network modifications, third-party contributions, and customer-driven projects made it difficult to maintain a single, reliable source of truth. With no centralized workflow to capture updates consistently, gaps and inaccuracies crept into the GIS database. The challenge was not only about meeting today’s demands but also about ensuring the system could grow and adapt in the future.
SOLUTION
Every organization eventually faces a moment when traditional ways of working can no longer keep pace with growing demands. For the GIS team, that moment arrived as requests for maps, reports, and geospatial insights surged across the business. What once worked—manual reporting, one-off map requests, and email exchanges—quickly became unsustainable. With limited staff and rising expectations, the team needed to rethink how to serve the organization without sacrificing accuracy or speed.
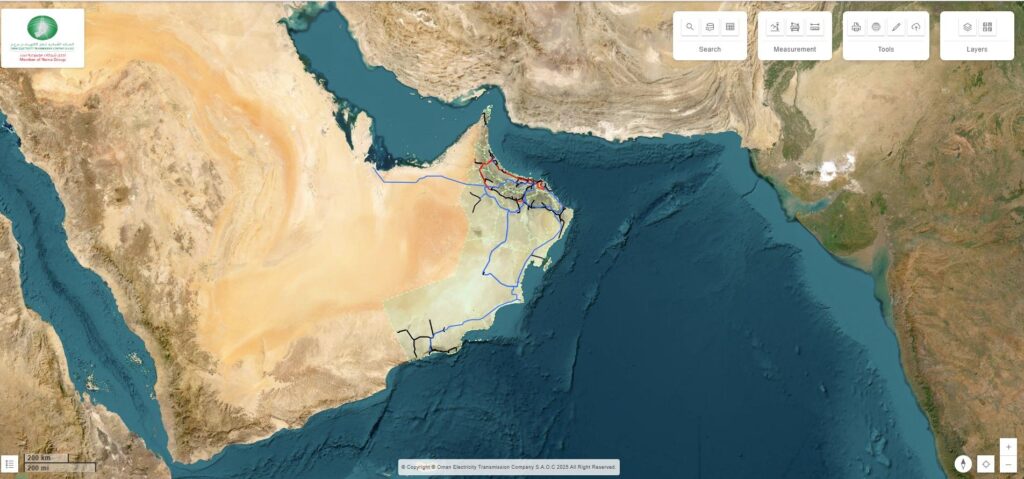
Users can capture sections of the transmission GIS for their use.
Their solution was ambitious yet pragmatic: develop a series of web applications and dashboards that placed power directly in the hands of employees and customers. By moving away from a request-driven model toward self-service and automation, the GIS team not only relieved the bottlenecks but also created a foundation for collaboration, transparency, and smarter decision-making.
The solution involved a three-pronged strategy. The first step was to develop web applications that gave employees direct access to the tools they needed –a self-service for GIS. The applications allowed users to query and download asset data, print maps, and run spatial analyses. The Object Detector tool enabled staff to draw polygons or upload coordinates to focus on specific areas of the network. Planning engineers could upload and annotate maps, manage planning workflows, and track revisions without depending on the GIS team. By opening access to the entire company, the team created a culture of self-service where employees no longer had to wait for manual support.
The second step was extensive use of ArcGIS Dashboards. These dashboards transformed the way the business handled reporting. Instead of emailing spreadsheets back and forth, departments could now log in and view real-time statistics. Asset performance teams, for example, could instantly see key indicators and download the needed data. The dashboards were dynamic, always reflecting the most up-to-date information. Specialized versions were built for OETC customers and investment teams, offering insights into substation connections and supporting investment analysis. Plans were also underway to integrate data from outage and health monitoring systems, expanding the dashboards’ reach and value. The final element was an emphasis on data quality and workflow improvements. Recognizing that reliable tools required reliable data, the team initiated a migration to a utility network with the help of a third-party provider. This step would improve scalability and ensure greater consistency across the GIS system. In parallel, the GIS team began designing new workflows to capture every network modification systematically.
RESULTS
The transformation was immediate. By shifting to self-service, the GIS team drastically reduced its manual workload. Employees who once had to wait days for a map or report could now generate what they needed in seconds. This process freed the team to focus on higher-value initiatives rather than routine requests.
The speed improvement was just as striking. Processes that used to be slowed by back-and-forth communication now happen in real time. Departments gained independence, and collaboration improved as everyone worked from the same dashboards and datasets. This access to current information made decision-making faster and more reliable for functions like asset performance monitoring and planning.
“Specialized dashboards were also developed to give internal teams direct visibility into substations and network connections, offering clarity and transparency that had not been possible before. These dashboards strengthened collaboration across departments and created new opportunities for informed decision-making.” – Tarik Al Abri, Asset Management General Manager, OETC
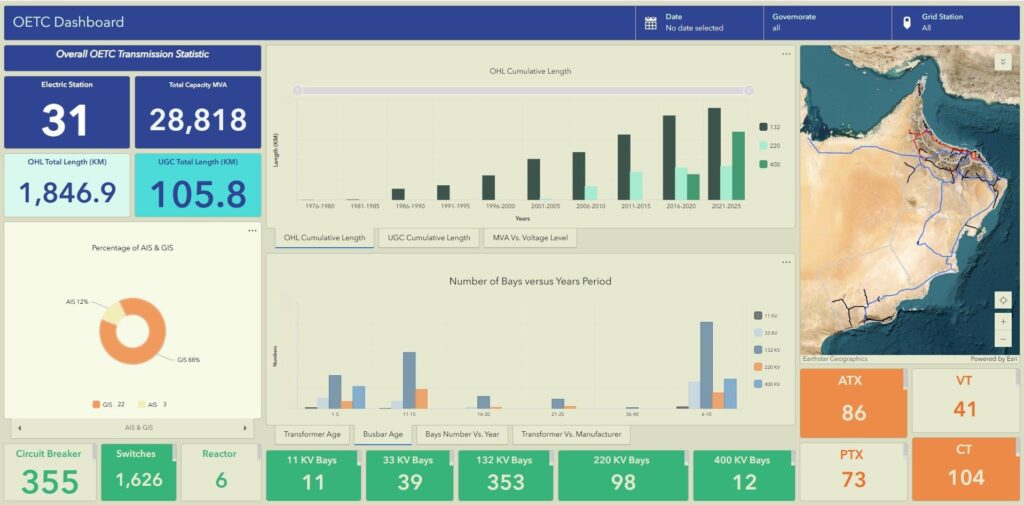
GIS-based dashboards provide ready access to statistics that were formerly manually created.
BENEFITS
Improved data quality and the initiation of migration to a utility network ensured that decisions were based on accurate, up-to-date information. Leadership could trust the insights they received and use them to make timely, evidence-based choices.
The adoption of the new tools was enthusiastic. Departments quickly integrated the dashboards into their workflows and requested additional, more specialized versions. What began as a solution to an operational bottleneck catalyzed broader digital adoption across the organization.
“The benefits extended far beyond time savings. Our employees were empowered to explore, analyze, and manage data independently. The scalability of the applications meant our team could support the growing transmission network without being overwhelmed.” – Rahma Al Balushi, GIS Team Lead, OETC.
Perhaps equally important was the cultural shift. The success of the web applications and dashboards demonstrated the power of digital innovation and created momentum for further transformation. The enthusiasm from employees showed that when people are given the right tools, they embrace them, and the organization becomes more agile and responsive.
NEXT STEPS
The GIS team envisioned dashboards dedicated to monitoring data inconsistencies and a centralized portal where all applications and dashboards would be housed for easier access.
On the technical side, the roadmap includes migrating to ArcGIS Utility Network, launching dashboards to monitor data inconsistencies, and expanding specialized dashboards to serve more departments and customer groups. The vision of a centralized GIS portal remained a priority, promising a single destination where employees and stakeholders could access all applications and dashboards seamlessly.
What began as an effort to manage overwhelming demand has become a showcase of how innovation can reshape an organization. By reimagining how data and tools are delivered, the GIS team turned constraints into opportunities. Their initiatives relieved the GIS team of routine burdens, empowered employees and customers through self-service, and built a stronger foundation for reliable, transparent, and scalable decision-making. As the organization expands, these achievements will remain central to its success. More than a technical upgrade, this story highlights how GIS can evolve into a strategic driver of business transformation—helping teams work smarter, faster, and with greater confidence in the future.