By Mitchell Johnson, GIS Analyst, Madison Metropolitan Sewerage District
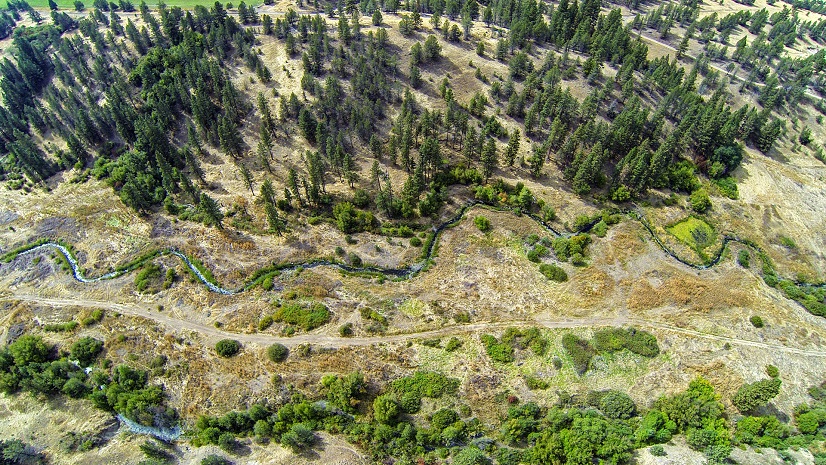
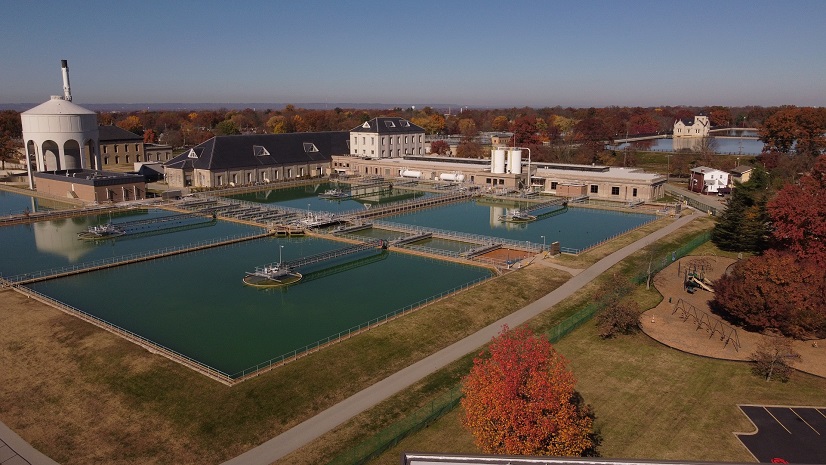
The Madison Metropolitan Sewerage District (MMSD) in Wisconsin was established in 1930 to provide a regional approach to wastewater conveyance and treatment in order to protect the lakes and streams of the upper Yahara watershed. The district serves about 407,000 people in 26 Madison-area customer communities covering about 187 square miles. It owns and operates 145 miles of pipe and 18 regional pumping stations that convey approximately 36 million gallons of wastewater at the Nine Springs Treatment Plant daily.
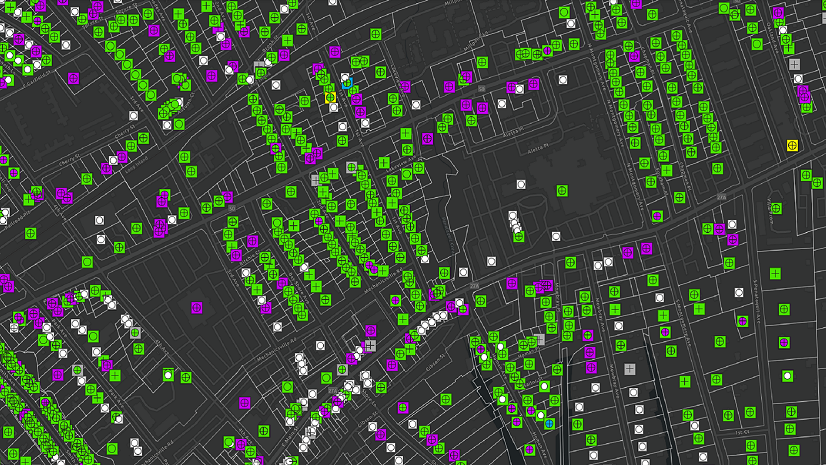
When the district migrated its enterprise geographic information system (GIS) to Esri, it moved siloed databases and paper maps to a central database, web maps, and a suite of new GIS tools. This has improved efficiency and output in utility locating, asset management, pollution prevention, and other programs at the district.
Improving Inspection Workflow
Part of maintaining 145 miles of pipe includes inspecting 20 percent of our maintenance holes each year. Our inspection workflow provided us with an opportunity to use ArcGIS solutions to improve data collection, maintenance, and analysis. Field crews were using Panasonic tablets loaded with a custom access database to fill out inspection information and take photographs. However, this workflow required additional hardware in the field and manual data synchronization at the office, lacked integration with other data systems, and took poor quality photos. Additionally, our field crews were already familiar with using ArcGIS Collector paired with Trimble R2 Global Navigation Satellite System (GNSS) receivers on their iPad tablets, so it was clear that migrating the workflow to Esri applications would be a smooth transition.
Our inspectors desired the ability to launch an inspection from web maps in the field based on their location, so we knew that the inspection data collection needed to start with a map interface using ArcGIS Field Maps. Additionally, ArcGIS Survey123 offered the most relevant set of tools to replicate the existing inspection database interface of drop-down menus, fields that can be filled in, and photo attachments.

Assessing Inspection Needs
We started with understanding what information our maintenance and engineering departments needed by conducting a series of meetings and interviews. Next, we tested whether the existing data and functionality could be migrated to Survey123. The drop-down lists and cascading logic in the existing database were easily transferred and, in some cases, improved on with Survey123 features. Lastly, we needed to figure out how to start the data collection process using a map. Fortunately, custom hyperlink pop-ups can be set up to link directly to a feature service published from Survey123 and automatically pull data from the map feature selected. This allowed for the prepopulation of data into the survey record.

Implementation
We successfully tested and implemented a procedure in which the inspector uses ArcGIS Field Maps to view a map, select a maintenance hole, open the inspection form via a hyperlink in that maintenance hole’s pop-up window, fill out information in Survey123, and submit the survey. That survey is sent to a table in the enterprise geodatabase. A Python script runs every 30 minutes to append entries in the initial survey table to a table that is in a relationship class with our maintenance hole feature class.
We held two, one-hour in-person trainings and provided a user guide along with an instructional video. This combination of training and documentation helped to educate inspectors on the new tool. Additionally, a dashboard was built using ArcGIS Dashboards to visualize and summarize inspection data.

Reviewing Results
The new inspection workflow was successful in more ways than one. In addition to providing the functionality that the team needed, it allowed us to examine issues with redundancy in the data collection process. After a season of inspections, we learned that the workflow required inspectors to fill out unchanged information (e.g., size, material, and location) when they revisited the maintenance hole after completing any rehabilitation work identified in the first inspection. They only needed to update the work they did during rehabilitation. In the old system, staff worked around this duplicate data entry burden by editing existing inspections, which resulted in bad data where inspections would include information about defects as well as completed repairs for those same defects. This would make it difficult for a user to interpret the state of the maintenance hole years down the road. The previous work-around was not possible in the new workflow, as we built the form to require new data points each time an inspection was generated. This was to ensure quality of the data generated as part of the inspections.
Another thing we learned was that much of the information collected during inspections was not being effectively utilized, making data collection efforts less meaningful. So while we had a great new tool for doing routine work, we were still not taking advantage of the resultant data and analysis.
Changing Our Approach
To address these new challenges, we took a step back and reevaluated each data point being collected and how that data is used. We put together a project team that included GIS staff, inspectors, asset specialists, and maintenance supervisors. We also used a project charter to agree on the terms of updating the inspection workflow as well as what the data is used for. This approach put less emphasis on the tools and more on what is going into them to reconstruct them more effectively. We updated the workflow as defined by our project charter process, automatically populating more static information—such as measurements and material—to avoid duplicate data entry when reinspecting assets after rehabilitation work was done.
We decided that overall condition is not very useful for scoring maintenance holes, as this is a subjective evaluation for the inspector on that day. Instead, we focused more on what specific defects exist, what we should be vigilant of long term, and what work needs to be done in the near term. Ultimately, this reduced data entry burden on the inspectors and filtered out a lot of the noise in the data for those who make maintenance and engineering project decisions.
Lessons Learned
Look at the whole process beyond the tool itself.
- When modernizing an existing tool or workflow, or even building a new one, it is an opportunity to reevaluate the whole process it is supporting.
- There are likely legacy components or irrelevant steps that can be removed because of the new tool or methods.
- Comb through each piece with stakeholders to identify opportunities for improved efficiency. At the very least, you will have a better contextual understanding of the work itself.
Focus on your source.
- Understand who is collecting the data.
- Analysis and how it is used will only be as good as the source of your data.
- Make your data collection process as simple and accessible as possible for those doing the collecting.
Avoid “nice to haves” and “shiny things.”
- It is easy to be enamored with the prospects of new technology, and you may hear that your organization desires a particular tool.
- However, it is your job to understand what the organization needs and build the tool from a foundation of those needs.
- Otherwise, you will end up with something that creates more work for your team and/or does not function as intended.
Bring people together and build a team.
- Do not shoulder an entire project yourself.
- Team members will begin to own the data, tools, and process as they contribute to the project.
- This will result in the whole team putting forth more effort to develop an improved workflow.
Keep the conversation going.
- You are never done improving solutions.
- Keep meeting with the team and those who interact with the tool so you can continue to improve on it, identify other uses for the tool, or incorporate new features.
- This also builds accountability for decisions on process changes along the way.
Looking Forward
Today, we are linking work request data from our computerized maintenance management system (CMMS) to the GIS for a geographic view of work assigned to maintenance staff. We are going to filter and consolidate asset information and work order data into one dashboard for ease of use and analysis. Users can go to a single location to plan future work, making the most of our inspectors’ efforts, rather than search across different tables, databases, and interfaces to track down information. We are also planning to utilize the latest features of ArcGIS Dashboards to inform capital improvement project decision-making, as well as track outstanding maintenance work on our assets in the district collection system.
Now it’s all on our phones. It’s a huge efficiency improvement—the database integrates with our locating program, so now that data can be better utilized for that part of our work. Mitch has done a fantastic job and really helped us a lot.
Stay Connected with Esri’s Water Team
ArcGIS is an extensive information system that enables modernization of workflows with easy-to-use applications for the field and office. Strengthen your organization with smart solutions that will increase efficiency and provide insight for decision-makers. Visit the Esri Water Utilities web site for more information.
Join the Water Utilities Community
Follow #EsriWater on social media: Twitter | LinkedIn
Subscribe to the Water Industry newsletter “Esri News for Water Utilities and Water Resources“
Learn more about how GIS supports digital transformation.