This is a series of blogs showcasing the user presentations from the Esri Conservation Summit—Africa, which was held virtually in September 2021.
Empowering Indigenous Communities with Conservation Solutions—African People & Wildlife, Tanzania
African People & Wildlife (APW) envisions a world where Africa’s people and wildlife coexist and thrive in vibrant, healthy landscapes. The team at APW works to realize this vision through innovative efforts in Tanzania and other African landscapes. These efforts, together with proven community engagement expertise, drive effective, measurable, and lasting outcomes for communities and nature.
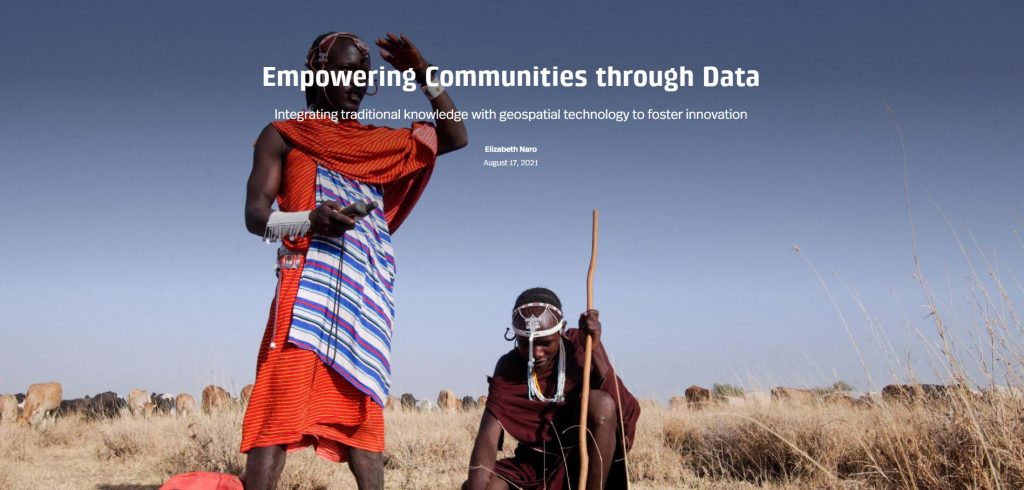
At the Esri Conservation Summit—Africa, Elizabeth Naro, monitoring and evaluation and geographic information system (GIS) lead, shared several powerful examples of efforts to find a balance between tradition and technology to foster innovation in conservation science.
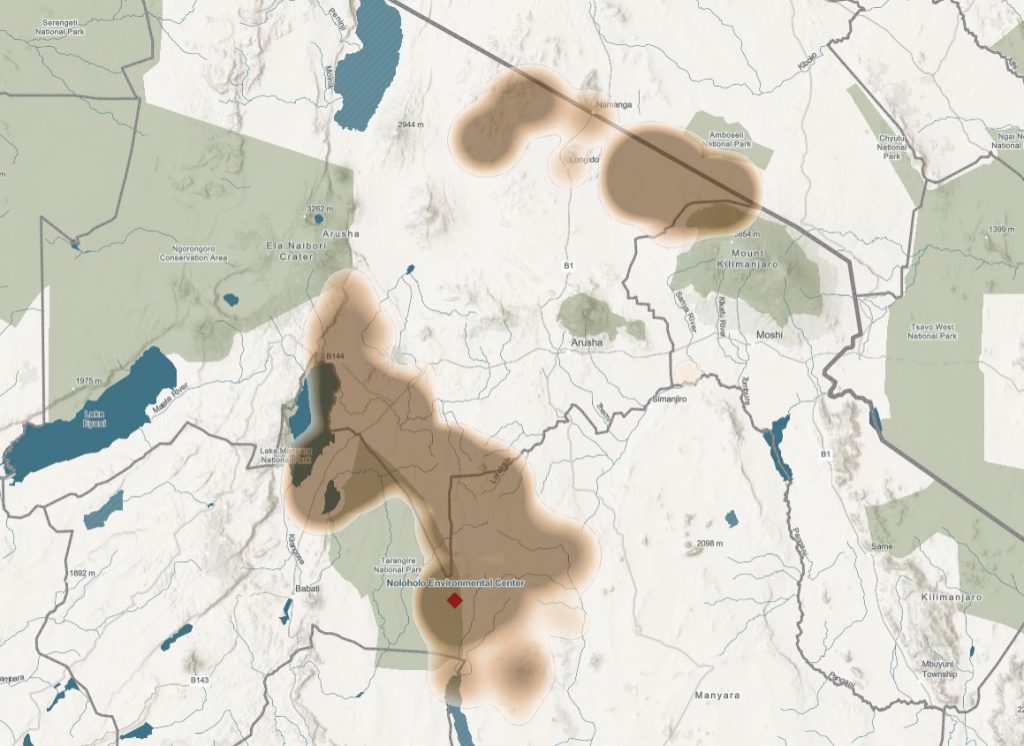
APW is based in northern Tanzania, with its headquarters, the Noloholo Environmental Center, located at the southeastern border of Tarangire National Park. The organization was co-founded in 2005 by Dr. Laly Lichtenfeld and Charles Trout to turn negative trends in wildlife conservation around and understand environmental issues from the local point of view.
Home to some of Africa’s most iconic protected areas, northern Tanzania is a biodiversity hot spot. But the country’s protected areas are not fenced, which allows wildlife to roam freely along natural migratory routes that cross through human-dominated landscapes. This means that 92 percent of the rangeland is shared between people, livestock, and wildlife.
Naturally, this freedom of movement increases the likelihood of human-wildlife conflict. APW focuses its work on land outside formally protected areas, where finding the balance between human well-being and healthy ecosystems is critical for long-term sustainability.
Reducing human-wildlife conflict is a primary goal for APW, and the use of geospatial technology through ArcGIS Platform has furthered its work in three main program areas: the Human-Wildlife Conflict Prevention Program, the Natural Resource Stewardship Program, and the Conservation Enterprise Program.
Human-Wildlife Conflict Prevention Program
When APW was founded in 2005—and for the first decade of its work—team members collected data on human-wildlife conflict incidents through paper forms. The forms were filled out by local Maasai warriors, whose traditional role in a community is to protect people and livestock from predators.
As APW team members, Warriors for Wildlife provide invaluable data on conflict trends and helped design the Living Walls Program, where living Commiphora trees form the posts of a cattle corral. This nature-friendly corral is reinforced with chain-link fencing to create an impenetrable barrier.
In 2016, APW shifted to mobile data collection using ODK Collect. However, analytics and visualizations were developed manually in Excel and other visualization and reporting solutions. In 2019, APW connected with the Esri conservation team and was granted access to ArcGIS Solutions for managing protected areas.
This really revolutionized the way we collect data in the field and provided a platform for automated output analysis, giving us more time to conduct outcome- and impact-level program evaluations that require more qualitative data. – Elizabeth Naro, monitoring and evaluation GIS lead, African People & Wildlife
One of the tangible outcomes of deploying ArcGIS Solutions is simple analytics in real-time. ArcGIS Dashboards linked to live ArcGIS Survey123 data provides a current operational view of conflict data. The dashboards are configured to visualize the most appropriate information to support APW’s and its partner communities’ understanding and management of conflict dynamics.
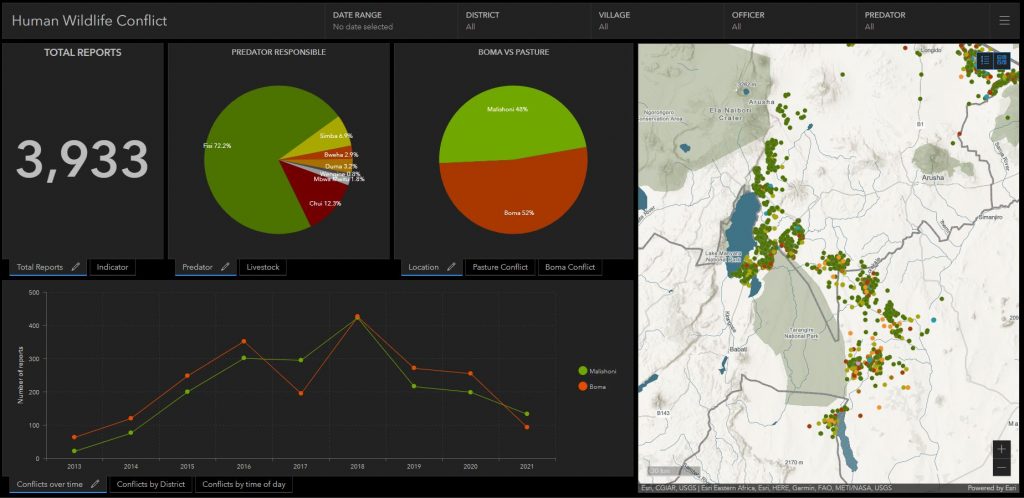
For instance, the percentage of conflict incidents by predator type can be quickly visualized, revealing that hyenas (or “fisi” in Kiswahili) are responsible for over 70 percent of attacks on livestock. Drilling deeper into the hyena attack charts reveals that 60 percent of these conflicts occur at the boma, or household, not in the shared rangeland.
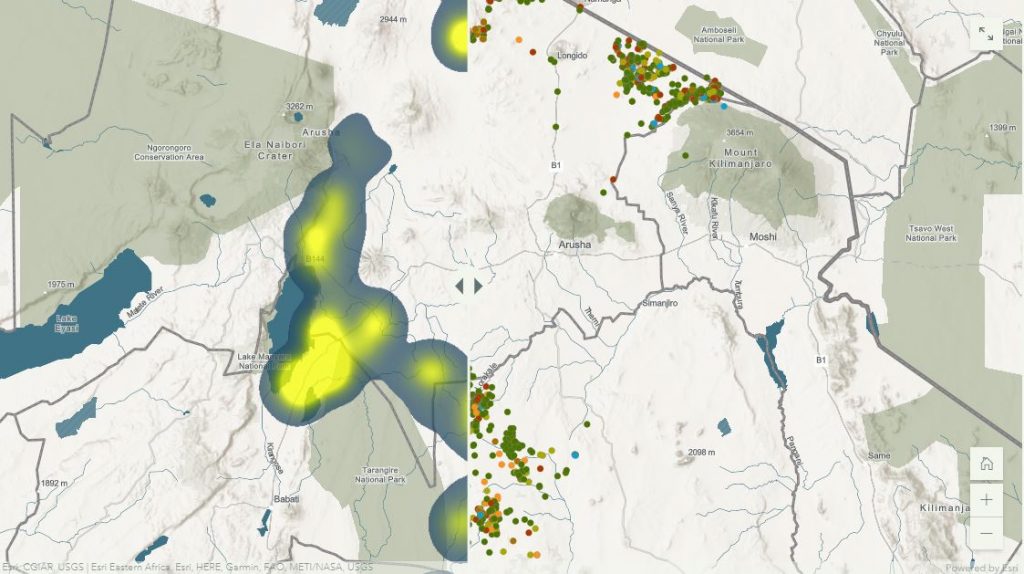
Reviewing such information by political district allows APW to set priorities for living walls and other programs to best target resources toward interventions most likely to make a positive impact. To visualize conflict data within the districts, heat maps are dynamically generated to further focus intervention efforts.
Working with communities and other local partners, APW has planted more than 210,000 trees to build over 1,500 living walls. By eliminating the need to cut trees to build traditional corrals, living walls revitalize habitats, improve landscape connectivity, and increase local climate change resilience. They also secure the livelihoods of over 18,000 people living in rural northern Tanzania and protect a population of about 500 lions from revenge killing.
After successfully transitioning the Human-Wildlife Conflict Prevention Program to ArcGIS, APW explored whether the same tools could be useful for rangeland management by community decision-makers.
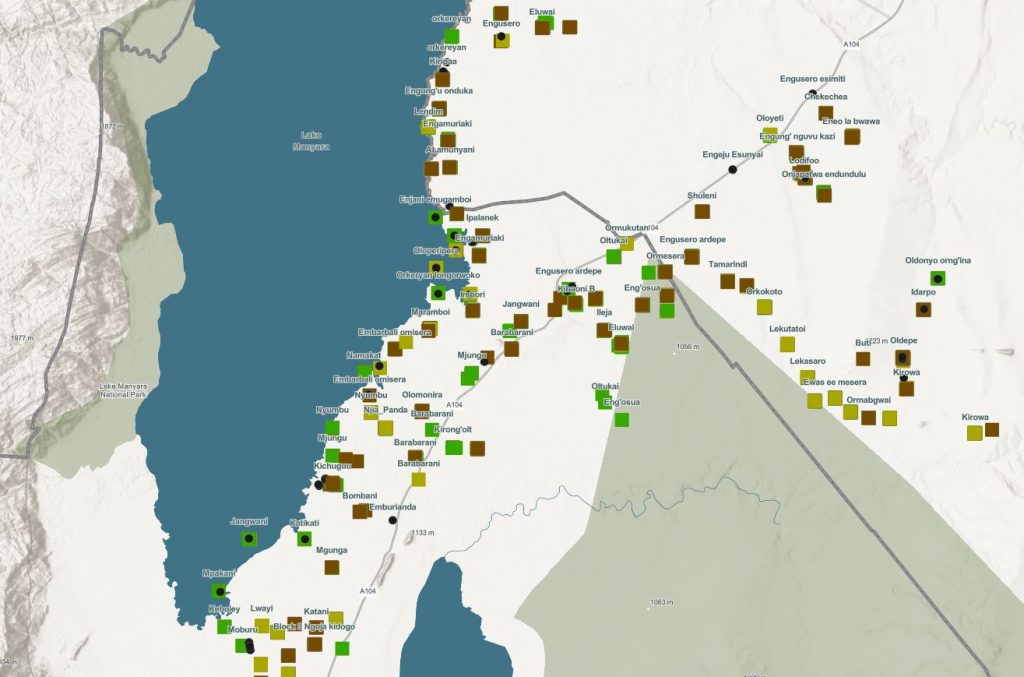
Naro and her team transitioned the rangeland monitoring protocols to Survey123. By observing the grazing quality of critical pastures each month, pastoral communities are better able to manage rangeland to ensure that grass resources are sustained throughout the dry season.
The monitoring program involves working with the grazing committees in each village to select plots for monthly surveilling. Two local pastoralists from each community regularly measure grass height, vegetation cover, and a few other pasture quality metrics every 5 meters along a 100-meter transect, creating 20 samples.
This sampling data is then simply visualized in ArcGIS to help the grazing committees make informed management decisions.
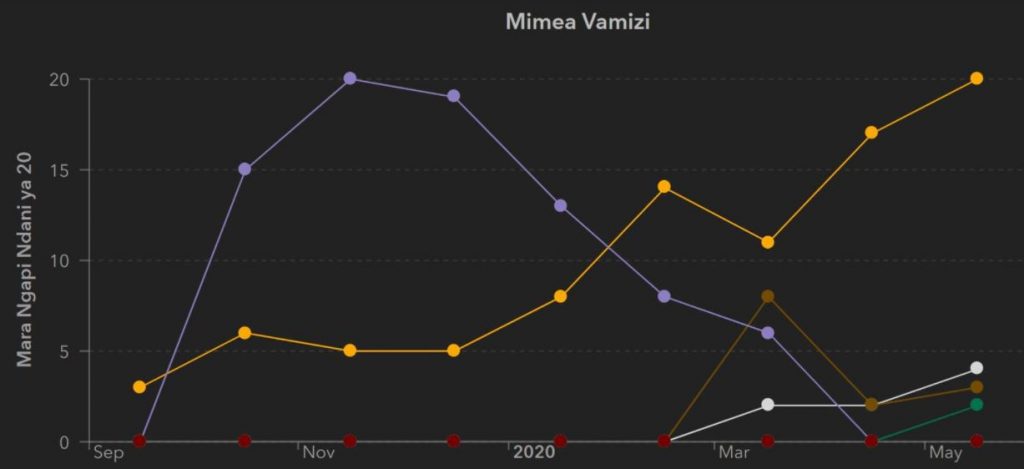
As the rangeland monitoring program developed, the village grazing committees expressed their need for more data on invasive species trends. Working with rangeland monitors across northern Tanzania, APW created a field guide of common invasive plants. The locally relevant names of each plant were then incorporated into rangeland monitoring Survey123 forms.
As the communities’ traditional and observational knowledge was augmented with the incoming monitoring data, trends became apparent, such as the dangerous expansion of the invasive plant Solanum incanum.
Incorporating a related table in the form simplifies the rangeland monitors’ collection of invasive species present in the 20 samples along each transect for every plot. Displaying multiple species in one chart, however, presented a challenge, since the question was initially written for multiple selections.
APW’s GIS team overcame this challenge with an ArcGIS Arcade expression that sorted, filtered, and calculated the frequency of each species and populated that frequency back into the parent dataset. Linking the parent dataset to the reference feature layer powers a multiple-series serial chart in the rangeland monitoring dashboards.
Rather than sending communities to a complex regional dashboard that requires navigation to areas of interest, APW configures village-level dashboards to support local conservation management decisions.
Any participating village can easily visualize how the presence of invasive species compares to the grass height and the pastoralists’ observations of grazing quality.
APW’s community-led rangeland monitoring approach is proving valuable. Village grazing committees utilize the dashboards in near real-time to make decisions about when to rest pastures, shift grazing to other areas, or implement invasive species removal techniques.
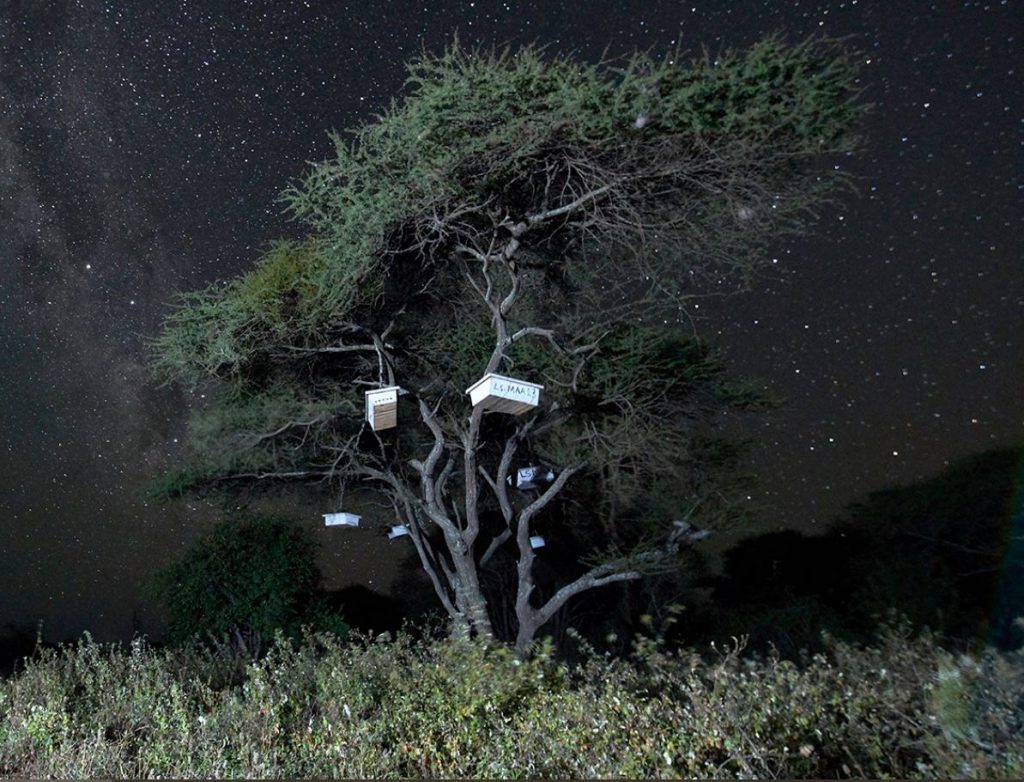
Another example of APW working to support sustainable livelihoods for rural communities is the Women’s Beekeeping Initiative. Women’s groups in communities near Tarangire National Park harvest honey to sell in local markets.
Since trees cannot be cut down if they support local enterprises, the beehives provide some protection for shade trees and pastures. However, the hives may also help restore larger portions of rangeland, since honeybees will travel about five kilometers from their hive for nectar and are more likely to select native species as fodder.
Leveraging ArcGIS Pro, Naro’s GIS team generated a five-kilometer buffer around each hive tree to show where the bees may pollinate native species. The result of this simple analysis is an estimated 439,000 acres of pasture that may benefit from the presence of the hives in the beekeeping program.
To test that assumption, Naro plans to incorporate the rangeland monitoring plot data to compare invasive species’ frequency trends between plots within the beehives’ zones of influence and those outside. This integrated approach will help estimate how beehives are impacting the landscape. Most importantly, this data and visualization help advise where best to place new beehives as a restoration technique in degraded pastures.
In addition to working directly with villages and community groups, APW partners with local government authorities to facilitate evidence-based conservation decision-making. APW is exploring ArcGIS Hub as a tool to streamline its collaboration with government partners.
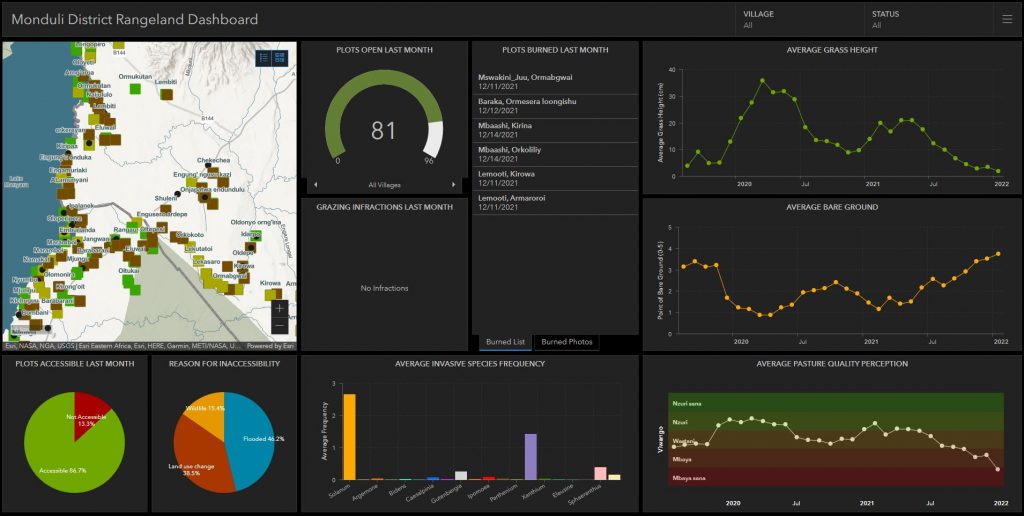
In the Monduli District, a hub site created using ArcGIS Hub provides easy access to information on APW programs in 13 villages on topics including human-wildlife conflict, rangeland management, and the women’s enterprise programs. Rather than navigating through ArcGIS Online or having to individually sort various dashboards to see relevant data, a district-level user can view a localized hub that has already been tailored to the community’s needs.
The hub provides the district manager with monitoring information on topics such as the number of community members hired for various monitoring efforts, numbers of human-wildlife conflicts responded to, kilograms of honey harvested, and information on living wall installations in the district.
Metrics are generated using the summary statistics feature in Hub and fed directly from a feature layer created by an active Survey123 form for living wall installations. These dashboards are constantly updated as observations are made, so users can monitor the progress of APW programs in real-time.
This tool can be so powerful for decision-making when put directly into the hands of village- and district-level land managers. For instance, here they can see how many pastures were open for grazing last month, as well as if there were any pastures grazed when they shouldn’t have been. – Elizabeth Naro, monitoring and evaluation GIS lead, African People & Wildlife
Another way APW’s efforts foster local collaboration is by supporting neighboring communities to create equitable grazing plans when critical pastures are inaccessible.
For instance, Oltukai village has four critical plots that were recently flooded. The rangeland monitoring platform helped the communities and the district government visualize data about the affected area collaboratively, supporting the development of intervillage grazing agreements to ensure that neighboring communities share pasture resources for the benefit of all.
The APW system provides an agnostic visualization tool to aid in political negotiations by facilitating better-informed and more equitable decision-making for conservation.
In conclusion, Naro shared a quote from a Tanzanian colleague, Yamat Lengai, who works closely with community decision-makers on these types of issues. She says, “In this ever-changing environment where technological tools can be so powerful, this data will allow us to put our partner communities at the forefront of conservation.”
To learn more about African People & Wildlife, visit their website.
To learn more about Esri conservation and the Esri conservation program, check out our recently updated site.