The end of every year is for me, always a time for reflection, the time to clean up the mess in the office and to prepare for the new year. At this time last year, we were still in the throes of a supply chain mess, and most transportation sectors were still in recovery mode, with the exception of public transit. Looking forward, analysts are beginning to talk about a “return to normal,” although there is some debate about what the new normal may look like: https://bloom.bg/3GmY3t1.
Rather than focusing on these disruptions and their uneven impact on transportation in 2022, there are for me, four trends that stand out, along with some great work from the Transportation community that deserve some comment.
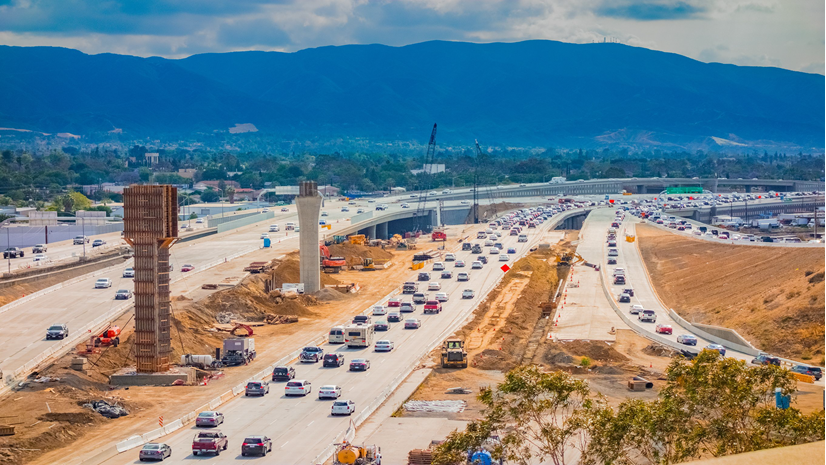
1. Strategic Infrastructure Investment
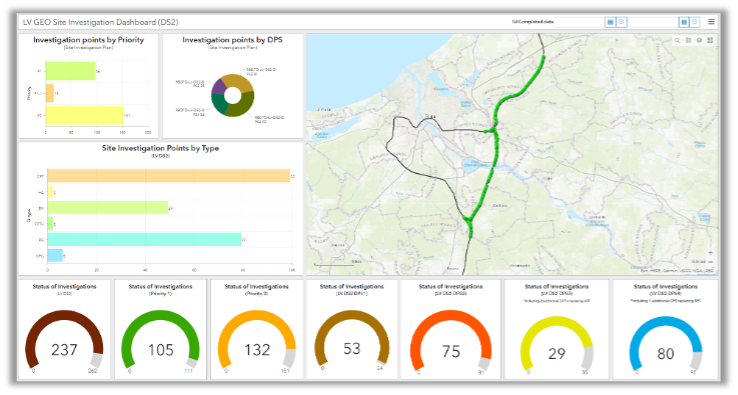
While the Infrastructure Investment and Jobs Act (IIJA) was signed in late 2021, it was really not until 2022 that many State DOTs began to see the roll-out of the infrastructure dollars and the targeted grants contained in the Bill. While we put together resources outlining a few areas where GIS (geographic information system) could play a major role in some of the grant areas, it is in the ability of GIS to help State DOTs make more strategic infrastructure investments that I would like to briefly focus.
Making the most strategic investments almost always involves finding the optimal balance between different values—whether safety concerns, congestion mitigation, or economic development considerations—to achieve the greatest societal benefit. Analysis supported by GIS can help us understand the trade-offs between different investments, ensuring that we target dollars to deliver the greatest impact.
The analytical tools in ArcGIS are perfectly suited to this type of trade-off and prioritization analysis. The goal is to ensure the right project, at the right time, at the right cost. Whether alone or in combination with other tools and models, GIS can help visualize and analyze a number of competing alternatives to ensure the most strategic decision, and to ensure that we are building the infrastructure of the future and not replicating the networks of the past. You can learn more here: https://bit.ly/3qCo7qK.
2. Digital Delivery
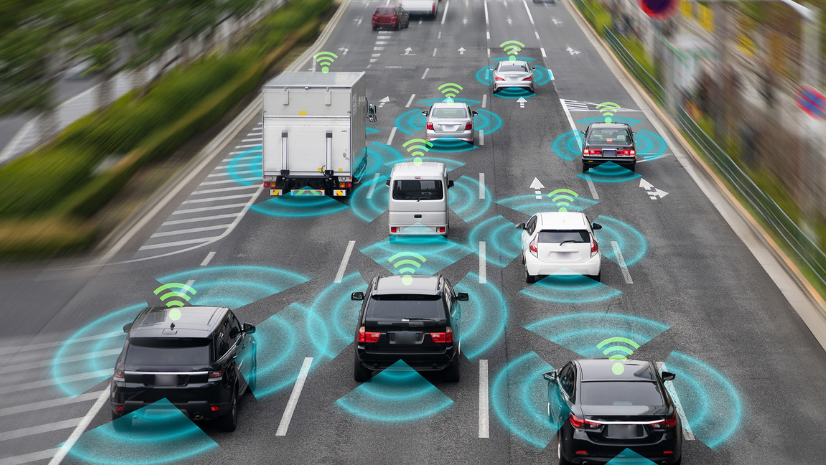
One of the key themes I see reflected across several transportation domains is digital delivery, or how we can better integrate our technologies across the project lifecycle. Not only have any number of State DOTs started the process of attempting to streamline and integrate their design and construction management processes, but it is also emerging as a central topic in the rail, public transport and airport sectors in Europe and Asia as well.
While the technologies used for planning and for operations and maintenance have always been fairly well understood, the transition from design into construction and construction management have always been a rather “messy affair.”
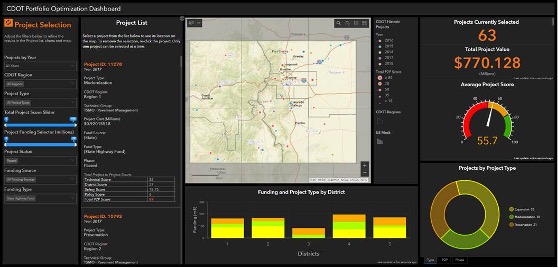
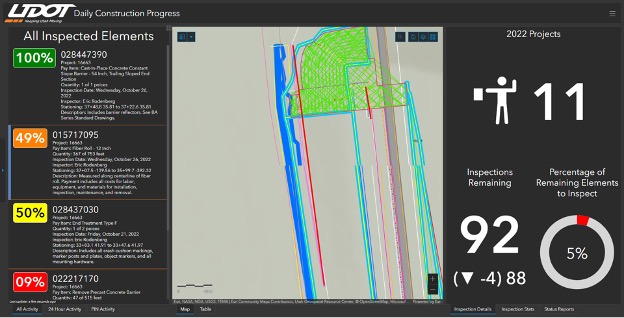
As a result, several State DOTs have attempted to bring greater standardization and integration to the workflows associated with construction management. Leaders among State DOTs have been Utah, Montana, and California (Caltrans) DOTs, all who have brought their software vendors together to help them understand how they can share information across platforms, all in the effort to better manage the wealth of data through the project delivery process. For those who are not familiar with these efforts, Utah DOT has an excellent website that documents their progress: https://digitaldelivery.udot.utah.gov/
At heart, these efforts seek to integrate GIS, design software, together with project management, and mobile inspection technologies to not only share data and information across the different workflows involved in project delivery, but ultimately across the full lifecycle.
A leading example in rail is the new railway construction associated with Rail Baltica, which is a new greenfield rail construction project funded by the European Union, and which ties the Baltic countries to the rest of Europe by rail. In their case, GIS will be the foundation for their connected data environment (CDE) and will integrate with their design software (Autodesk) and their project management suite from Primavera, delivering 2 and 3D data along with mobile inspection tools through Esri technology. Rail Baltica is setting a new standard for greenfield rail construction in Europe. To learn more visit, https://bit.ly/3WPAb6r
3. Transportation Equity
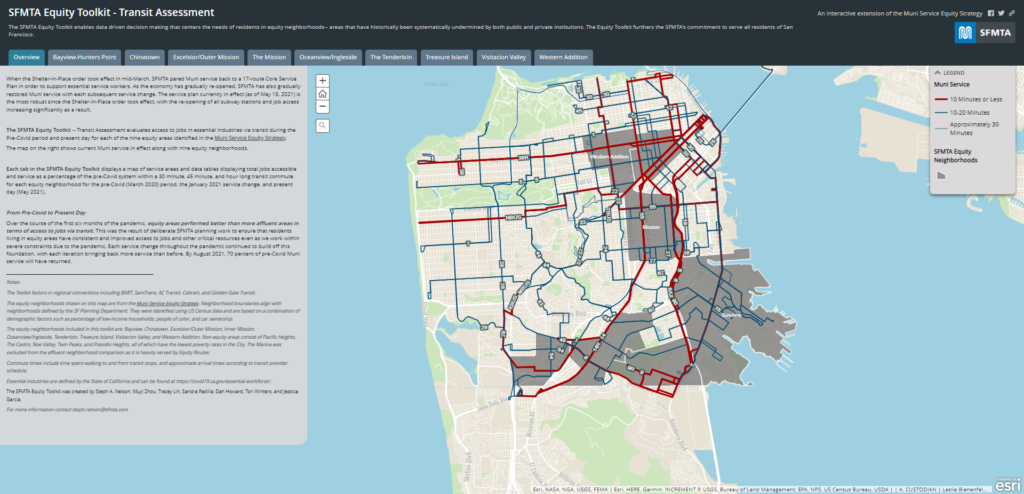
Among public transit agencies, understanding how to provide more equitable transportation systems is one of their top priorities. Transportation plays such a critical role for accessing educational opportunities, jobs, housing, health care, and other services that enable economic prosperity, physical and emotional wellbeing, and social mobility. In fact, researchers at Harvard found that transportation is the single most substantial factor in the ability to escape poverty. Conversely, a lack of transit access often further exacerbates structural inequities in health and wealth in low income minority communities.
The first step in creating a more equitable transportation system is for agencies to understand equity priority communities, including their location and characteristics. Having access to ample datasets like Esri’s ArcGIS Community Analyst can not only provide detailed information about the location and detailed characteristics of various disadvantaged communities, but also richly detailed information about the location of jobs, schools, healthcare, among other data. The San Francisco Metropolitan Transportation Authority has done an outstanding job of analyzing the current transit reach of various communities in San Francisco. SFMTA’s work furthers their commitment to serve all residents, to create access to opportunity and to redress economic disparities. Read more about SFMTA: https://bit.ly/3C5YuW0 .
Similarly, Chicago’s Regional Transportation Authority utilized GIS to conduct a detailed analysis of Critical Need Areas, to assist the three major transit operators in the Chicago area better understand the location of those areas within the region having greater-than-average densities of inhabitants who are most likely to use transit to commute, need transit in general, and work in industries that require a physical presence: https://bit.ly/3WuHyk2 .
You can learn more about how GIS can help agencies build more equitable transportation systems here: https://bit.ly/3PW507k
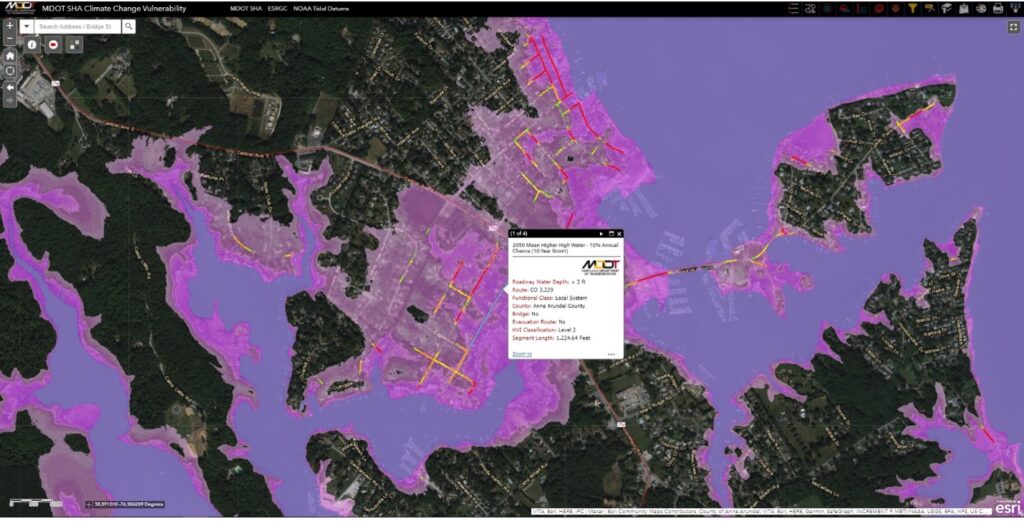
4. Climate Resiliency
2020 and 2021 set new records for the most number of climatic events costing over $1 billion dollars, (https://www.ncdc.noaa.gov/billions/). The last several years have convinced most decision makers that climate change is real, and that we need to start preparing our infrastructure to survive those impacts. In fact, the Infrastructure Investment and Jobs Act specifically calls out funds to start the process of “hardening” our transportation infrastructure, and for climate resiliency efforts.
Esri assisted the White House in their Climate Initiative, and the new Climate Mapping for Resilience and Adaptation Portal: https://bit.ly/3WPc0Fi . Designed to help communities access their future climate risk, and to identify sources of federal funding to help them address these climate challenges, the website leverages the best data on future risk together with GIS maps and analysis to provide the foundation for analysis.
There is wide consensus that GIS technology provides the foundation for much of the analytical work in understanding these impacts. But just as importantly, GIS plays a key role in effectively communicating climate impacts to policy makers and the public. “Data visualization is so important,” Dr. Katharine Hayhoe, of the Climate Science Center at Texas Tech University, recently stated. “In fact, I would go so far as to say that you could be doing the best science in the world, but if you do not visualize that science, it could end up being completely useless to anybody but you.”
You can learn more about how GIS enables climate resiliency analysis here: https://bit.ly/3I69OFj .
Looking Forward
These trends certainly keep us at Esri busy as we are continuously trying to find better ways to support the transportation industry through these key initiatives. We look forward to seeing many of you at various events during the year, starting with the 102nd annual meeting of the Transportation Research Board in Washington DC.
I certainly wish all of you a prosperous and productive New Year!