By: Petr Kestler and Vladimír Plachý, ČEVAK a.s. | petr.kestler@cevak.cz
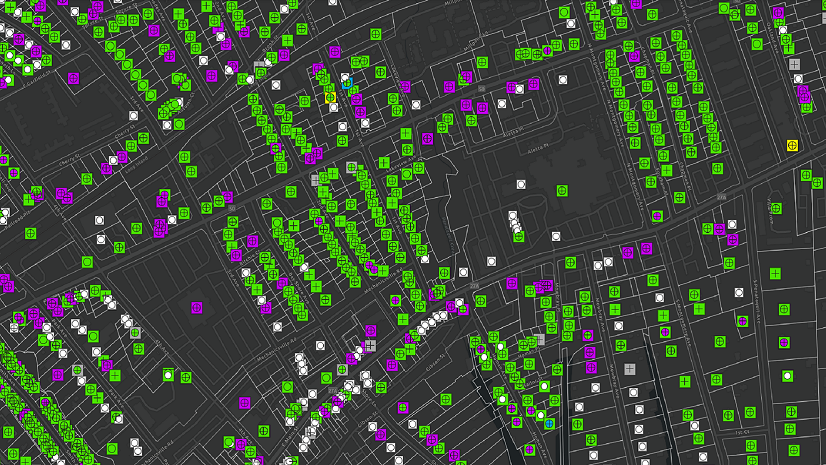
ČEVAK a.s. manages water management infrastructure for more than 300 towns and villages in the Pilsen area and the South Bohemia and Vysočina regions. The company supplies drinking water and wastewater services to more than half a million residents. The geographic information system (GIS) at ČEVAK provides a detailed overview of 5,600 km of water supply and 4,200 km of sewer networks for 350 owners (i.e., the aforementioned towns and villages). The centralization of the system allows the GIS team at ČEVAK to manage spatial data for the other companies of the Energie AG Bohemia group, operating in Beroun, Chrudim, Kolín, and Rychnov nad Kněžnou. In total, we maintain over 14,800 km of networks in seven regions of the Czech Republic. This article describes how we have used Esri technologies to innovate with our geographic information system.
The activities of a water company depend on, among other things, several key information technologies, which inherently include a geographic information system. At ČEVAK , the role of GIS is primarily to support the operational activities related to the water and sewer system that we manage and operate. This includes not only visualizing the network system in the office and the field but also supporting the planning and implementation of network development; commenting on the existing networks; exchanging data with planners; and providing geographical information to other information systems, such as graphical representations of tapping points for the customer information system or interfacing with the technical information system.

A Chance for New Technology
It’s been a few years since Autodesk discontinued support for some of its products, and like many other users, we were faced with the decision of what direction to take in GIS. After mapping the market internally and comparing different technology options, we decided on ArcGIS. Not only did Autodesk’s recommendation play a role in our decision to go this route, but also we were convinced by features such as the openness of the system and ArcGIS technology’s modular solution, which allows us to customize components for different groups of workers across the company.
As part of Energie AG Bohemia, ČEVAK provides GIS for several companies located in different regions of the Czech Republic, so the challenge for us was to harmonize data models and solve for specifics in relation to the common GIS infrastructure within the entire group. An example is the operation of other utility systems, such as the district heating network operated within Energie AG Kolín’s Heat Division.
First Phase: Prototype
From learning about the new technology to implementing its deployment in live operations, the entire process took approximately three years. It’s safe to say that everything was new to us: the difference in technology philosophies between CAD and GIS, the ArcGIS technology itself, even the way the project was implemented during the pandemic.
In the initial phase, we needed to get to know the technology better. We built a GIS prototype involving the installation of the core ArcGIS Enterprise and ArcGIS Pro technology to use with our data. We identified a few test scenarios and, through basic web and desktop applications without any customizations, we tried out common GIS functionality. We were surprised by the possibilities in the form of ready-made applications and tools this technology has and how quickly we could configure the applications. This prototype confirmed that we were on the right track, and we decided to embark on a custom migration project.

The Approach of Using as Many Standard Tools as Possible
Given the scope of the project and the involvement of the other companies, an initial analysis was essential. The analysis touched on all areas of the migration to the new system—as with any project, key business processes and objectives were defined and the system architecture was designed accordingly. The intention was to use as many standard tools and applications as possible and only resort to software development if necessary. At the same time, we wanted to monitor the entire migration process closely so that we would learn to operate the new system as not only users but also administrators.
At the core of the new system is ArcGIS Enterprise, which makes data available in the form of web services. We have used an integral part of this system—a portal that provides the infrastructure to manage users and GIS content and allows users to set appropriate permissions. We adopted the core framework technology without modification, which allowed us to focus on revising the previous data model—which we significantly redesigned—and fine-tuning the user features and the user interface itself.
For the user interface of the web application, we chose a concept based on ArcGIS Experience Builder because it gives us—as nonprogrammers—the ability to manage and easily create web applications in a purely configuration-based way. Widgets were configured to meet needs that were not met within the standard technology implementation—for example, the theming widget, which displays data according to a certain phenomenon, and the print series widget, which allows users to print multipage outputs based on a defined line or print area. We used the same concept of creating a web application to provide a GIS view to the owners of the infrastructure we operate. Users of the superlight client (as we call this functionally slimmed-down version of the web-based GIS application) are typically municipalities that now can view their water and sewer network data in real time.

Management and Editing Applications
GIS administrators and editors are equipped with the ArcGIS Pro desktop client, which connects to the central portal and uses some data from it, such as the underlying maps or the RÚIAN location service. For the most part, users of the desktop client can get by with the standard functions. But for tasks such as exporting data to a CAD file format (DGN file type) according to a specific directive, it has been extended with customized add-ons.
For work in the field, the ArcGIS Field Maps app lets employees view current network data on a mobile device. We see the advantage of this app in being able to work both online and offline and easily relay information from the field to the office staff. A great advantage is that this application can be used by all our employees. They can view and query the data anytime and anywhere.
GIS serves as the primary source of network infrastructure data. Specific information from the GIS is shared with various integration interfaces to support critical business systems. The GIS is thus integrated with the technical information system; the customer information system; and the expression portal, to which the GIS provides functions for network conflict assessment or data export via web services.
Our Level of Satisfaction
In most cases, new technologies are not well received by users, so we were all the more pleased when the feedback was positive after deploying the new GIS solution. This is important to us because we feel a commitment to our colleagues, for whom we want to provide a modern working environment. The new GIS solution is based on the latest technology, and although it works with complex data and offers many features, the whole environment is fast and stable, with a high level of security. The new solution has succeeded in simplifying searching an area of interest with a unified search engine that responds to searches for parcel numbers or specific operational objects. The capabilities to print map series has been expanded, including the overview of the layout of individual cut sheets. The range of data model levels used has been simplified. In the new GIS solution, we have gained a powerful tool that teaches us that some familiar practices can be addressed in other ways.
We plan to develop GIS further in the future. We would like to extend the solution to other companies that are part of the Energie AG Bohemia group. We are also considering introducing some previously unused functions into our own system that would enable users to view collected information more clearly. We plan to use ArcGIS Dashboards to provide comprehensive visibility of basic operational data, including the number of consumption points, the lengths of pipelines, or the age of networks. Another benefit to users will be the customization of the web application to meet the requirements of each department.
Stay Connected with Esri’s Water Team
ArcGIS is an extensive information system that enables modernization of workflows with easy-to-use applications for the field and office. Strengthen your organization with smart water solutions that will increase efficiency and provide insight for decision-makers. Visit the Esri Water Utilities web site for more information.
Join the Water Utilities Community
Follow #EsriWater on social media: Twitter | LinkedIn
Subscribe to the Water Industry newsletter “Esri News for Water Utilities and Water Resources“
Learn more about how GIS supports digital transformation.