Customer Spotlight Story
High West Energy Cooperative (HWE) is a member-owned electric cooperative serving parts of Wyoming, Nebraska, and Colorado, spanning approximately 3,500 miles of line and over 10,000 member meters, with an average of about 2.6 members per mile. The service territory is vast, covering approximately 4,200 square miles.
The co-op’s mission is centered on three core priorities: providing reliable service, treating its members fairly, and keeping costs as reasonable as possible. In practice, this means HWE invests in tools and services that help members monitor and manage usage. An example of a member service is its online account portal and SmartHub app, which allows members to manage their electric accounts and usage on desktops, tablets, or smartphones.
HWE has a long history of utilizing GIS for mapping and distribution staking (design).
CHALLENGE
Given the expansive service territory and the large number of medium-to low-voltage substations, the inspection and maintenance of critical equipment have been ongoing issues. A lack of cell service in remote areas adds an extra challenge to identifying and correcting substation problems. HWE had taken a few steps to automate information capture, with limited success. However, the company realized its efforts could be improved.
HWE maintains a mapping database of its 45 substations, with limited data per point. The problem was keeping that data up to date and reporting on the current status. A lack of communication and connectivity hindered real-time updating. In addition, the lack of data jeopardized the ability to keep substations operational. Data Inspection and maintenance activities for substation equipment were maintained in spreadsheets for each substation. Rather than working directly on the spreadsheet, users created images of the spreadsheets. Users in the field marked up these images using a stylus on their iPads and then uploaded the updated information to the same database as the substation data. However, the lack of actual data made it challenging to compare past and present metrics, and manually reviewing these images to establish benchmarks proved impractical.
“When we switched over to ArcGIS, it was a night and day difference. I was impressed with the new process when it came to the ease and ability to make quick and accurate surveys.” Hunter Garoutte, Lineman, High West Energy.
SOLUTION
After testing ArcGIS Survey123 in collaboration with a cooperative GIS group in one of the serviced counties, the experience helped guide the development of a similar approach for capturing data from substations. The workflow now incorporates ArcGIS Survey123, ArcGIS Field Maps, ArcGIS Dashboards, and each of their respective reporting tools.
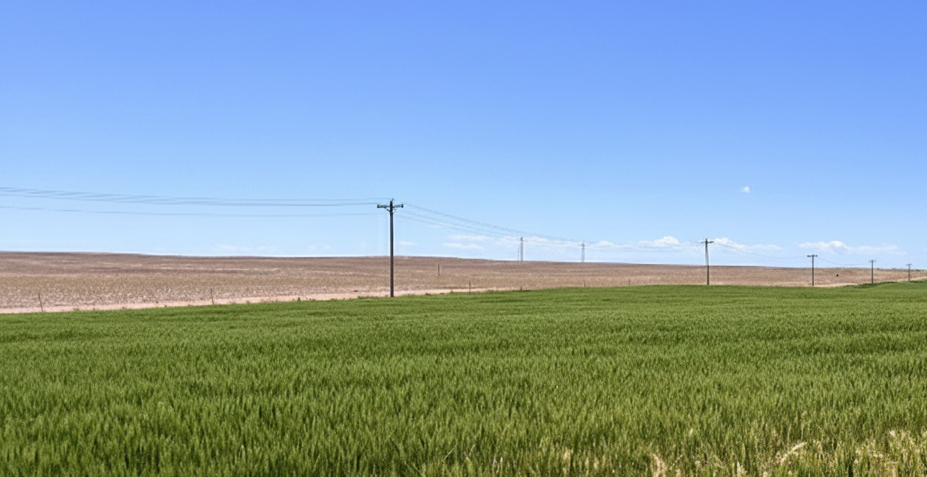
Remote areas of the service territory creates additional challenges.
Field crews visit each substation and capture the required information using ArcGIS Survey123 as the standardized data-collection form. Once a submission is made, ArcGIS Field Maps immediately displays only the substations flagged as needing attention. This creates an instant feedback loop—issues become visible in the ArcGIS Field Maps application as soon as ArcGIS Survey123 data is submitted, eliminating the need to search through older records for comparison.
The current setup includes a single mapping server and ten desktop stations. This configuration supports detailed system mapping to improve understanding of the facilities and enables efficient data sharing with other organizations.
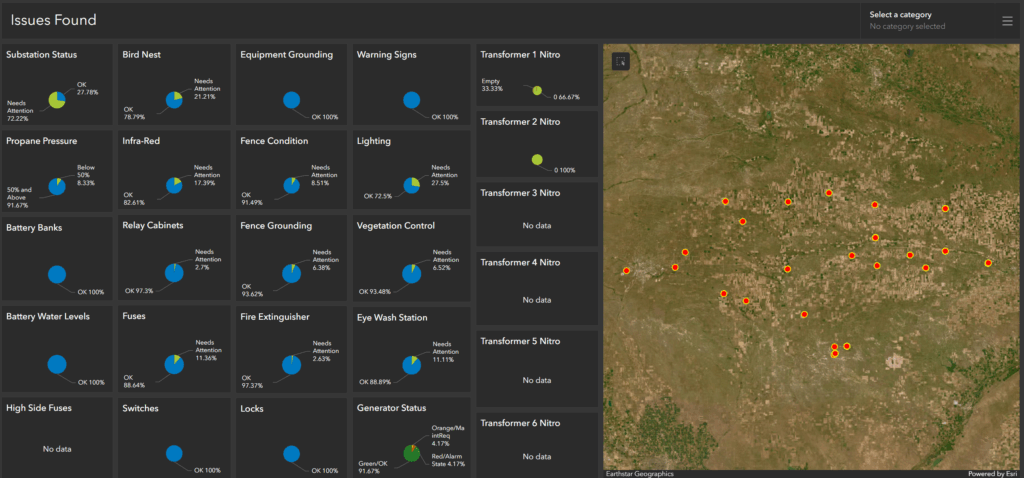
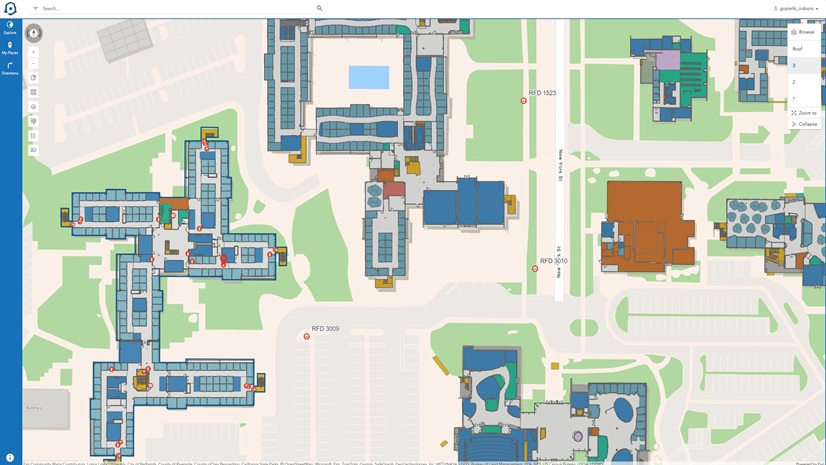
Dashboard viewing where issues are located.
RESULT
ArcGIS Survey123 was used as the primary form for collecting information at each substation. One of the main challenges was that substations are not built the same, so the user must first select the specific substation they are inspecting. This selection determines which fields become active and relevant. The spreadsheet form was designed around the largest substations in the system—those that might include, for example, 15 oil circuit reclosers (OCR), 5 transformers, 12 regulators, and other equipment. Once the appropriate logic was established in the relevant sections, the form could automatically adjust; for example, one substation might display fields for a single transformer. At the same time, another might display fields for five, ensuring only applicable inputs are visible.
This approach also supported the inclusion of OCRs located outside the substation fence, allowing them to be inspected during the same visit. All substations retained consistent sections, such as “Passed/Needs Attention,” for attributes like fencing, lighting, grounding, locks, and similar items. In contrast, specialized items—such as high-side fuses or generators—appeared only where applicable. When a user marked an item as needing attention, a comment field automatically came into focus to capture the reason for the attention. Additional comments and up to six optional images could be attached as supporting documentation.
For transformers, breakers, OCRs, and switches, numbering was carried through to ensure that the user captured data for the correct device within each group. Checks such as propane levels above or below 50% and battery water levels were also integrated. The workflow within each substation was arranged from left to right to avoid unnecessary back-and-forth navigation. Regulator sections included directional labeling—such as West, Center, East, or North, Center, South—so all reports followed a consistent naming and orientation pattern.
Once a form was submitted through ArcGIS Survey123, field technicians used ArcGIS Field Maps to identify which substations needed attention. Only substations with flagged issues appeared as highlighted, eliminating the need to sift through long, comprehensive forms. When the technician resolved an issue, they could select “Fixed” and add a comment, after which the substation automatically disappeared from the ArcGIS Field Maps display.
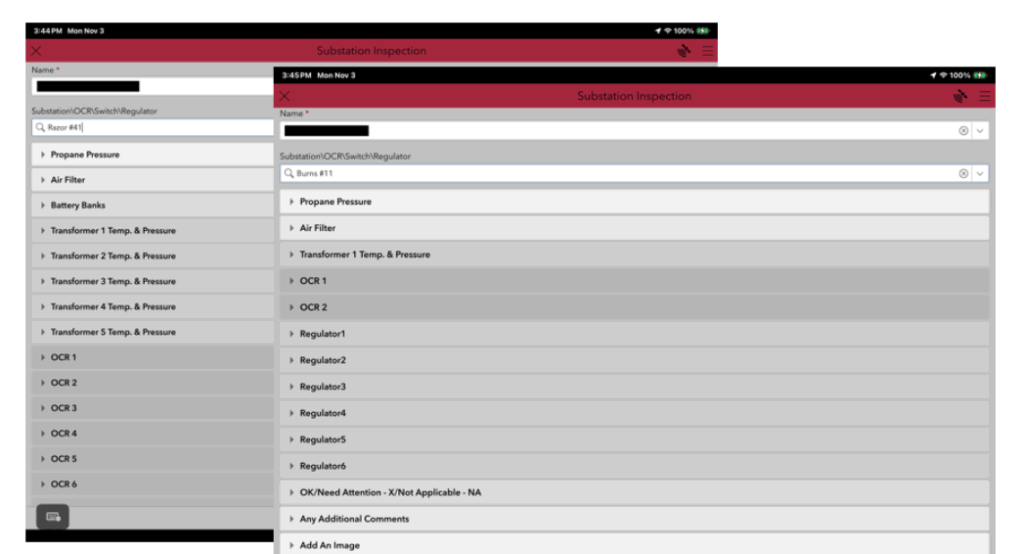
ArcGIS Survey 123 forms tailored for each unique substation.
“The biggest achievement of this project was having a simple program with presets for each substation to complete inspections. It made our work easier and faster to complete and still retained the information that we needed to collect .” Max Childers, Lineman, High West Energy.
BENEFIT
Many of the responses indicated that the new approach was significantly faster and cleaner. Line crews rotate through the application each month, and the ongoing feedback has been valuable in identifying which features to add and which elements are unnecessary, helping the process run smoothly. There were no difficulties in getting crews up to speed with the application.
Several options were evaluated, and the available staff expertise enabled the use of this software to create a solution tailored to HWE’s needs. Strategic planning continues to benefit both employees and members, and the results demonstrate what can be achieved when working collaboratively with strong industry partners such as Esri.
This solution is not tied to any specific workflow; instead, the focus is on ensuring that the system receives all necessary maintenance to continue operating reliably for members. Maintaining a safe and orderly environment for line workers—and ensuring proper protection of the public—also requires clear records showing that all required inspections and maintenance are being carried out.
The fast interaction between the two products, even when operating offline, has been seamless. Immediate visibility into items requiring attention has dramatically improved response time compared to previous methods.
Above all, this approach has saved considerable time by eliminating the need to sift through images or data to determine the location and nature of a problem. It also provides insight into why certain areas or items are repeatedly flagged, allowing for a precise focus on recurring issues rather than sending someone out to investigate them repeatedly.
NEXT STEPS
There are clear advantages to using ArcGIS Survey123, ArcGIS Field Maps, ArcGIS Dashboards, and their reports within a utility environment. The same framework can support transformer inspections across the entire system, storm-related damage assessments from initial impact through final cleanup, breaker counts, UAV inspections, pole inspections, CT meter inspections, and even EV-related evaluations. The software is well-suited for a wide range of operational scenarios.
As additional data is collected, ongoing refinement of the dashboards and reporting tools will strengthen the overall insight and value these applications provide.
”For me, the single biggest part of integrating this into our substation checks was the ability to back-reference. I now have the ability at my fingertips to look back and compare recordings and field-documented findings. Giving the ability to plan and reference from the office and the field.”– Josh Murkin, Substation, SCADA and Relay Technician.