Exploration moves fast. New data shows up daily. Targets evolve weekly. Decisions need to be made with confidence, not guesswork.
But when GIS is treated like a pile of maps instead of a system, it starts to feel like a renovation in progress. Tools everywhere. Versions everywhere. No clear idea which layer is current.
A better way to think about exploration GIS is this.
Build it like a house.
Strong exploration programs do not emerge by accident. They are built deliberately, from foundation to finish, so decisions are repeatable, scalable, and defensible.
Here is a practical framework I see working across high-performing exploration teams.
1. Pour the Foundation: Build the Exploration Basemap and Data Library
Every exploration program needs a single source of truth before anything else can scale. When core layers live in multiple folders and coordinate systems, teams spend more time reconciling data than interpreting it.
Start by standing up a project geodatabase or web GIS with consistent schema, metadata, coordinate systems, and versioning. Then publish core layers so everyone is working from the same foundation.
Recommended ArcGIS capabilities
- ArcGIS Pro (data modeling, QC, editing, cartography)
- Geodatabase (file or enterprise) with domains/subtypes and a versioning strategy
- ArcGIS Enterprise or ArcGIS Online (authoritative web layers, sharing, permissions)
- Metadata + standardized symbology and templates
2. Set the Property Lines and Building Codes: Tenure, Permitting, and Constraints
Before you build, you check the lot boundaries and the code requirements. Exploration is the same: you want to understand constraints early, before you invest time and money in a target that is difficult to permit or operate.
Overlay mineral rights/claims with environmental, cultural heritage, land ownership, and regulatory boundaries, then produce constraint heatmaps and “go/no-go” areas for target triage and stakeholder reporting.

Recommended ArcGIS capabilities
- ArcGIS Pro (overlay, buffering, suitability-style analysis)
- ArcGIS Dashboards (constraint summaries by claim, area, or target)
- Experience Builder (constraint viewer for non-GIS audiences)
- ArcGIS Enterprise/Online (controlled sharing and permissions)
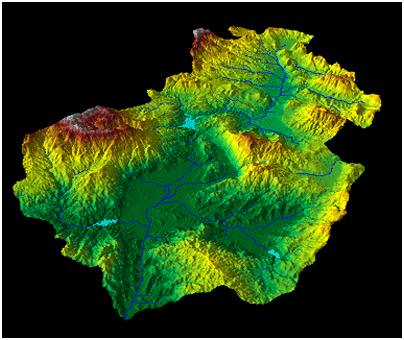
3. Draft the Blueprint: Prospectivity
A blueprint is where you pull everything together and decide how the house is going to be built. Prospectivity is your exploration blueprint: a transparent, repeatable way to combine evidence and decide where to focus next.
Combine lithology, structure, alteration, geochemistry, and geophysics into weighted models, then output ranked targets with uncertainty notes to guide infill and follow-up.
Recommended ArcGIS capabilities
- ArcGIS Pro (raster + vector modeling, geoprocessing)
- ArcGIS Image Analyst (for heavy raster workflows)
- ModelBuilder or ArcGIS Notebooks (repeatable runs + documentation)
4. Quality-Check the Materials: Geochemistry QA/QC and Anomaly Mapping
Before you build anything permanent, you check your materials. You do not want to discover later that your lumber was warped. In exploration, geochemistry QA/QC is the inspection step; it is how you ensure your assay data are trustworthy before you use them for targeting.
Geochem is the same. Before you use assays to drive targeting, you want to know the data is clean enough to trust.
Start with basics: sample IDs, locations, methods, detection limits, lab batches. Then review QA/QC controls like standards, blanks, and duplicates so you can flag suspect batches quickly. After that, map anomalies. Do it by element and by sample media, and build multi-element indices that match your deposit model.
Recommended ArcGIS capabilities
- ArcGIS Pro (joins, related tables, QC checks, anomaly surfaces and mapping)
- Attribute rules / domains (enforce valid fields and reduce bad entries)
- ArcGIS Notebooks (automate QA/QC summaries and threshold calculations)
- Spatial Analyst / raster workflows (optional, for continuous anomaly surfaces)
- Hydrology tools (watershed and catchment delineation)
- ArcGIS Dashboards (QA/QC and turnaround tracking for the team)
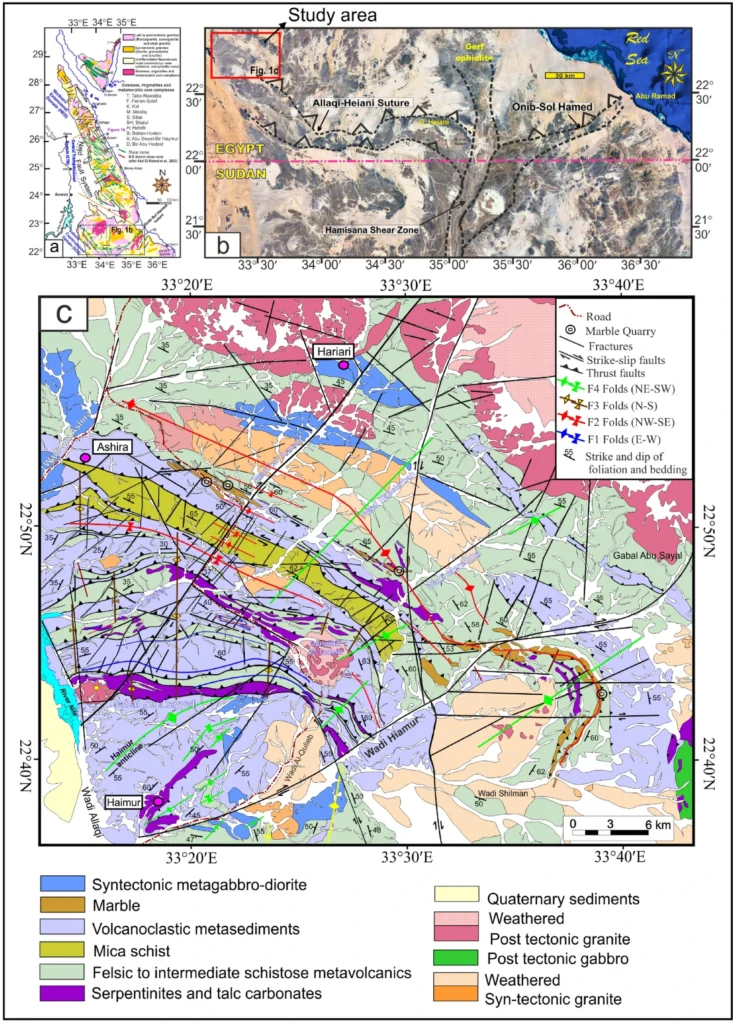
5. Put Up the Framing: Geophysics Integration and Interpretation
Once the foundation is in, framing is what gives a house its shape. Geophysics plays a similar role. It gives you the structure you can interpret against. But the key is how you manage it.
Organize your surveys as a clean library: footprints, flight lines if you have them, grids, and derived products like magnetics, radiometrics, and EM. Keep the source info attached so anyone can answer what survey they are looking at and how it was processed.
Recommended ArcGIS capabilities
- ArcGIS Pro (raster management, mosaics, visualization, digitizing, editing)
- Mosaic datasets or an imagery management pattern (for multiple grids and products)
- Interpretation schema fields (Interpreter, Date, SourceSurvey, Method, Confidence)
- ArcGIS Enterprise or ArcGIS Online (publish interpretation layers for review and field use)
- ArcGIS Dashboards (optional for interpretation progress, areas reviewed, and change tracking)
6. Install the Windows: Remote Sensing and Alteration Mapping
Windows let you see what’s going on without walking the whole property. Remote sensing does the same. It gives you a fast way to spot patterns and guide field time where it matters.
Use multispectral or hyperspectral imagery and DEM derivatives to map alteration and surface indicators. If you are working across time, bring in change detection and surface disturbance mapping for planning and reporting.
Recommended ArcGIS capabilities
- ArcGIS Pro raster functions (indices, band ratios, DEM derivatives)
- ArcGIS Image Server / enterprise imagery pattern (scale processing + serving)
- Time-aware imagery layers (change tracking)
- Publish field-ready layers as web maps
7. Add the Structural Engineering: Structural Analysis and Target Geometry
A house can look fine until you realize the load path was wrong. Structural engineering is what makes it hold up. In exploration, structural analysis is how you turn “structure matters here” into something you can map and test.
Build a structural layer set you can trust: mapped faults, lineaments, shear zones, fold axes, contacts, plus interpreted structures from geophysics and imagery. Then quantify the things you usually eyeball. Distance to major structures, intersection zones, lineament density, corridors that match your deposit model.
Recommended ArcGIS capabilities
- ArcGIS Pro (proximity tools, buffer, intersect, spatial join, density tools)
- Geoprocessing models or ArcGIS Notebooks (to make the workflow repeatable)
- Transparent target attributes (DepositModel, Parameters, Confidence, SourceData, Notes)
- ArcGIS Enterprise or ArcGIS Online (publish targets and structural layers for shared review)
- Optional 3D workflows (if you need to integrate surface structure with subsurface context)
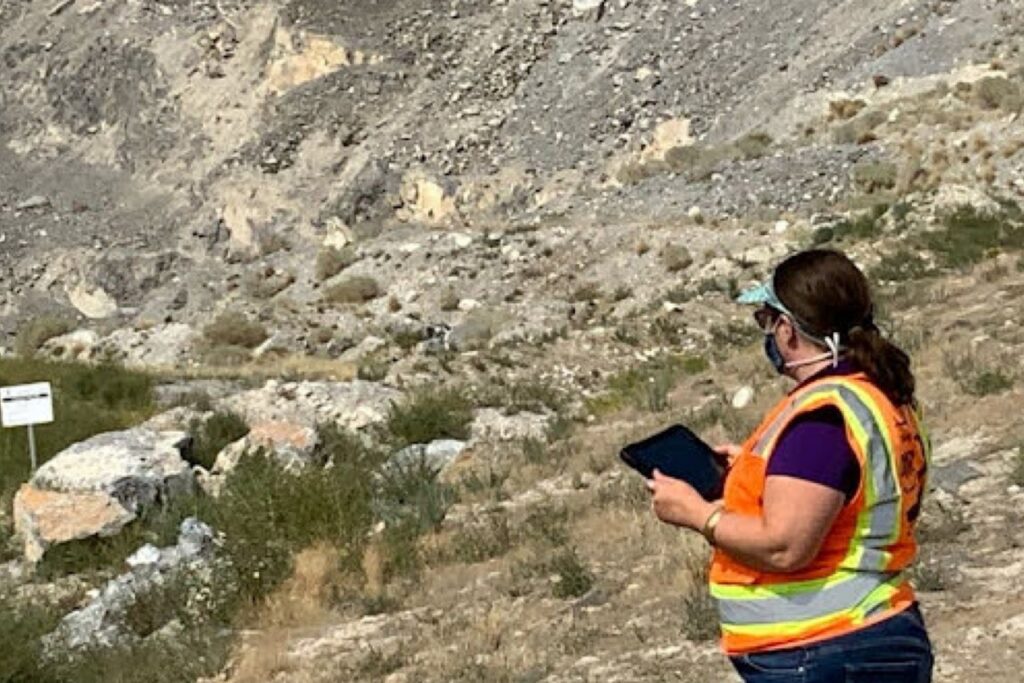
8. Run the Plumbing and Electrical: Field Planning and Mobile Data Capture
A house is only functional when the utilities are in: plumbing, electrical, and connections you can rely on. In exploration, that “utility layer” is your field-to-office workflow. It is what keeps observations consistent and data flowing daily.
Plan field visits, sample sites, and access routes; load offline maps for no-service areas. Use mobile forms for consistent capture of samples, outcrops, structural measurements, photos, and observations. Sync to dashboards so the team can course-correct mid-program.
Recommended ArcGIS capabilities
- ArcGIS Field Maps (offline maps, navigation, simple capture)
- Survey123 (structured forms, photos, standardized fields)
- ArcGIS Dashboards (daily progress, coverage gaps, plan vs actual)
- Optional tasking pattern (assignments, accountability, completion tracking)
9. Do the Walkthrough: Drill Targeting and Program Execution Dashboards
Before you hand over the keys, you do a walkthrough. What’s done, what’s delayed, what needs rework. Drilling deserves that same visibility, because this is where the budget really moves.
Turn ranked targets into drill-ready collar proposals with constraints and risk flags. Track meters, assay turnaround, intervals, QA/QC status, and decisions by target.
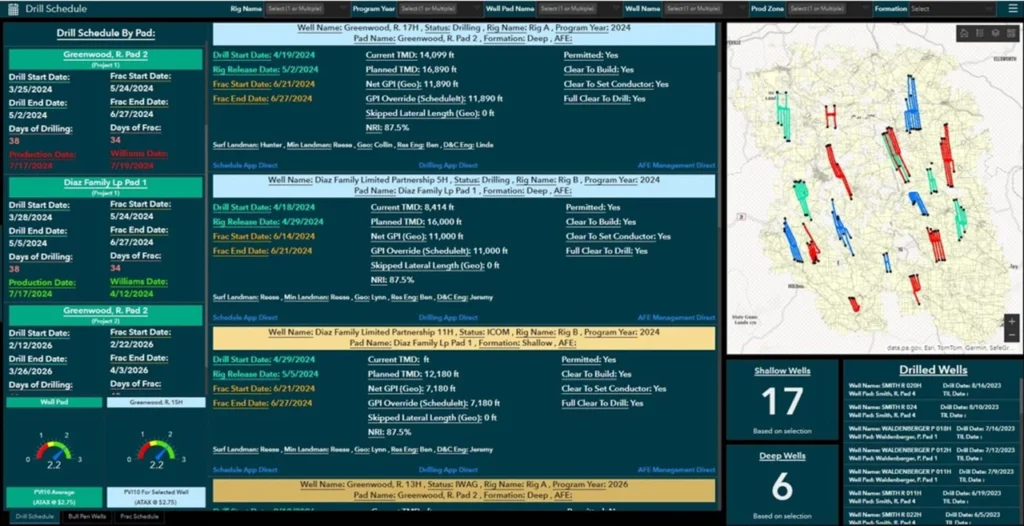
Recommended ArcGIS capabilities
- ArcGIS Pro (collar planning, constraint checks, drill package map series)
- ArcGIS Dashboards (meters, turnaround, QA/QC, decisions by target)
- Hosted feature layers (collars, pads, intervals, status fields)
- Optional alerts pattern (flag turnaround delays or QA/QC failures)
10. Hand Over the Keys: Reporting and Knowledge Handover
A house is not really “done” if the next person cannot live in it. They need the keys, sure, but they also need the owner’s manual. In exploration, that owner’s manual is knowledge transfer. Not just final maps and a technical report, but the context that explains what you did, why you did it, and what you learned along the way.
This is where ArcGIS StoryMaps shines. A StoryMap lets you package the season into a narrative that people actually read. It can pull in web maps, dashboards, photos, figures, cross sections, and short text explanations in one place. That means your geologists, GIS team, leadership, and the next field crew are all looking at the same story, not digging through a folder of PDFs trying to reconstruct decisions.
Think of it as the walk-through plus the binder.
Use a StoryMap to document:
- Project overview: the area, deposit model, and program goals
- Data sources and confidence: what datasets were used, what changed, what is uncertain
- Key interpretations: structural framework, alteration patterns, geophysics interpretation layers
- Results that matter: anomaly maps, ranked targets, drill results summaries
- Decision points: why targets were advanced, paused, or dropped
- Next steps: recommended follow-up work and what to watch for next season
The best part is that StoryMaps are easy to keep current during the season, not just after it. A quick weekly update can become your end-of-season handover with almost no extra effort.
Recommended ArcGIS capabilities
- ArcGIS StoryMaps (the narrative and knowledge transfer hub)
- Web maps and web layers (authoritative layers referenced directly in the StoryMap)
- ArcGIS Dashboards (program status snapshots embedded in context)
- ArcGIS Pro (final cartography, map series exports when needed)
If there’s one takeaway here, it’s this: a strong exploration GIS program gets built, not improvised.
When you start with a real foundation, meaning an authoritative basemap and data library, everything that follows holds up better. Constraint screening stops becoming a frantic layer hunt. Prospectivity becomes repeatable instead of mysterious. Field data comes back clean because you designed the capture, not because you got lucky. And when it’s time to plan drilling, your “collar proposals” are not just dots on a map. They’re location decisions with context, constraints, and a clear reason they exist.
Want to discuss your exploration needs further? Contact Esri Mining here: https://www.esri.com/en-us/industries/mining/overview#start