In emergency management, information is rarely scarce, but clarity often is. Data streams pour in from weather services, transportation systems, utilities, incident management systems, partner agencies, and countless public-facing sources. The challenge isn’t collecting information; it’s turning that firehose of information into something that leaders, operators, planners, responders, and partners can quickly understand and act on.
That challenge is exactly what the Missouri State Emergency Management Agency (SEMA) set out to address with its new situational awareness report and live daily brief. What began as an effort to automate an existing manual process has evolved into a powerful example of how thoughtful geographic information system (GIS) design, automation, and user-centered thinking can dramatically improve operational efficiency.
I recently sat down with Missouri SEMA’s Lucius Creamer, GIS specialist; Jessica Sexton, deputy preparedness division manager; and Sebastian Gely, deputy response division manager, to discuss how this solution came together, what problems it solved, and where they’re headed next. Their story offers valuable lessons for emergency managers and GIS professionals alike.
The Problem Wasn’t New, But the Opportunity Was
Missouri SEMA staff didn’t set out to reinvent situational awareness. Like many agencies, they already had a daily situational report process in place before modernizing their approach. The daily brief, traditionally distributed as a PDF via email each morning, had been produced for years and served an important role as a snapshot in time.
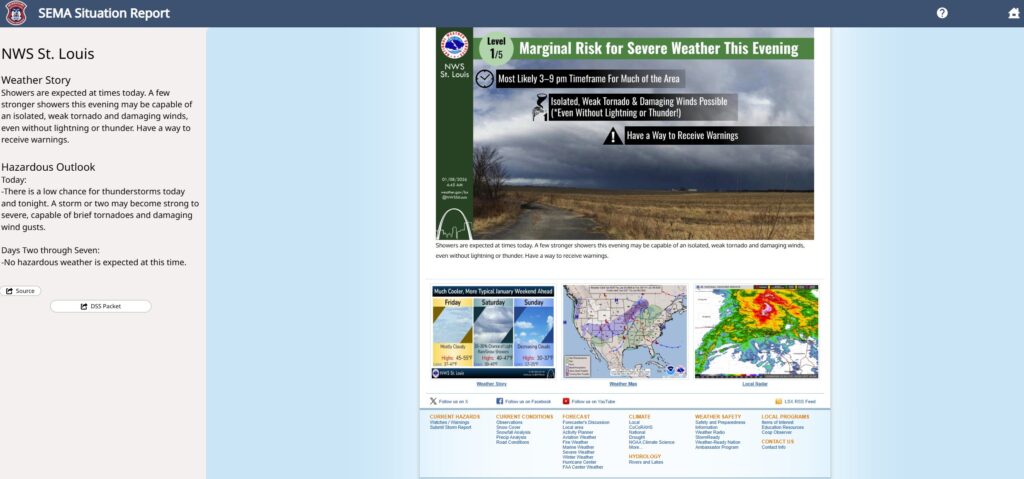
But behind the scenes, producing that brief was time-consuming and a lengthy, manual process. Staff pulled data from a wide range of sources: the National Weather Service; Missouri SEMA’s incident management system; transportation maps; storm prediction centers; and more. Each map and dataset lived in a different place; looked different; and required manual effort to compile, analyze, and coalesce.
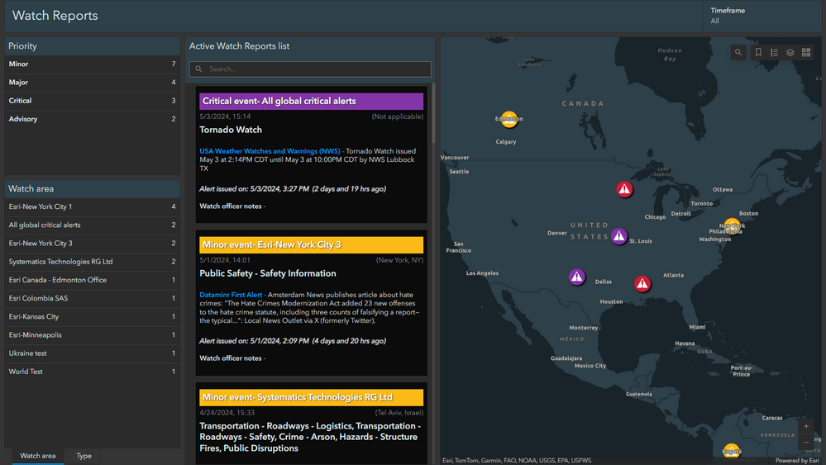
As Creamer explained, the challenge was consolidation and digestibility: “Our priority was to be able to display data in a digestible format—especially for people who aren’t deeply embedded in emergency management.”
In the Missouri SEMA watch center and state emergency operations center (SEOC), where staff juggle countless tasks at once, the need was clear: They needed a single, reliable place to see the most critical information quickly and clearly, without hunting across systems.
A Shift from Static Snapshots to Live Situational Awareness
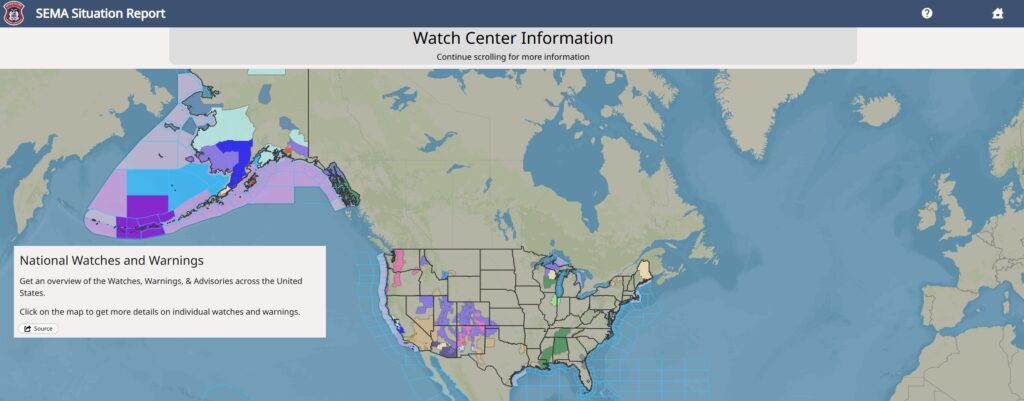
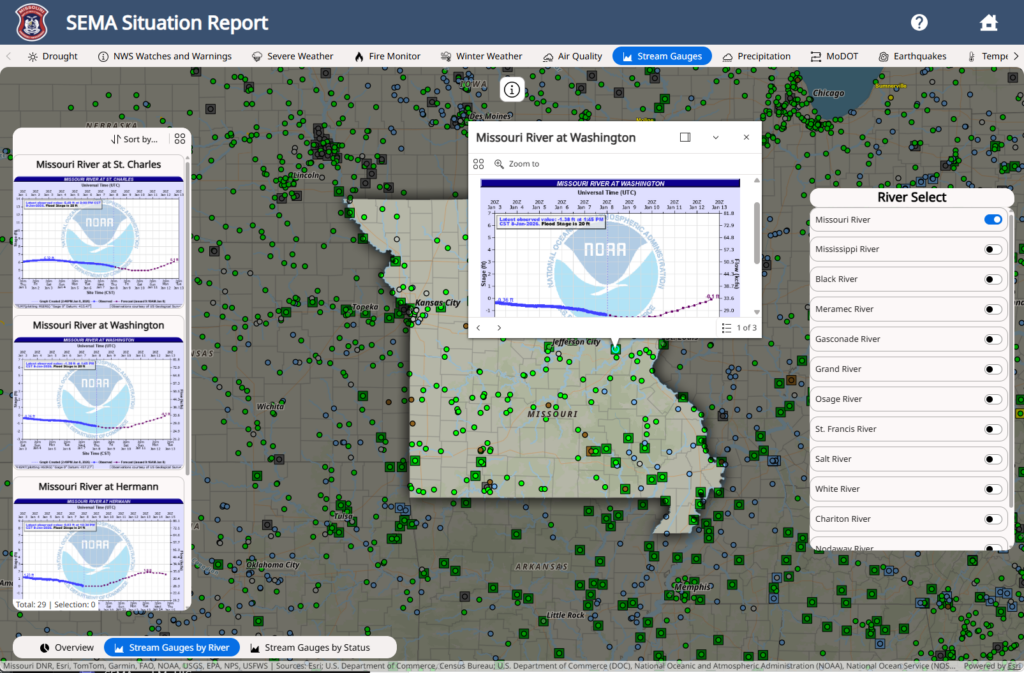
One of the most significant changes Missouri SEMA introduced was the move from a purely static daily brief to a live, web-based situational awareness report.
The traditional PDF still exists, and intentionally so, as it remains a vital historical record, documenting what leadership knew at a specific moment and why certain decisions were made. Those records are essential for after-action reports, recovery documentation, and federal disaster declarations.
But what’s new is the live experience.
The new situational awareness report represents an up-to-the-minute version of what the daily brief PDF captures in snapshot form. And instead of waiting for the next morning’s PDF to understand what’s happening in the state, Missouri SEMA leadership and partners can now access current conditions at any time.
The impact has been immediate.
“It’s a massive improvement,” said Gely, whose watch center team was responsible for the formerly tedious, manual process.
What once took 30–45 minutes to manually assemble each morning now requires only a click, with much of the heavy lifting handled automatically. Maps are pre-generated, standardized, timestamped, and ready to drop into the final product. “Because it was so complicated and cumbersome, there were only a handful of people who could do the daily sitrep,” Gely said. “The updated sitrep has not only streamlined the whole process, but it has also been a force multiplier in terms of our ability to expand our base of staff that can put it together.”
Designed for the Way Emergencies Actually Happen
Missouri SEMA’s revamped situational awareness report was intentionally designed for real-world emergency conditions (rather than ideal ones) in which operators and responders aren’t sitting in an emergency operations center with high-bandwidth internet and large monitors. They’re often accessing information on mobile devices, sometimes in rural areas where connectivity is unreliable.
That reality shaped every design decision.
Instead of exposing users to long lists of layers and complex controls, the report uses simple buttons that automatically turn the appropriate layers on and off. This reduces confusion; speeds up load times; and ensures that users see what they need, without accidentally hiding critical data.
Load performance, accessibility, and clarity weren’t afterthoughts; they were priorities.
That philosophy extends beyond the tool itself. Missouri SEMA intentionally kept the PDF-based workflow in place, recognizing that PDFs are lightweight, universally accessible, and resilient when technology fails.
Automation That Still Keeps Humans in the Loop
Behind the scenes, the solution is anything but simple.
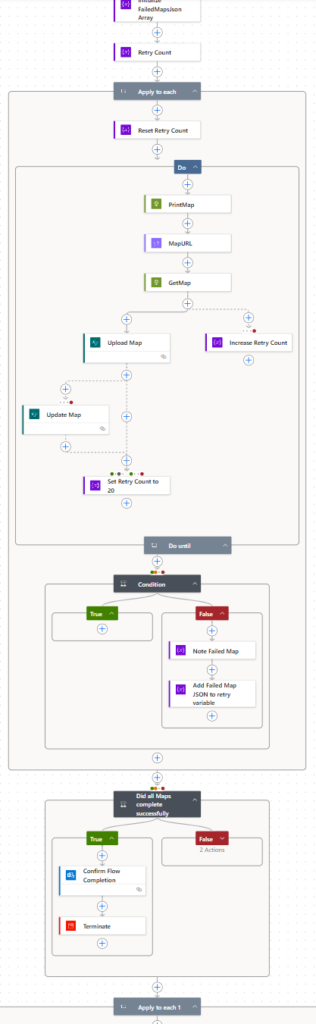
Missouri SEMA uses a combination of ArcGIS Enterprise, custom print services, APIs, and Microsoft Power Automate to generate daily maps automatically. Each map is defined by a detailed code that instructs the system exactly how to render it—the extent, layers, symbology, and even placement of the time stamp.
Every morning, scheduled automation runs through this process; exports standardized maps; and uploads them directly to SharePoint, where they’re already linked into the PowerPoint slide that’s used to produce the PDF daily brief.
The result? Staff open the file and the maps are already there, updated, consistent, and ready for review.
But just as important as automation is reliability.
Creamer was candid about the need to design for failure, saying, “Automation and scripts break. That’s just reality.”
To address this, every automated process includes robust retry handling and, most importantly, a human validation step. If automation fails, staff can still complete the process manually. No single script or service is a single point of failure.
It’s a lesson worth repeating: Automation should accelerate people, not replace resilience.
Fewer Missed Details, Fewer Ringing Phones
The benefits of the new system go well beyond time savings.
By consolidating disparate data sources into one standardized view, Missouri SEMA has reduced the likelihood that critical information slips through the cracks, especially during shift changes or fast-moving events.
And leadership feedback has been overwhelmingly positive. “This helps our phones not ring,” said Gely. When information is easy to find, leaders don’t need to call staff for updates. When partners can have the same situational awareness, fewer clarification emails and phone calls are needed.
That quiet efficiency is often the clearest sign that a system is working.
Planning for What’s Next—and Everything Else
Looking ahead, Missouri SEMA’s GIS ambitions aren’t slowing down.
With international sporting events coming to the region in summer 2026, the team is already planning how to adapt its situational awareness tools to support a complex, multiagency environment without losing the ability to see hazards such as tornadoes and flooding.
The likely approach? Parallel or so-called cloned GIS tools, like Missouri SEMA’s current situational awareness report, will allow event-specific information to exist alongside—but not overwhelm—traditional emergency data.
At the same time, the agency’s planning section is working to automate additional executive-level reports for use during activations, extending the same efficiency gains beyond the daily brief.
“Pulling report information during a planning cycle in the SEOC from multiple data sources, including online dashboards and staff, is time-consuming,” said Sexton. “If we can make reporting from the planning section for leadership increasingly streamlined and actionable, then we’re accomplishing our goals.”
On the technical side, Creamer is also building historical GIS datasets from live feeds and scraped sources, creating internal data catalogs that reduce reliance on costly third-party vendors and preserve valuable historical context.
Interested in learning more or exploring similar approaches? This is just one example of how GIS continues to reshape emergency management, one thoughtfully designed dashboard at a time.
Check out Esri’s Emergency and Disaster Management web page for more case studies and GIS-inspiration.