At the City of Carrollton, Texas, geographic information system (GIS) technology isn’t sitting on the sidelines waiting for an emergency to happen. It is helping the city understand risk before an incident, identify who and what may be affected as conditions change, document impacts in the field, coordinate recovery efforts, and give leaders the information they need to make decisions.
That shift is happening because the City of Carrollton is treating location intelligence not only as a mapping capability but also as an organizing framework for emergency management.
Using ArcGIS, the city has built a growing collection of operational tools that bring critical information—on hazards, outages, infrastructure, weather, damage, debris, donations, and more—into dashboards and workflows that staff, leadership, elected officials, residents, and regional partners can understand and act on.
By applying ArcGIS across the emergency management life cycle, the City of Carrollton is moving away from static information and manual processes and toward living systems that help decision-makers understand what is happening, where it is happening, who is affected, and what needs to happen next.
“The ultimate goal of our GIS capability is to provide immediate help to decision-makers, which also includes residents as they focus on personal preparedness,” said Juan-Carlos Torres, GIS manager. “Anyone can grab a phone, a tablet, or a computer, and they can collect data, share it with the emergency operations center, see a summary of the data, and have it all in real time.”
That vision was shaped by experience.
Past events exposed the limitations of paper-based data collection, disconnected information, and delayed reporting, particularly when the city needed to understand impacts, communicate with leadership, and document information necessary to pursue assistance.
The city’s response was not to build one massive system all at once. Instead, the city has tackled individual operational challenges and connected the solutions over time.
The result is a portfolio of capabilities that spans the entire emergency management life cycle: helping residents understand hazards and prioritizing wellness checks during power outages; monitoring critical infrastructure; connecting weather to city services; documenting damage and debris; organizing donations; and sharing information with regional partners.
Each tool addresses a specific problem. Together, these tools are changing how emergency management operates.
Making Risk Visible Before an Emergency
Hazard Vulnerability Analysis Helps Residents See What’s Around Them
Emergency management begins long before the emergency.
For the City of Carrollton, part of that work is helping residents understand the hazards that may exist in and around their communities.
The city’s Hazard Vulnerability Analysis Map Tool provides a publicly accessible way to do exactly that. Built with ArcGIS Pro, ArcGIS Dashboards, web maps, and ArcGIS Arcade, the application brings together information such as the locations of Tier II chemicals, pipelines, Federal Emergency Management Agency (FEMA) flood zones, railroads, roadways, and other potential hazards.
Residents can search for an address and see a summary of hazards within a specified distance. Instead of asking residents to interpret layers of technical information, the application translates that data into something much more practical: information on what is nearby, and what residents should know about it.
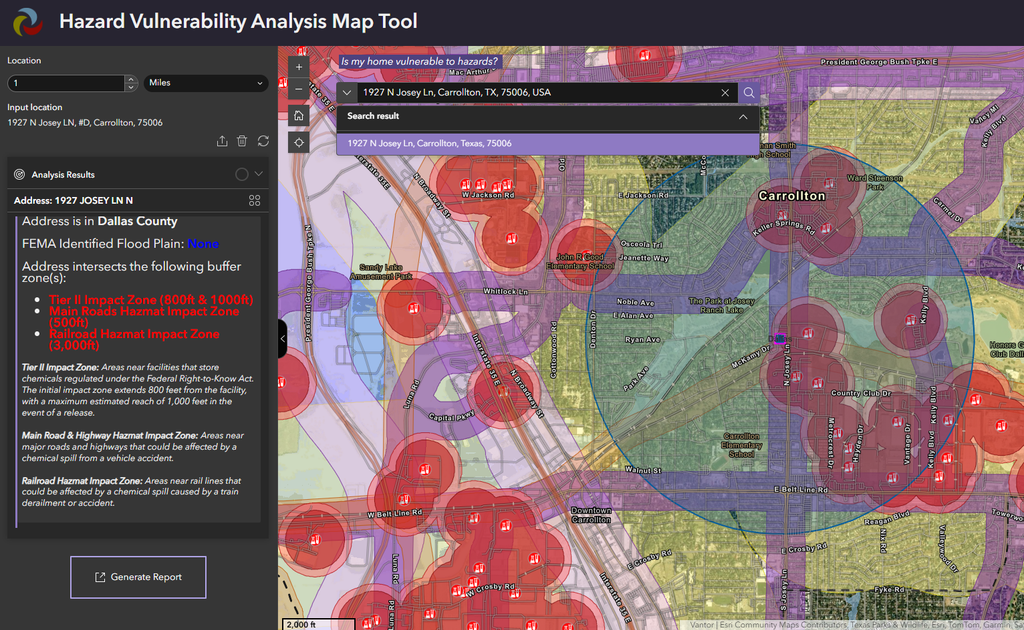
For Skyla Segel, GIS analyst for the City of Carrollton, the work is ultimately about people, not technology.
“The Hazard Vulnerability Analysis analyzes hazards for our citizens within the city to search and see what they need to be aware of so they can be better prepared,” Segel said.
The concept also demonstrates something important about emergency management: Hazards rarely respect jurisdictional boundaries.
The City of Carrollton shared the concept with its neighboring communities in the Dallas–Fort Worth area where, Torres said, the emergency management leaders recognized the potential for a shared view of hazards across jurisdictions.
“At the end of the day, it’s emergency management,” Torres said. “If something happens at one of our Tier II chemical locations, it doesn’t just affect the city of Carrollton; it will affect all the nearby cities.”
The next step is to create a more collaborative emergency management dashboard that would allow neighboring communities to contribute and share information.
In other words, a local hazard map has become the starting point for regional situational awareness.
Turning Outage Data into Action
STEAR Dashboard Helps the City Prioritize Vulnerable Residents
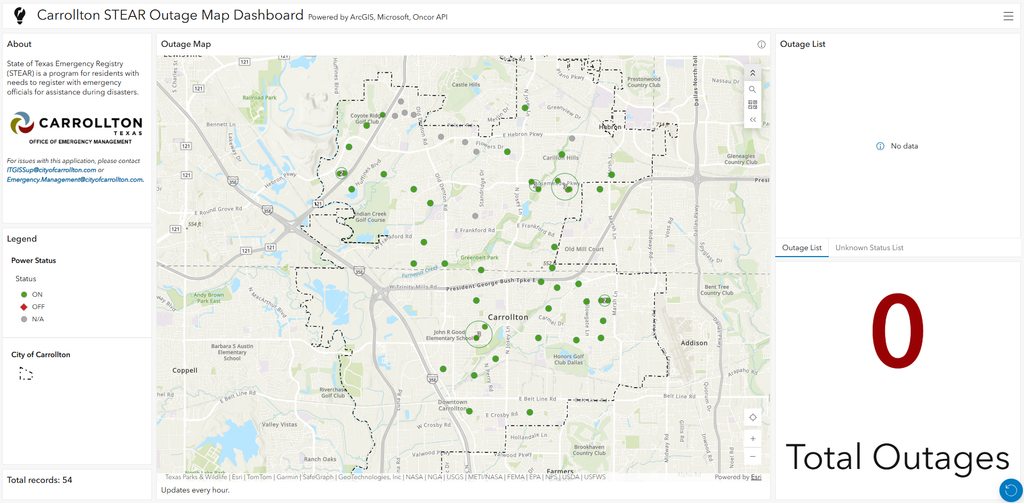
The city’s Hazard Vulnerability Analysis Map Tool helps people understand risk before an incident. Its outage-monitoring capabilities help the city act when conditions change.
One of the most impactful examples is the city’s STEAR power outage dashboard and alert system, based on the State of Texas Emergency Assistance Registry, or STEAR. The registry includes the names and locations of residents who may require additional assistance during emergencies.
For the City of Carrollton, knowing that a resident may need assistance is only part of the equation. The city also needs to know when an emergency condition could affect that resident.
Previously, emergency management staff had to manually check the power status of each registrant individually. With approximately 75 STEAR registrants in Carrollton, that process was tedious and time-consuming.
Now, the city uses STEAR and utility outage data, SharePoint, Excel, Power Automate, and ArcGIS to automate the process. The system checks power status, updates the dashboard, and triggers email notifications to emergency management staff when an outage may affect a vulnerable resident.
“This solution has saved hours and hours of work,” Segel said. “We used to have to go through each registrant one by one, search their location, and check if that power status is on or off. This new solution is instantaneous, and it’s constantly running every hour.”
More importantly, the automation has translated directly into faster action. Segel described a situation in which a resident who relied on electricity because of a disability lost power. The city’s notification system alerted emergency management, allowing staff to check on the resident and coordinate follow-up.
“We actually knew of the power outage before the data provider knew,” Segel said. “Because of our automations, [the system] allowed us to act on it really quickly.”
That is the difference between having data and having an operational capability. The information wasn’t simply available—it was working for the emergency management team.
One View of the Infrastructure Residents Depend On
Critical Infrastructure Dashboard Connects Facilities and Outage Information
The same question that drives the STEAR dashboard—Who is affected, and who needs help first?—also applies to the facilities and services a community depends on.
The City of Carrollton extended its outage-monitoring approach to critical infrastructure. This brought schools, hospitals, shelters, nursing homes, fire stations, and other essential facilities into a single operational view. Users can filter facilities by type, review statistics, export information, and see outage status where utility data is available.
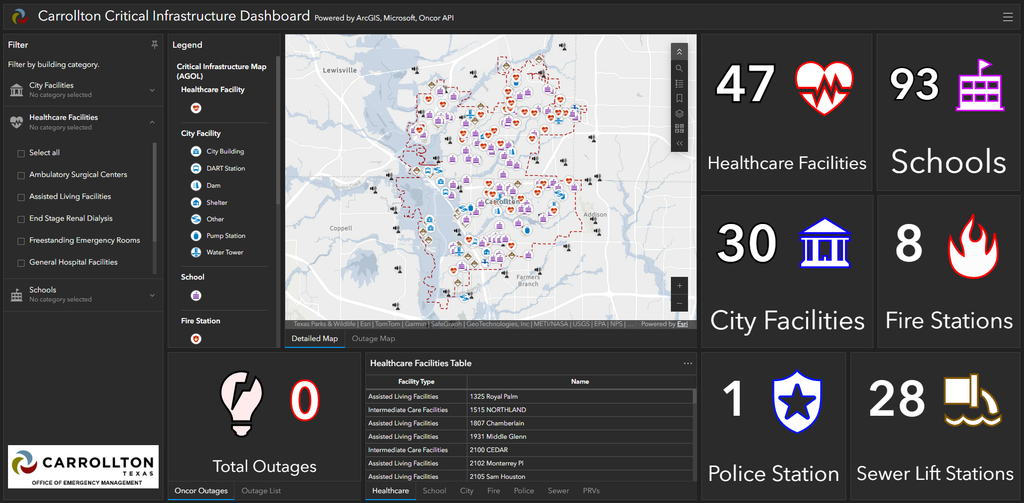
The city also incorporated the same automated outage-monitoring approach used for STEAR. And the value goes beyond knowing whether a facility has power.
Where floor plans are available, staff can access them directly through map pop-ups, giving emergency personnel faster access to basic building information. The city hopes to explore indoor mapping in the future, but even the current capability demonstrates how GIS can connect operational information to the physical places where responders may need to work.
The result is a more complete picture of infrastructure risk—one that combines what the facility is, where it is, what is happening there, and what responders may need to know.
Connecting Weather to the Services People Depend On
NOAA Live Storm Dashboard Puts Weather into a Local Operational Context
As the City of Carrollton expanded its GIS capabilities from people and facilities to the broader city environment, the next logical question was this: How are changing conditions going to affect city operations?
The answer was to connect weather intelligence with the city’s assets and services.
The city’s storm dashboard uses data from ArcGIS Living Atlas, including information from the National Oceanic and Atmospheric Administration (NOAA) and the National Weather Service (NWS).
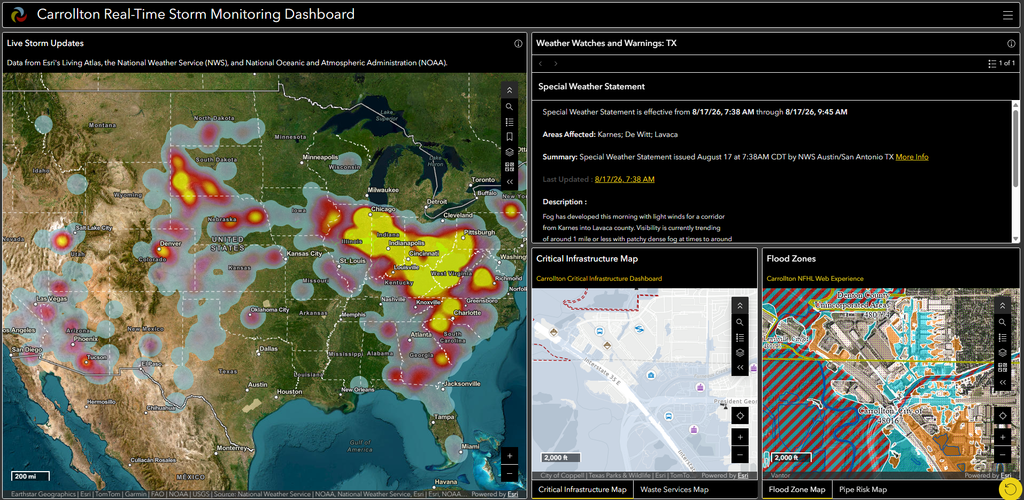
Because the data is already symbolized and configured, the city can bring authoritative weather information into an operational dashboard and view it through a local lens. The dashboard includes a city-services view and connects users to other operational maps, including critical infrastructure, trash routes, FEMA national flood hazard zones, and city pipes ranked by age risk.
That connection matters.
If severe weather is concentrated in one part of the city, staff can anticipate where city services could be disrupted, identify which routes may be affected, and prepare for an increase in calls from residents.
The dashboard is doing more than displaying weather. It is relating weather hot spots to the city’s other data to visualize where a storm’s impact might be strongest. In other words, it is helping the city translate weather conditions into operational consequences and set expectations with residents on recovery time.
From Field Reports to Decision-Ready Information
Damage Assessment and Debris Tracking Turn Observations into Action
When severe weather moves from forecast to impact, the city’s GIS workflows shift from monitoring conditions to documenting what happened on the ground. That transition has helped elevate GIS within the City of Carrollton’s emergency management program. After severe weather in 2022 that was initially described as a wind event, the city used its damage assessment survey and dashboard to visualize field reports. The resultant spatial pattern revealed something important: The damage was consistent with a tornado.
“This is kind of what put GIS on the map for the City of Carrollton Emergency Management,” Segel said. “We are able to prepare for an influx of calls in to the operations center, and then we can explain to our residents when they can expect city services to start back up.”
The technology didn’t simply document the event. It helped the city understand what had actually happened.
Segel later enhanced the workflow so that staff could compare damage assessment and debris survey submissions in the field with incoming resident calls. This data was categorized by storm debris type via the customer relationship management (CRM) platform. Other data from affected residents was submitted via the city’s Damage Assessment Survey, created using ArcGIS Survey123. The survey collected information like damage extent, insurance coverage status, and photo uploads. ArcGIS Survey123 and dashboards were used to categorize damage by severity and visualize the information through charts, filters, and map layers.
The data’s significance was not limited to GIS professionals. The information could be understood by people who did not work with GIS every day, which made it useful for briefing city leadership and elected officials.
The same principle has been carried into debris management.
After a storm, the city uses information from its debris-removal contractor to create a timeline-based view of cleanup progress. Leadership can see the transition from an impacted or blocked street to a cleared street and understand how quickly recovery is progressing.
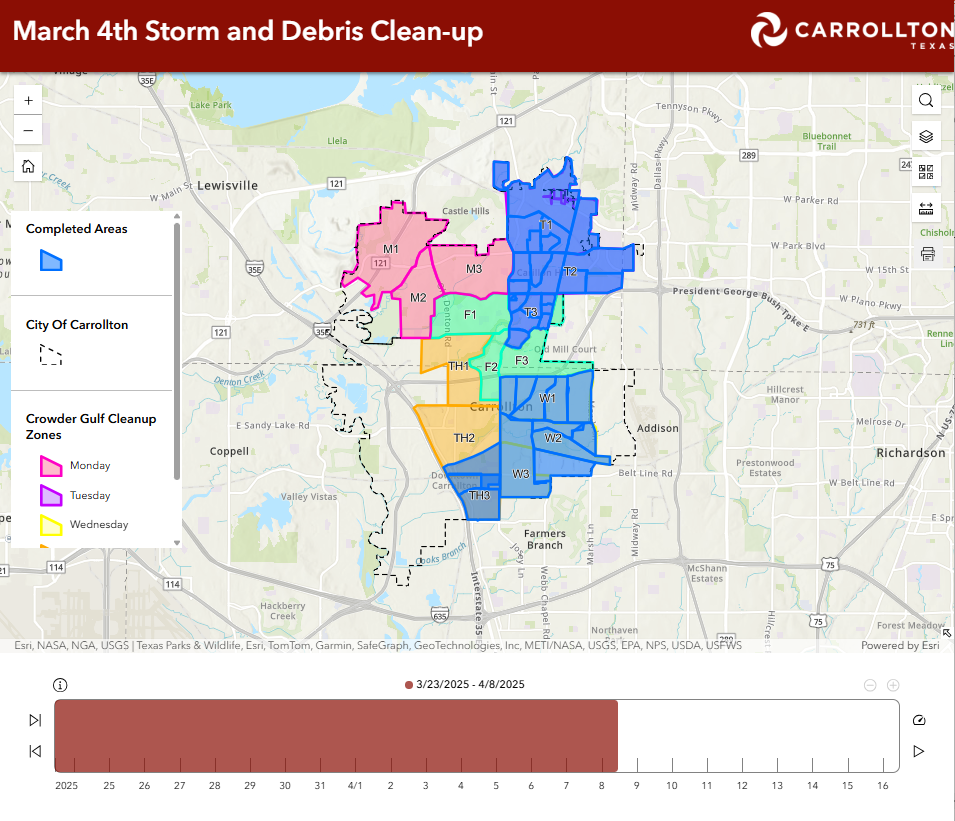
That visibility gave elected officials a better way to answer residents’ questions.
“Citizens were calling our elected officials,” Torres said. “And because of ArcGIS and the tools we’d developed, our leadership was able to tell residents the city was working on cleanup. And more specifically, they were able to say, ‘Your residence is in phase one, two, or three, so your street will be cleaned by tomorrow.’”
That is a powerful example of GIS serving a purpose beyond providing situational awareness. It has become a communication and accountability tool.
Preparing for the Logistics of Recovery
Donation Management Brings Structure to Community Support
Recovery is about more than documenting damage. It is also about managing the people, supplies, and resources that arrive after an emergency.
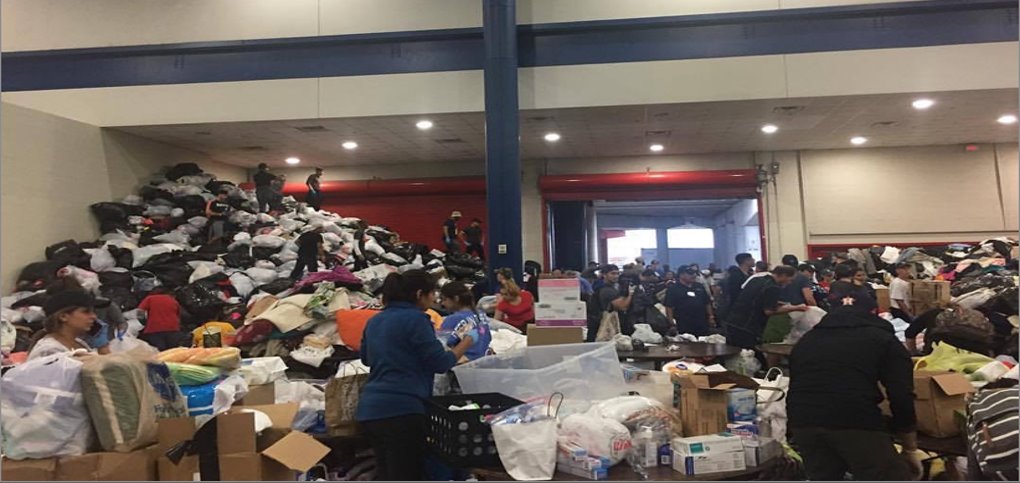
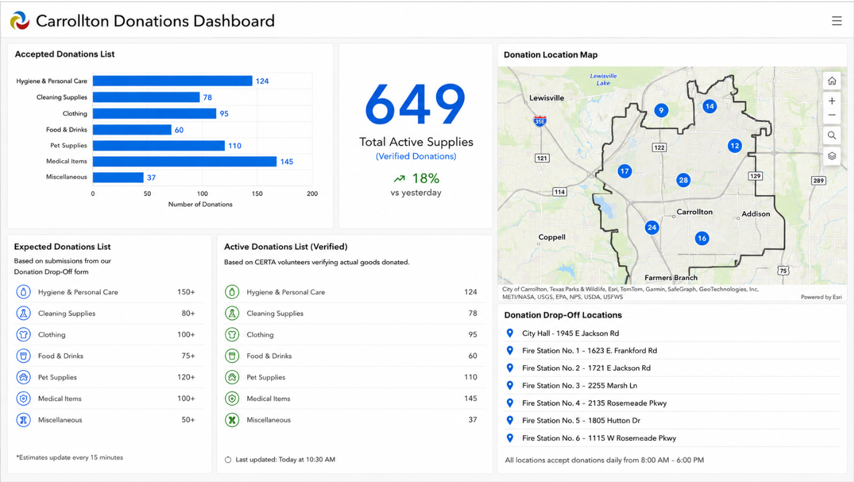
The City of Carrollton is applying GIS to that challenge through a donations management dashboard, a drop-off survey, and the Disaster Response Alliance volunteer survey.
The goal is to help the city track donated supplies, verify inventory, and understand where resources are located.
The need is straightforward: Donations often arrive with the best of intentions, but without a structured process, they can quickly become difficult to count, organize, store, and distribute.
By connecting surveys, dashboards, and verified inventory, the city can create a clearer picture of what resources are available and where they may be needed. “We can track donations and give updates to different stakeholders—like fire and rescue—who are often providing donated goods like diapers to residents in need,” Segel said. “With this solution, we are now better prepared to distribute those resources.”
The solution is still under development, and its first live use will help the city refine inventory categories, targets, and workflows. But the potential is much broader.
The process could eventually enable residents and volunteers to simply scan a QR code or click a link to provide information about what they need, where it is needed, or what they have available to donate.
The larger idea is simple: Turn the generosity that follows a disaster into an organized, visible resource, connecting people to the things they need to recover.
Breaking Down the Boundaries Between Agencies
Connecting Emergency Management, 911, and Regional Partners
As the City of Carrollton’s tools mature, their value increasingly extends beyond the emergency management office itself.
The city’s ArcGIS capabilities support coordination with other departments, public safety partners, and neighboring jurisdictions. One such partner is the North Texas Emergency Communication Center (NTECC), the public safety answering point (PSAP) that answers the city’s calls to 911. NTECC regularly collects the city’s essential public safety GIS data, such as road centerlines, address points, and first responder agency boundaries, and aggregates it into a much larger dataset spanning the four cities NTECC serves. This foundational work not only helps NTECC quickly locate 911 callers within the city and dispatch responders but also encourages the PSAP and the city to share GIS data to improve emergency response.
The NTECC can access certain city data during emergencies and collaborate with the city when operational dashboards or information are needed.
That kind of connection becomes especially important when an incident crosses jurisdictional boundaries. A debris field does not stop at a city limit. Neither does a tornado, a chemical release, a power outage, or any other hazard.
The city’s work demonstrates how local GIS capabilities can become the foundation for shared situational awareness among emergency management agencies, public safety organizations, and regional partners. The technology may begin as a solution to a local problem. But once information can be shared, connected, and understood across organizations, its value grows exponentially.
GIS as a Tool for Government Accountability
Ultimately, the City of Carrollton’s ArcGIS deployment points to something bigger than dashboards.
With each application, the city is building repeatable workflows that help people collect information, understand what it means, share it with the right audience, and take action.
For Torres, the goal comes back to a fundamental question. “We’re constantly asking ourselves how we can make this easier, faster, and more accurate when an emergency happens,” Torres said.
The answer has been to understand the city’s processes; identify where information is being lost or delayed; and build tools that support decisions, from the field to the emergency operations center to the council chamber.
Ease of use has been critical to that success. Segel emphasized that the tools need to be understandable not only to GIS professionals but also to the city officials and leaders who rely on the information. The city’s emergency management coordinator, Elliott Reep, can demonstrate the tools to city officials and council members without having to explain the technical infrastructure behind them.
“[Reep] is able to confidently use these tools because they’re very easy to use,” Segel said. “They’re self-explanatory. And with just a couple of clicks, he is able to interpret and visualize critical information to share with city council.”
That accessibility has created something even more valuable: a feedback loop. Leaders ask questions. Residents ask questions. Partners ask questions. And the technology helps the organization find and communicate the answers.
“This is how we are able to highlight government accountability,” Torres said.
A Model for the Emergency Management Programs of the Future
The City of Carrollton illustrates what can happen when GIS becomes embedded in the emergency management life cycle rather than treated as a stand-alone mapping function. Hazard data supports preparedness. Outage dashboards support readiness and response. Weather intelligence connects conditions to city operations. Damage assessment and debris-collection tools support recovery. Donation tracking helps organize community resources. Regional data sharing creates a foundation for broader collaboration. And throughout the process, GIS provides a common thread: location.
Ultimately, GIS answers this question: Where does the organization need to act?
The city is replacing paper-based workflows and static information with living systems that help staff and leaders understand not only what is happening but also what it means and what should happen next.
For emergency management organizations that face limited resources, rising expectations, and increasingly complex incidents, the City of Carrollton offers a practical model.
Start with the operational problem. Build something people can actually use. Automate what can be automated. Connect information that has traditionally lived in silos. And let every incident teach the organization how to get better. That is when ArcGIS stops being simply a technology in the background and becomes part of how emergency management gets done.