A Customer Spotlight
Guadalupe Valley Electric Cooperative (GVEC) is a cooperative based in South Central Texas, providing electric, internet, and beyond-the-meter services to over 100,000 electric customers and around 30,000 internet customers across 13 counties. GVEC’s primary services include reliable electricity and advanced internet solutions, making it a vital utility provider in the region. With a service area spanning over 3,500 square miles, GVEC is committed to delivering efficient and innovative services to its customers.
Challenge
Routine pole inspections are crucial for maintaining service reliability and safety. Outdated software hindered the previous pole inspection process due to bugs and hardware compatibility issues, making it challenging to extract meaningful data.
As a result, the pole inspection workflow was inefficient in both the field and the office. The limitations resulted in manual data collection, a lack of real-time location-based intelligence, and difficulties in extracting and analyzing data. These issues not only increased costs but also reduced productivity, making it challenging to ensure regulatory compliance. GVEC recognized the need to modernize its inspection workflow to improve operational efficiency and safety.
ArcGIS is the centralized system for spatial data at GVEC. Therefore, an ArcGIS solution for pole inspections enabled seamless integration with existing data, eliminating the need for additional software.
Solution
The goal was to streamline field inspections, data management, and analysis. GVEC needed to ensure high availability and user-friendly interfaces. The cooperative wanted to clarify the distinction between failed poles and passed poles at a glance. To address these challenges, GVEC applied ArcGIS Field Maps, ArcGIS Dashboards, and ArcGIS Experience Builder.
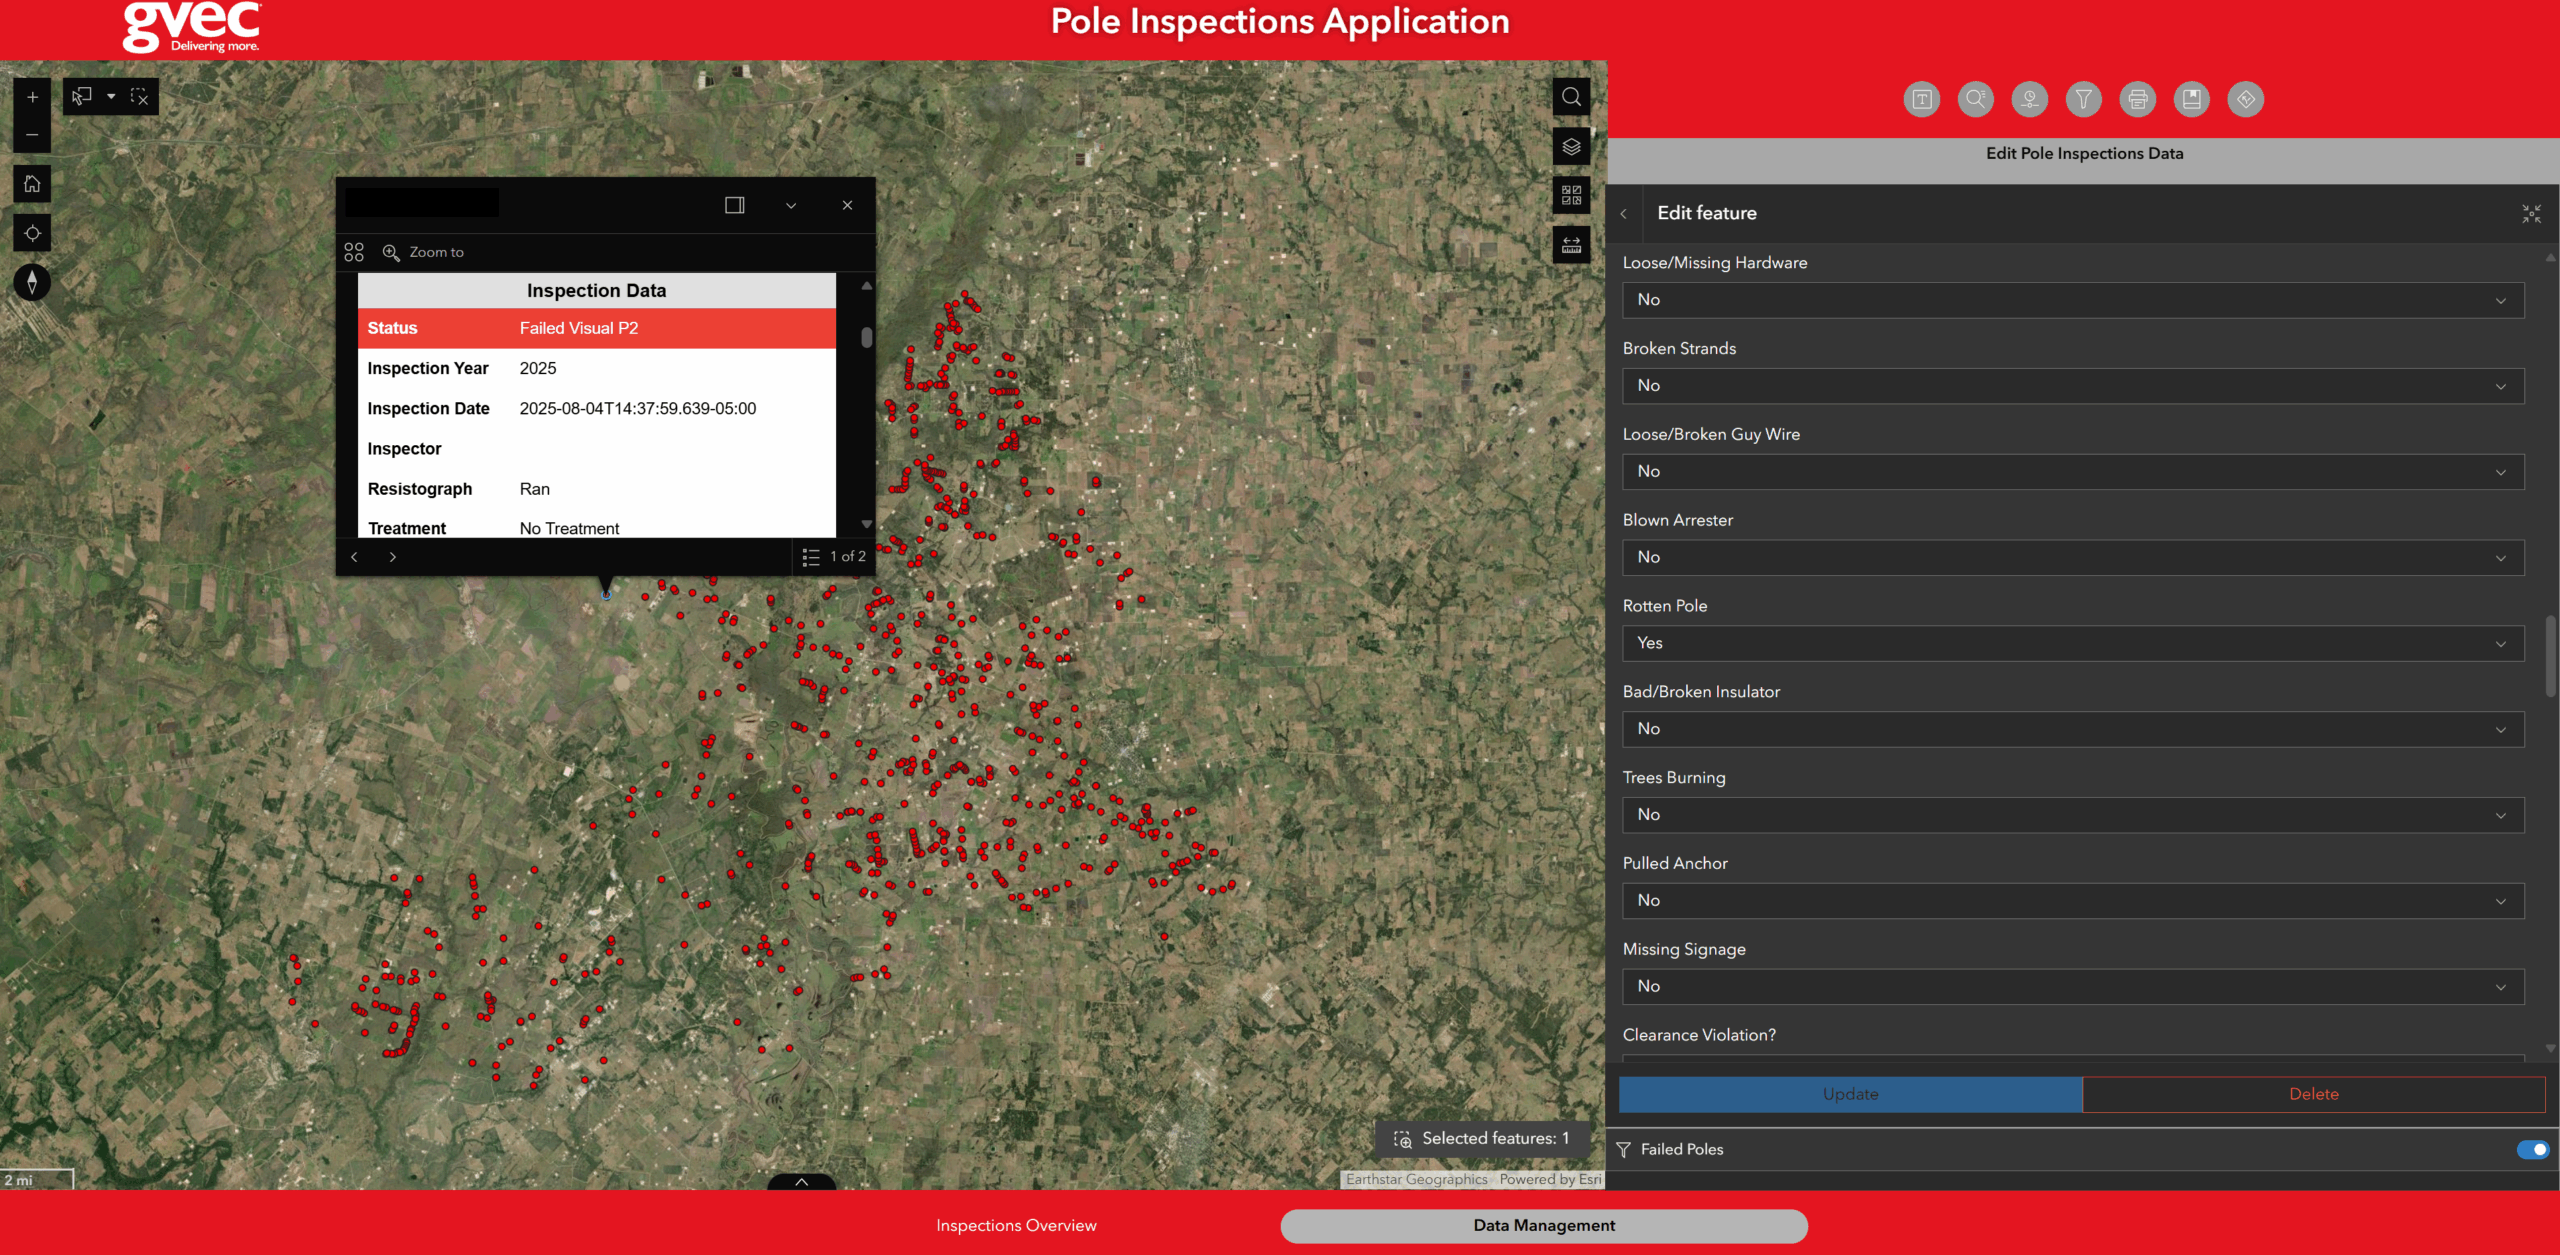
ArcGIS Field Maps enables field inspectors to capture data efficiently in the field, navigate to pole locations, and perform workflows independently, even when offline. This improved the accuracy and timeliness of inspection data.
ArcGIS Dashboards provides stakeholders with real-time visibility into inspection results, allowing for better monitoring of inspection progress and more informed decision-making. Users can now group and organize poles based on specific criteria and easily track which poles have already been replaced.
The utility used ArcGIS Experience Builder to create a customized application that integrates with Power BI, providing executive-level insights and further enhancing GVEC’s ability to analyze and act upon inspection data.

The implementation evolved to meet GVEC’s needs through a proof of concept, stakeholder feedback, and refinement. The new solution provides real-time visibility into inspection results, empowering stakeholders to manage and analyze inspection data directly.
Results
The solution yielded significant benefits for GVEC. Power BI is GVEC’s primary tool for viewing data and tracking project progress. Esri software’s seamless integration with Power BI enables the display of key information, including inspection status, poles requiring change-outs, and historical pole inspection data. This integration made it easy to connect field data with the tools that leadership is comfortable using.
Field staff appreciated the simplified interface and visually informative conditional formatting. They stated that the ability to view consumers in the application, auto-populate based on input from other fields, and symbolize poles based on status helped ensure productivity.
The cooperative reduced costs by approximately $6,000 per year in software licensing. The new solution also enhanced decision-making capabilities by providing real-time location-based intelligence.
This approach increased efficiency and transparency in the cooperative’s operations. GVEC plans to expand the implementation by integrating a scheduled notebook and migrating historical data to their data warehouse. The success of this project is enabling GVEC to consider applying similar approaches to other maintenance inspections.