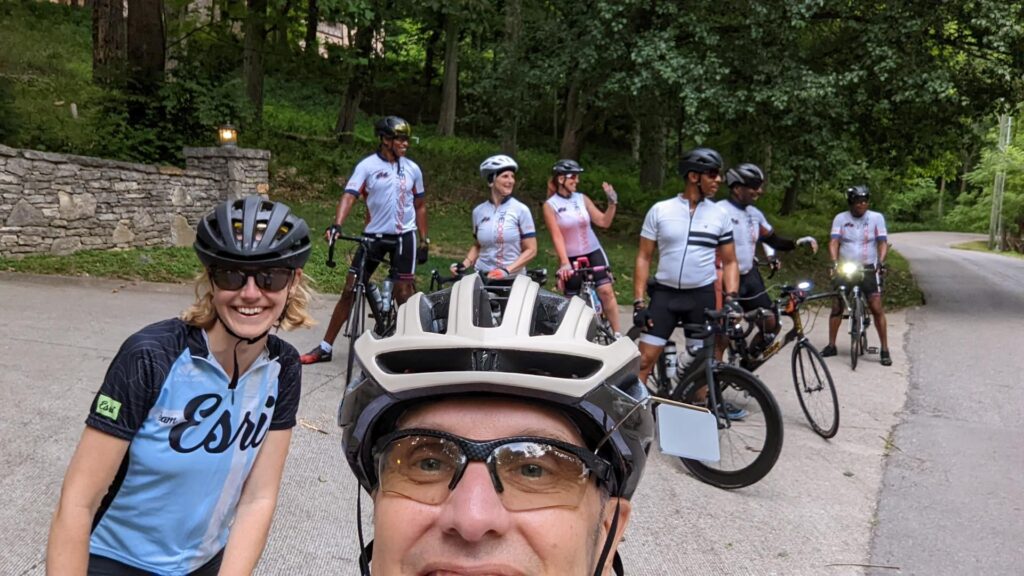
After a 13-year break from road cycling, this past Memorial Day Weekend sparked the interest again. That weekend, I ended up cycling a total of nearly 60 miles on my trusty aluminum Cannondale. In the subsequent weeks, I haven’t stopped. The cycling bug has bit me hard!
Aside from a slightly (ok… vastly!) slower average speed, there is a noticeable difference from my current era of cycling compared to my former cycling life: air quality. The difference is both spatial and temporal.
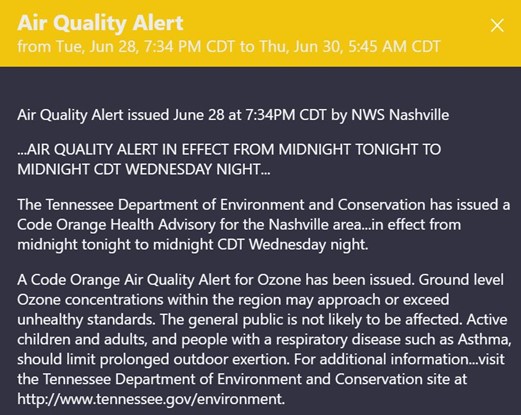
In college I had the luxury of cycling in some of Tennessee and Kentucky’s rural farmlands and countryside where the air smelled sweet with the changing seasons. Now I live in a fast-paced and rapidly expanding metro area and most of my cycling has been through the city. There are some days where you can literally feel the grit in the air settle on your skin like a greasy film. Other days you can feel it in your throat, eyes, and ears. Air quality is not equally distributed or experienced across the landscape, or across varying scales. It’s very dynamic in its movement depending on the season, humidity, wind and a variety of other complex and inter-related factors.
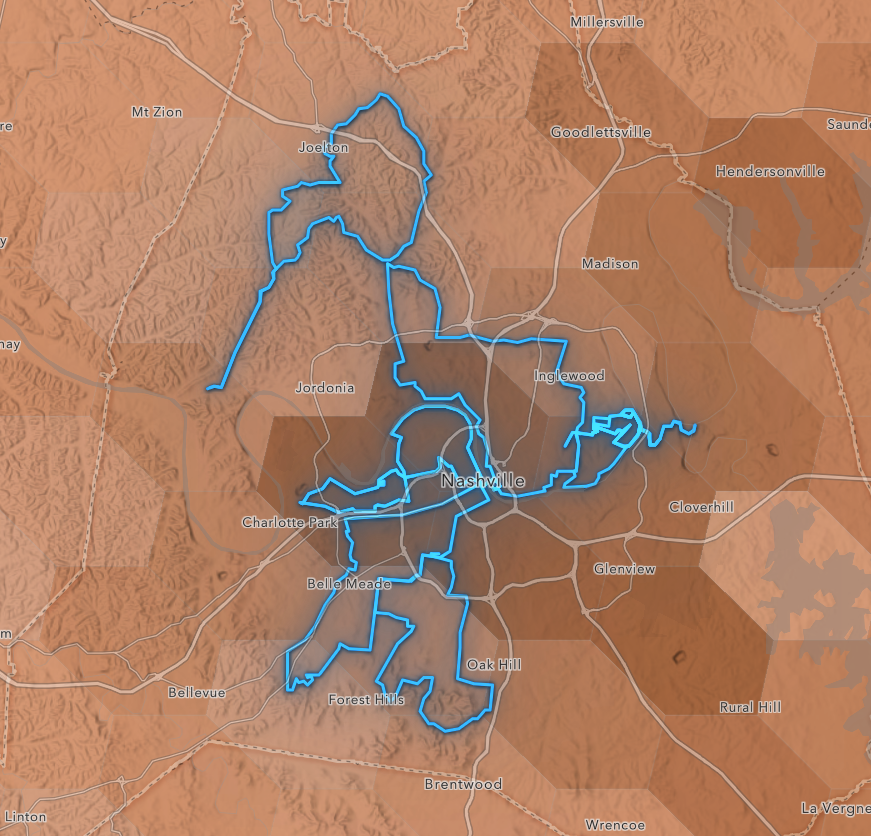
Generally speaking, with the passage of the Clean Air Act in the 1970’s, air pollution in the US has dropped over 60%, proving that enforcing regulatory policy is an effective way to address environmental hazards. If we look at the past 20 years globally, the story is just “meh.” In Nashville, we unfortunately fall within the top 25th percentile for most polluted cities in the United States, and while we have made strides to improve, the pressure of growth and climate change have not been kind to our environment and are threatening to continue making the issue worse in the future. Many communities share this story.
I have reason to remain optimistic, however. Understanding a phenomenon that varies across a geography requires that we apply a geographic approach and geographic tools to assess the situation and take targeted action. The tools to do this already exist and are easier to access and deploy than they ever have been before – largely thanks to major advancements in cloud-based technology.
Understand
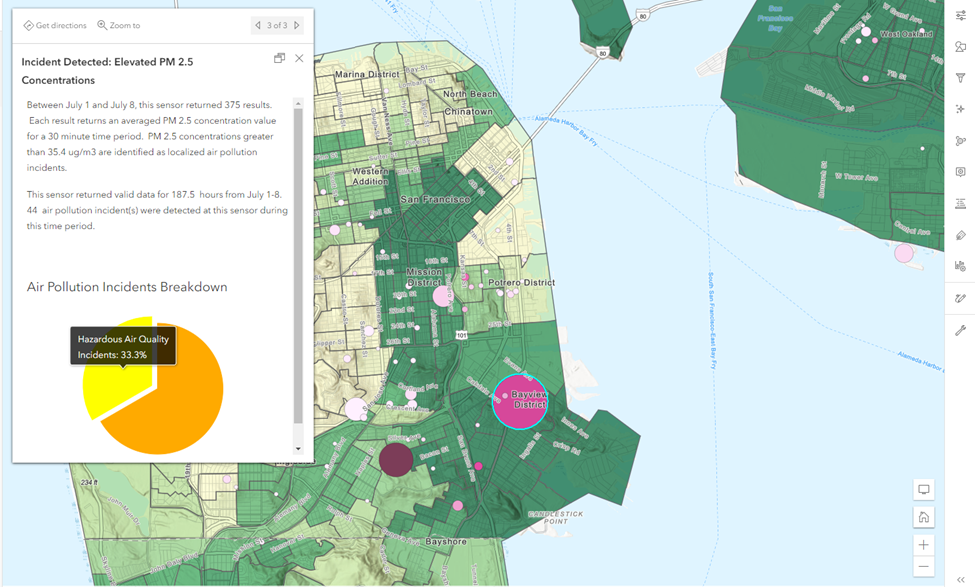
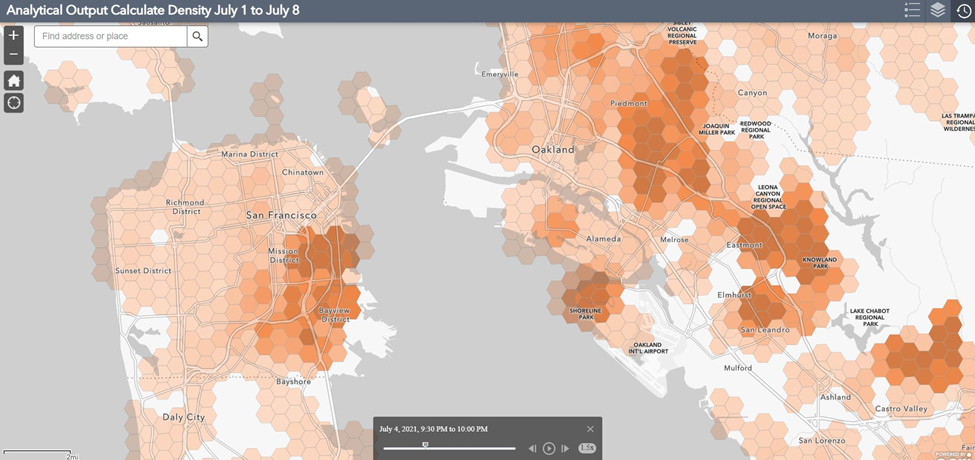
There are so many sensors out there monitoring air quality and taking various kinds of metrics on various kinds of pollutants. It’s extremely valuable information, but only if we can aggregate it and use it! Thanks to advancements in IoT and cloud technology we have tools like ArcGIS Velocity that allow us to ingest these data, integrate them and analyze them at scale and in real time. This enables us to gain valuable insights on not just our air quality, but also facility compliance or even to send real-time alerts to stakeholders when there are deviations from normal values.
Esri also works with a number of organizations including NOAA, OpenAQ, EPA and others to provide out live feeds of datasets that are available for anyone to incorporate into their own analyses easily. These live feeds power Esri’s Living Indicators of the Planet and help organizations and the public rapidly assess current environmental conditions where they live – air quality included!
Plan
Once we understand the status of air quality across our landscape, we can begin to plan and analyze against numerous datasets to really hone our strategies to mitigate issues in the most impacted areas and the most vulnerable populations. Again, my optimism stems from knowing these tools exist and they are easier to access and use than they ever have been.
For example, Esri’s Demographics include global data for over 130 countries, and for the United States, Esri continually updates US Census data and just released the 2022 data with plans to maintain this alongside the 2010 data. Esri’s Demographics have been ranked #1 for accuracy and performance – even at granular geographic scales. This means that when we develop our environmental strategies, we can be confident that these strategies are actually helping those who need it the most. These datasets can be used in ArcGIS Pro, inside your web maps and available inside a wide array of focused Esri products like ArcGIS Community Analyst, ArcGIS Insights.
Their ease of access and usability is made even greater by tools like Maps for Public Policy in Esri’s Living Atlas, where you can quickly find answers to pertinent policy questions such as rates of asthma, insurance covered or other related items and share these maps immediately with stakeholders. Additionally, the Living Atlas team has published the Council of Environmental Quality (CEQ) Justice 40 layer, making our analyses just that much easier!
Act
There are several fantastic ArcGIS Hubs for the public to understand their local air quality. Some favorites are this one out of Douglas County, Nebraska and even EPA Region 9 is taking the AirNow data and standing up focused applications inside ArcGIS Hub that allow users to see a more intuitive breakdown of the information.
When I’m on my bike though, I’m on the go, and this is why I find native mobile applications so useful. With Esri’s AppStudio, they’re very easy to develop and integrate with all of these useful data sources. For example, the South Coast Air Quality Management District developed this native mobile application for their communities to quickly see air quality information in real time! Users can receive air quality forecasts to help plan outings, configure air quality notifications, and even translate to Spanish for accessibility! My favorite part is that the app has been developed for use on an Apple Watch as well – making it even more useful when outside recreating!
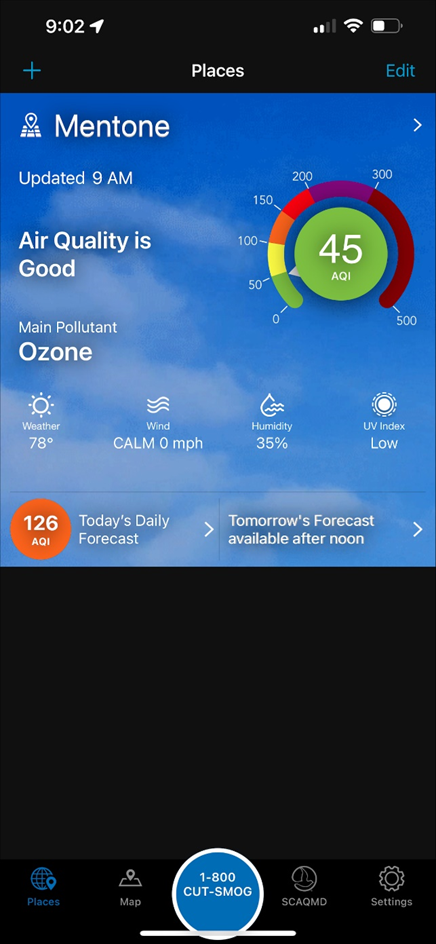
The SCAQMD Mobile App built with the Esri platform allows users to monitor air quality on the go on a mobile app or smart watch.
We know we are facing huge environmental challenges, but we also have solutions to help us start tackling them now. The geographic approach is already having a positive impact. My optimism stems from seeming so many organizations already embracing these tools to be proactive about environmental issues! The return on investment goes beyond streamlining our workflows, developing more sound strategies and reaching our stakeholders – it directly impacts our health and our quality of life. The only time I want my lungs to burn are when I’m tackling a steep incline on my bicycle! Let’s make our air quality safe for everyone.