Economic Mobility

Map what matters and plan for greater prosperity

Map displaying economic mobility data alongside a person working at a cash register

Use location to create economic opportunity

Planners around the world use GIS to foster economically mobile communities that include mixed-use development, walkable neighborhoods, efficient transportation options, affordable housing, and access to jobs and education.

Analyze access to essential services, identify where investments should be made, and monitor the progress of economic plans with maps and spatial analytics in ArcGIS.

Reveal service gaps with spatial analysis

Identify discrepancies between where people live and where opportunities exist with network analysis and demographic overlays.

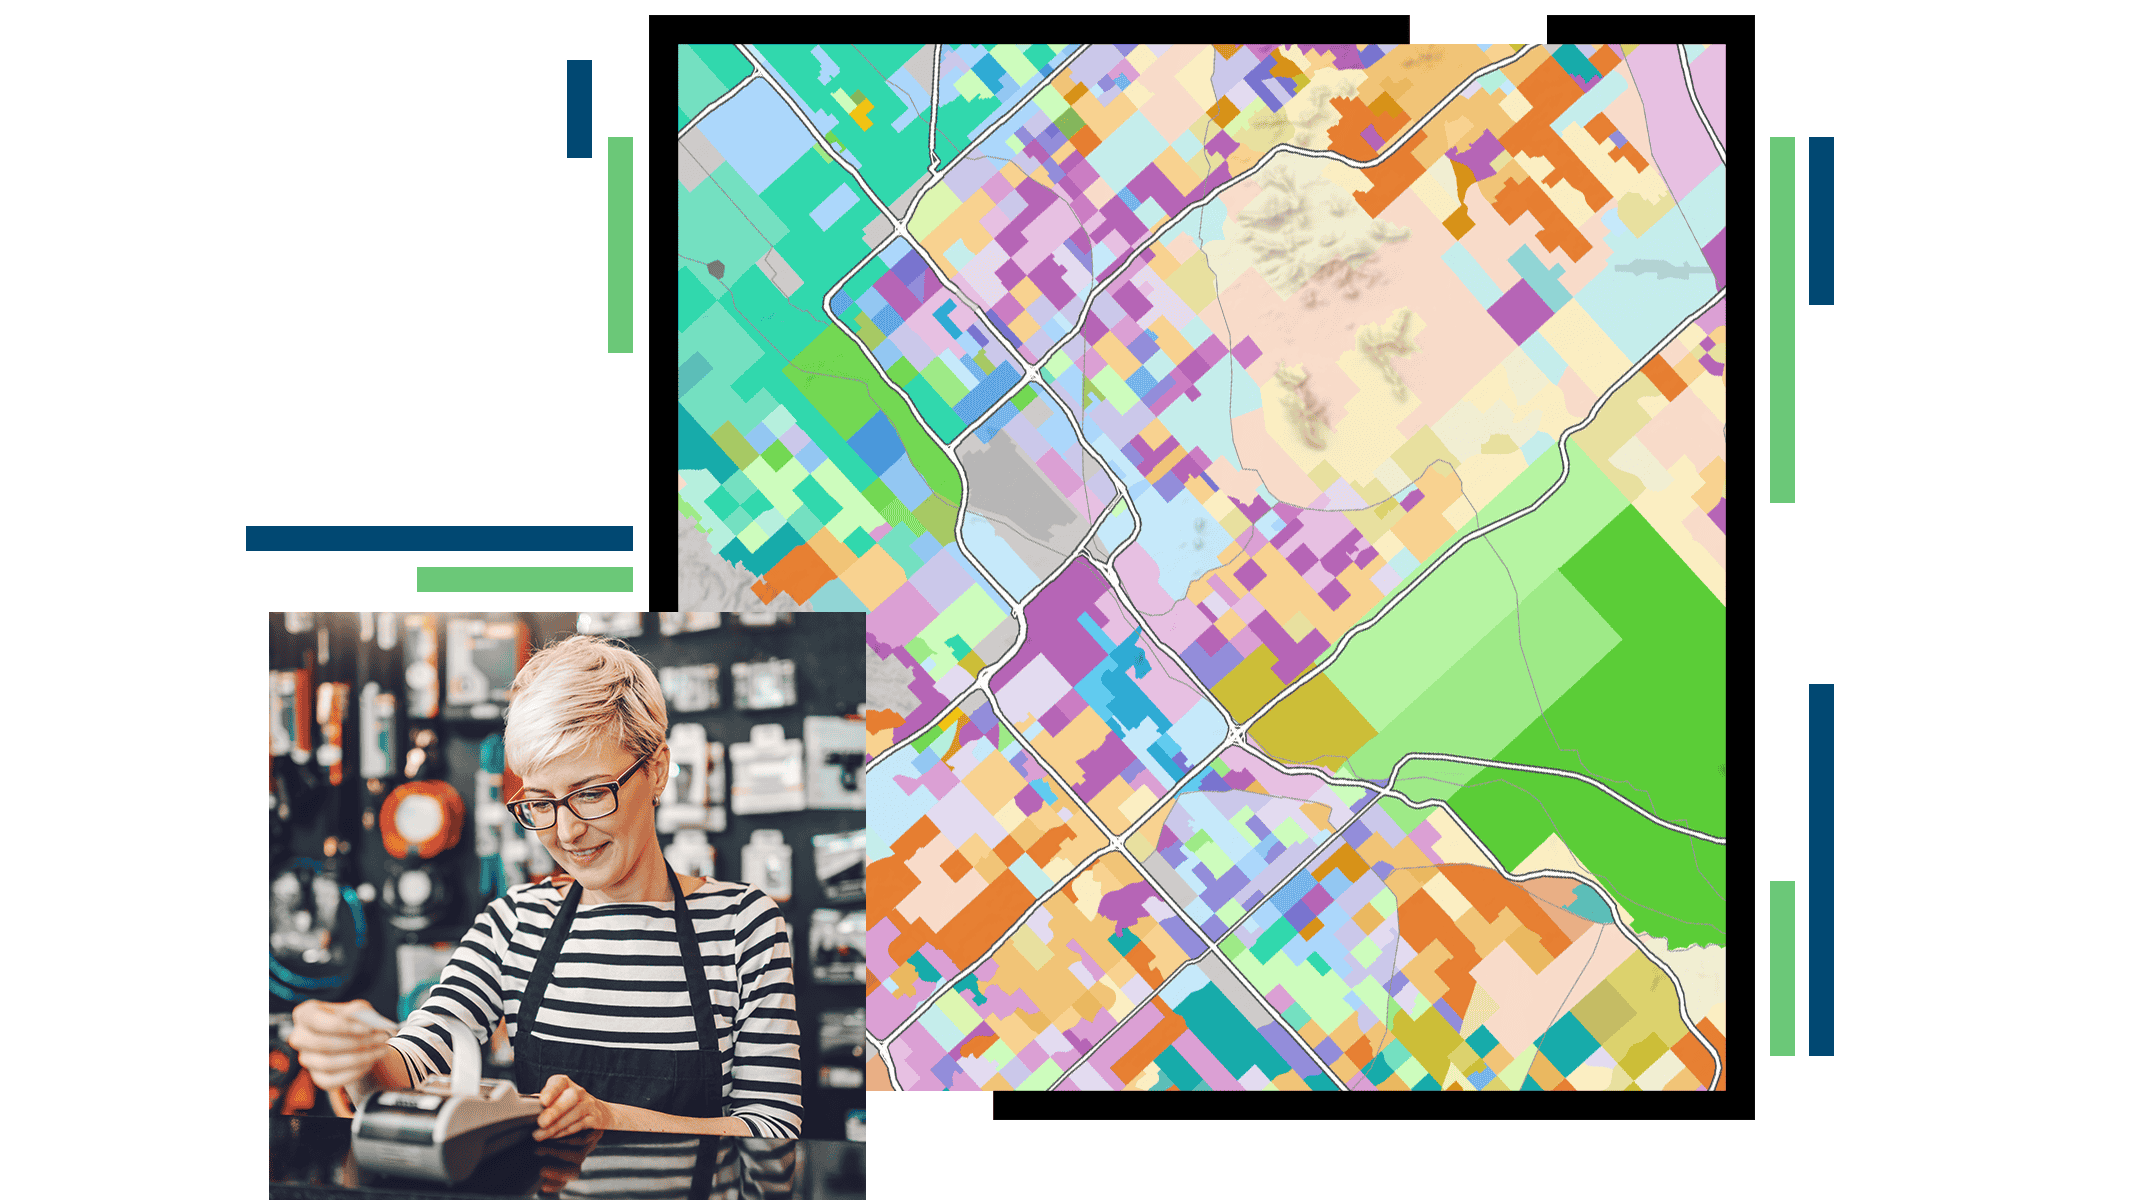
ArcGIS helps planners pinpoint where essential services—like transit, childcare, or job centers—are lacking. This allows communities to fund equitable development projects that close access gaps and remove barriers to upward mobility.

Map of Chicago showing ECE service access with blue shading for gaps and red markers for key locations

Prioritize developments with precision

ArcGIS enables planners to simulate and compare different development strategies—such as where to build affordable housing, expand transit, or invest in workforce programs—based on spatial data.

By modeling outcomes like job access and commute times, planners can identify where to allocate funds for equitable community development and enhanced quality of life.

Map with highlighted areas and a pop-up showing details for the Empire State Building to guide investment priorities

Turn maps into conversations

Transform complex economic data into compelling, interactive narratives with ArcGIS.

Use tools that combine maps, 3D scenes, and multimedia to share plans, gather feedback, and build consensus with residents, business owners, and decision-makers. By making data accessible and actionable, ArcGIS fosters transparent, inclusive communication that drives community-informed action.

Three interactive maps showing poverty and urban stress data across Tucson by ward and neighborhood

ESRI BLOG

A Houston suburb embraces vertical growth

Dickinson, Texas, uses GIS to create high-density spaces that meet residential, commercial, and recreational needs as the city grows.

Read the story

Products and solutions for economic mobility

Previous
Next

Contact sales

Please share your information and our sales team will contact you soon. We look forward to communicating with you.