The Headlines
-
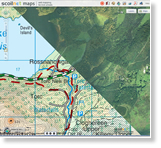
Irish students learn geospatial thinking skills by working with Scoilnet Maps, served using Esri technology. Scoilnet (Schoolnet) is a teacher resource portal provided by Ireland's Department of Education and Skills. Read the article.
-
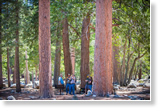
Forestry professionals from all over the world converged on Redlands, California, for three days to see how fellow foresters use GIS to improve forest management and operations. Read the article.

-
With the rush to urbanize, how can Europe preserve its historic landscapes, archaeological features, and open space? Find out at Geodesign Summit Europe, a gathering at GeoFort in the Netherlands. Learn how geodesign technologies can contribute toward a more sustainable Europe. Read the article.
News Bytes
-
Garsdale Design Limited, a British firm, used Esri CityEngine to create 3D models for a master plan of the city of Nasiriyah in southern Iraq. Read the article.
-
Though the state of emergency is over, the GIS team in Calgary, Alberta, Canada remains hard at work on its geospatial emergency management system, which became a critical component of the city's operations during the recent devastating floods there. Read the article.
-
University of South Carolina geography majors used Esri story maps and ArcGIS Online for class projects that assisted local agencies. Read the article to learn about the triumphs and challenges.
-
Listen to Esri president Jack Dangermond and Technology/Entertainment/Design (TED) founder Richard Saul Wurman talk about the Urban Observatory project, which was on display at the Esri International User Conference (Esri UC) this year.
-
See the locations of active wildfires, current wind speed and direction, and more, on this wildfire public information map.
-
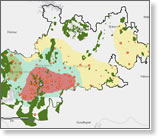
These story maps created using ArcGIS Online show land cover and other environmental changes in the Hindu Kush Himalayas. The International Centre for Integrated Mountain Development hosts the story maps on its Mountain GeoPortal.
Centerpoints
-
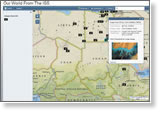
David MacLean, a faculty member at Nova Scotia Community College, used ArcGIS Online to map photographs of places of interest on Earth taken by Commander Chris Hadfield and astronaut Thomas Marshburn during their International Space Station mission. Explore the map.
-
Good maps need good context. ArcGIS Online provides a selection of basemaps such as the Light Gray Canvas Map to help you show your information in the best context possible, helping readers to better understand what you are trying to convey. Read the blog.
-
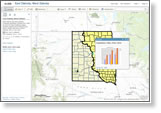
What if North Dakota and South Dakota had been East Dakota and West Dakota instead? Esri's Joseph Kerski uses ArcGIS for Desktop and ArcGIS Online to create a map of and analyze data about two states that might have been. Read his blog and view his map.