ArcUser Online
Summer 2011 Edition
Enhanced American Community Survey Data
Available on the desktop, on the server, and online from Esri Business Analyst
This article as a PDF.
Esri has made American Community Survey (ACS) data, available from Esri Business Analyst products, more usable and understandable by providing reports, thematic mapping, online help, and symbols that flag the reliability of this new sample data.
In 2010, the Census Bureau changed how it collects decennial census data by eliminating the traditional long form questionnaire with a new rolling survey that collects data on income, education, employment, language, migration, citizenship, marital status, and housing characteristics such as value and rent. ACS samples a small percentage of the United States population every month, then combines and averages data to produce one-, three-, or five-year databases. ACS uses a smaller sample size, which impacts small-area estimates.
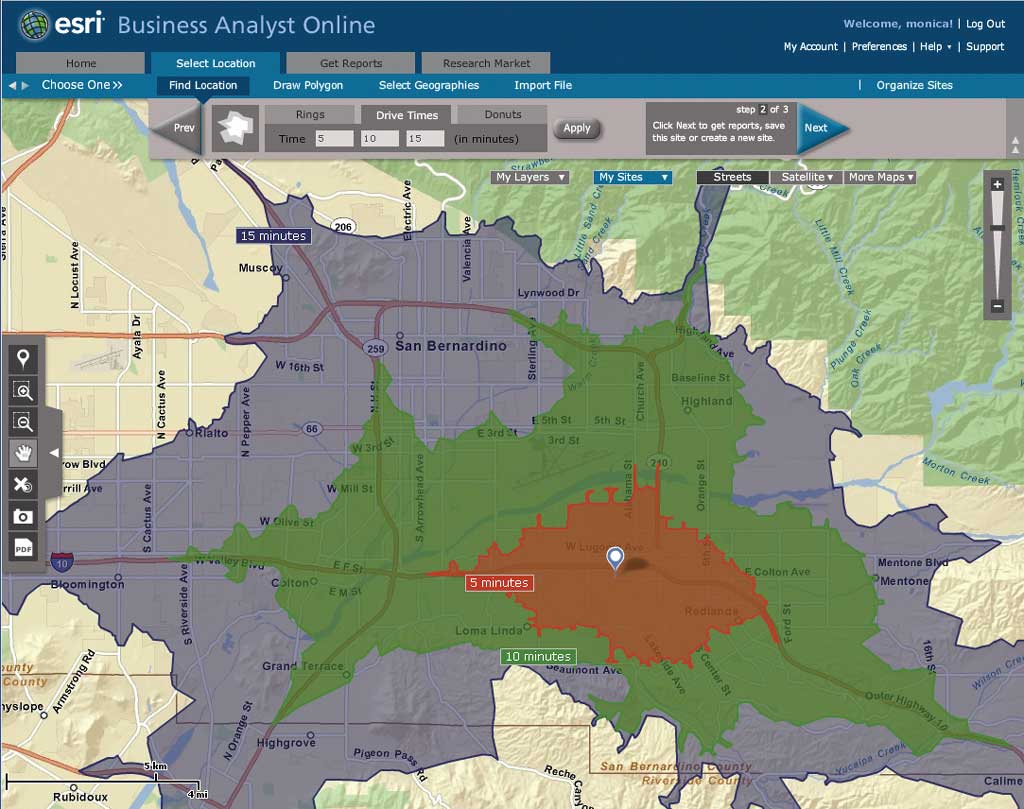
American Community Survey (ACS) data is available from Esri Business Analyst products.
Using data from this survey requires greater sophistication by GIS users. For a more detailed explanation of ACS, see the series in ArcUser by Esri chief demographer Lynn Wombold that begins with "Changes and Challenges: Understanding American Community Survey Data" in the October–December 2007 issue.
In addition to ACS data for standard Census Bureau geographies, such as states, counties, census tracts, and block groups, Esri provides the ability to query ACS data for the most popular geographies—ZIP Codes and user-defined polygons (e.g., drive times, rings, and custom trade areas).
Esri has made it much easier to evaluate estimates based on the ACS margin of error (MOE). The Census 2000 sample, with data collected using the long form, represented approximately 1 in 6 households on one day, April 1, 2000. ACS represents approximately 1 in 40 households on a rolling sample basis, but the smaller sample sizes can produce larger sampling errors.
With each ACS estimate, the Census Bureau reports an MOE, or measure of the variability of the estimate due to sampling error. The MOE enables data users to measure the range of uncertainty around each estimate. The larger the MOE, the lower the accuracy of the estimate—and the less confidence one should have that the estimate is close to the true population value.
Since ACS data in geographies not supplied by the US Census Bureau lacks tabulated MOEs, Esri has remedied this situation by developing algorithms to calculate MOEs using guidelines from the Census Bureau. These algorithms account for full and partial areas within the custom area.
Because making decisions about the quality of an estimate based on the MOE is difficult, Esri has simplified the process by adding symbols that flag reliability of data based on sample size. Symbols are based on thresholds of reliability Esri established using an estimate's coefficient of variation (CV). [CV is a measure of relative error in the estimate, calculated as the ratio of the standard error to the estimate itself.]
High Reliability: Small CVs, less than or equal to 12 percent, are flagged green to indicate that the sampling error is small relative to the estimate. These estimates are reasonably reliable.
Medium Reliability: Estimates with CVs between 12 and 40 are flagged yellow and should be used with caution.
Low Reliability: Large CVs (more than 40 percent) are flagged red to indicate that the sampling error is large relative to the estimate. These estimates should be considered very unreliable.
These innovations eliminate the need for users to interpret the ACS MOE and provide more accurate data for making better business decisions.
Esri also supplies ACS Population Summary and ACS Housing Summary reports that contain data from the 2005–2009 ACS five-year period estimates. The ACS Population Summary includes variables on education, language, and income. It also includes variables for marital status, school enrollment, educational attainment, language, means of transportation to work, travel time to work, employment by industry and occupation, income, and poverty status. The ACS Housing Summary provides housing data that includes variables for home value, mortgage status, amount paid in rent, units in structure, year structure built, type of heating fuel used, and number of vehicles available for both owner-occupied and renter-occupied housing units.
These reports are available immediately to guest users and subscribers of Business Analyst Online (BAO). [BAO is a web-based solution that combines GIS technology with extensive demographic, consumer spending, and business data for the entire United States to deliver on-demand, boardroom-ready reports and maps.] Business Analyst Desktop users can access ACS data by choosing the Show Online Reports option from Preferences. Business Analyst Server users can integrate ACS data and reports instantly via the Business Analyst Online APIs. For more information, see esri.com/bao.