Image Visualization and Interpretation

Make imagery easier to understand and interpret with visualization tools in ArcGIS

Visualize for efficiency

Give the power to interpret imagery and take informed action

ArcGIS helps you visualize all kinds of imagery—from stereo, oriented, and multidimensional to motion imagery—for effective image interpretation. View 2D or 3D imagery interactively in Esri’s desktop and web applications. Create and share dynamic applications, reports, and visual stories using imagery to help others see where action is required.

Enhance imagery with geospatial context

Choose the deployment that meets your requirement—reduce upkeep time with SaaS or choose on premises options for greater control.

Visualization for efficiency and accuracy

Use desktop and web apps to help view imagery in its natural orientation, distortion free, or in 3D to interpret visual data more accurately.

View imagery in motion

Include video as another data source that seamlessly integrates into your analysis workflows. Stream live video to get near real-time insights.

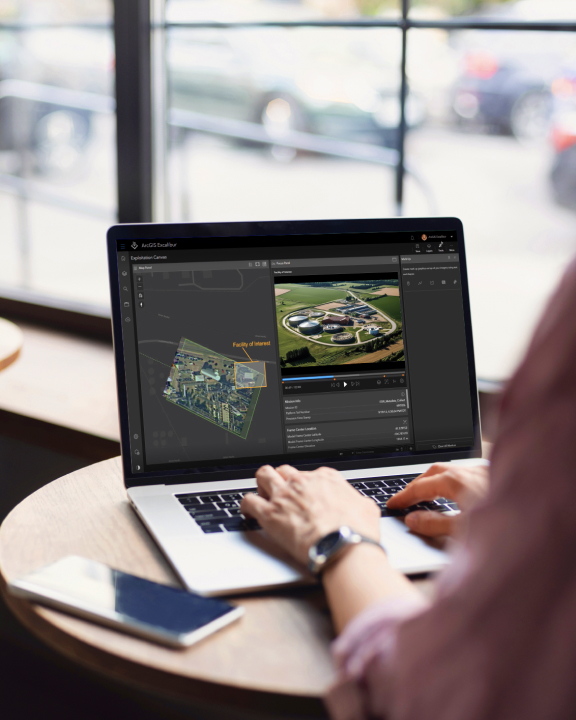
Aerial view of an industrial facility nestled in a sprawling green field
Analyst holding a tablet and typing while viewing video in ArcGIS Excalibur

Manage all types of imagery

Organize and share collections of drone, aerial, satellite, historical imagery, and other raster data in one system alongside vector data.

Transform analyst workflows

Use web-based and desktop software to visualize and interpret imagery in an efficient and accurate way.

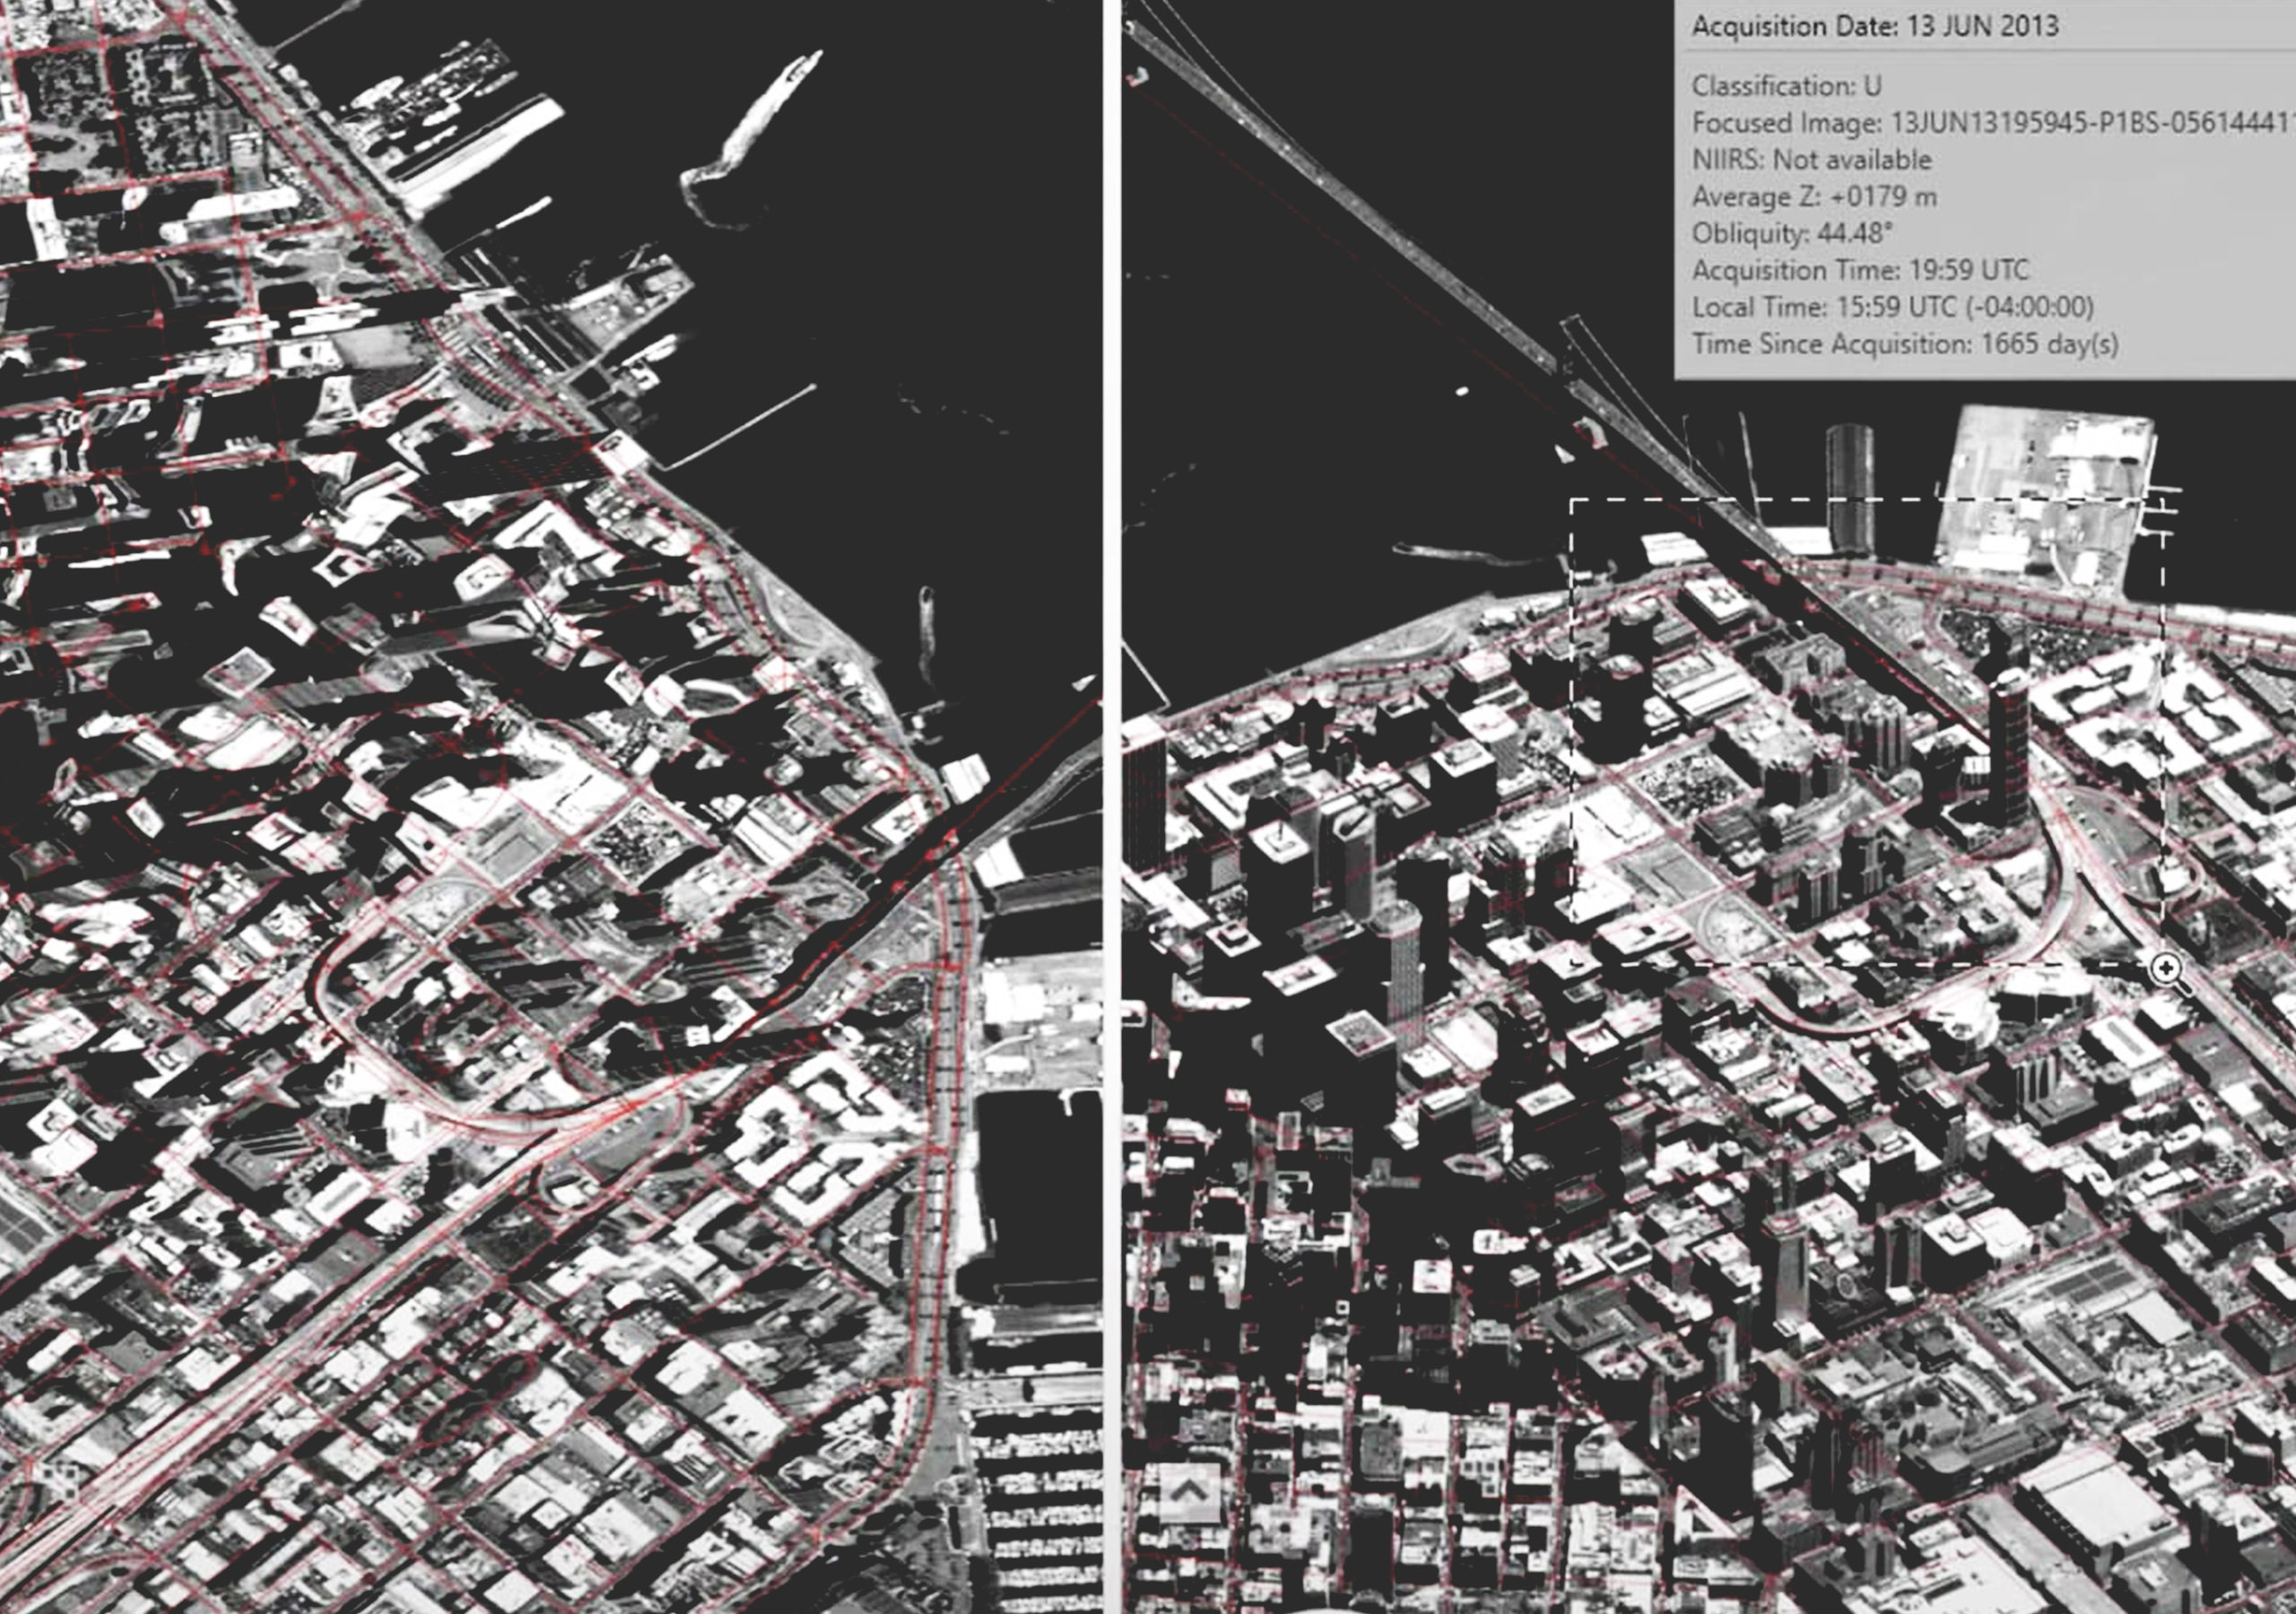
A slider shows a black-and-white, off-nadir image of a waterfront city before and after correction for distortion Distortion-free image visualization

View imagery as collected by a sensor. Improve oblique imagery interpretation, data capture, and image mensuration when map features are displayed in image space. Geospatially link image and map spaces to better understand what's happening on the ground.

Make measurements and markups from imagery

Use a collection of mensuration tools that take accurate height, distance, point, angle, perimeter, and area measurements. Create markups on oblique imagery while maintaining its geospatial reference information.

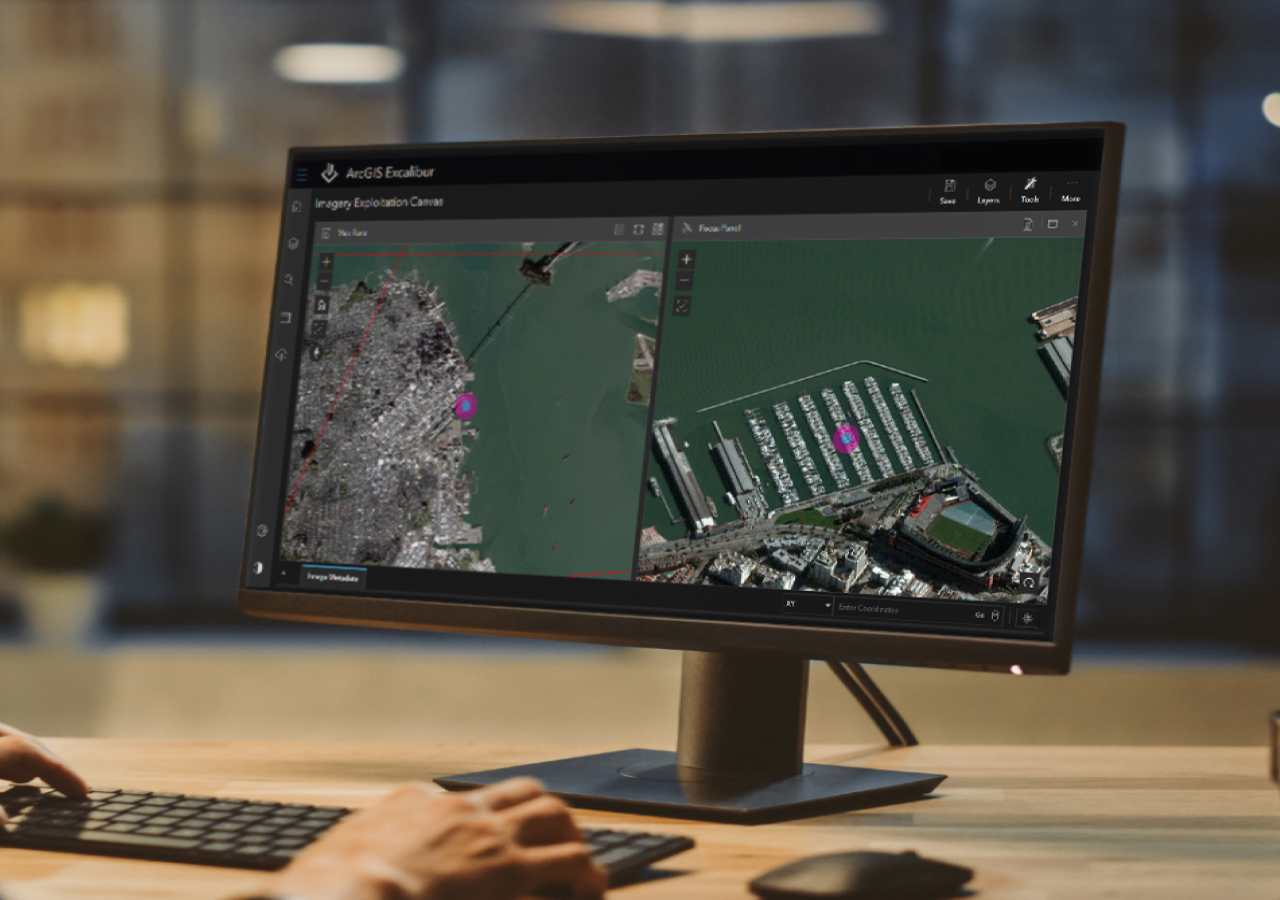
A laptop screen showing a side-by-side image of a port, land, and boats in ArcGIS Excalibur representing the Flash tool Find the location of an object in an image on a map

Quickly find the location of an object in an image or video on a map. Click on the object in the image panel and easily navigate to the corresponding map panel location.

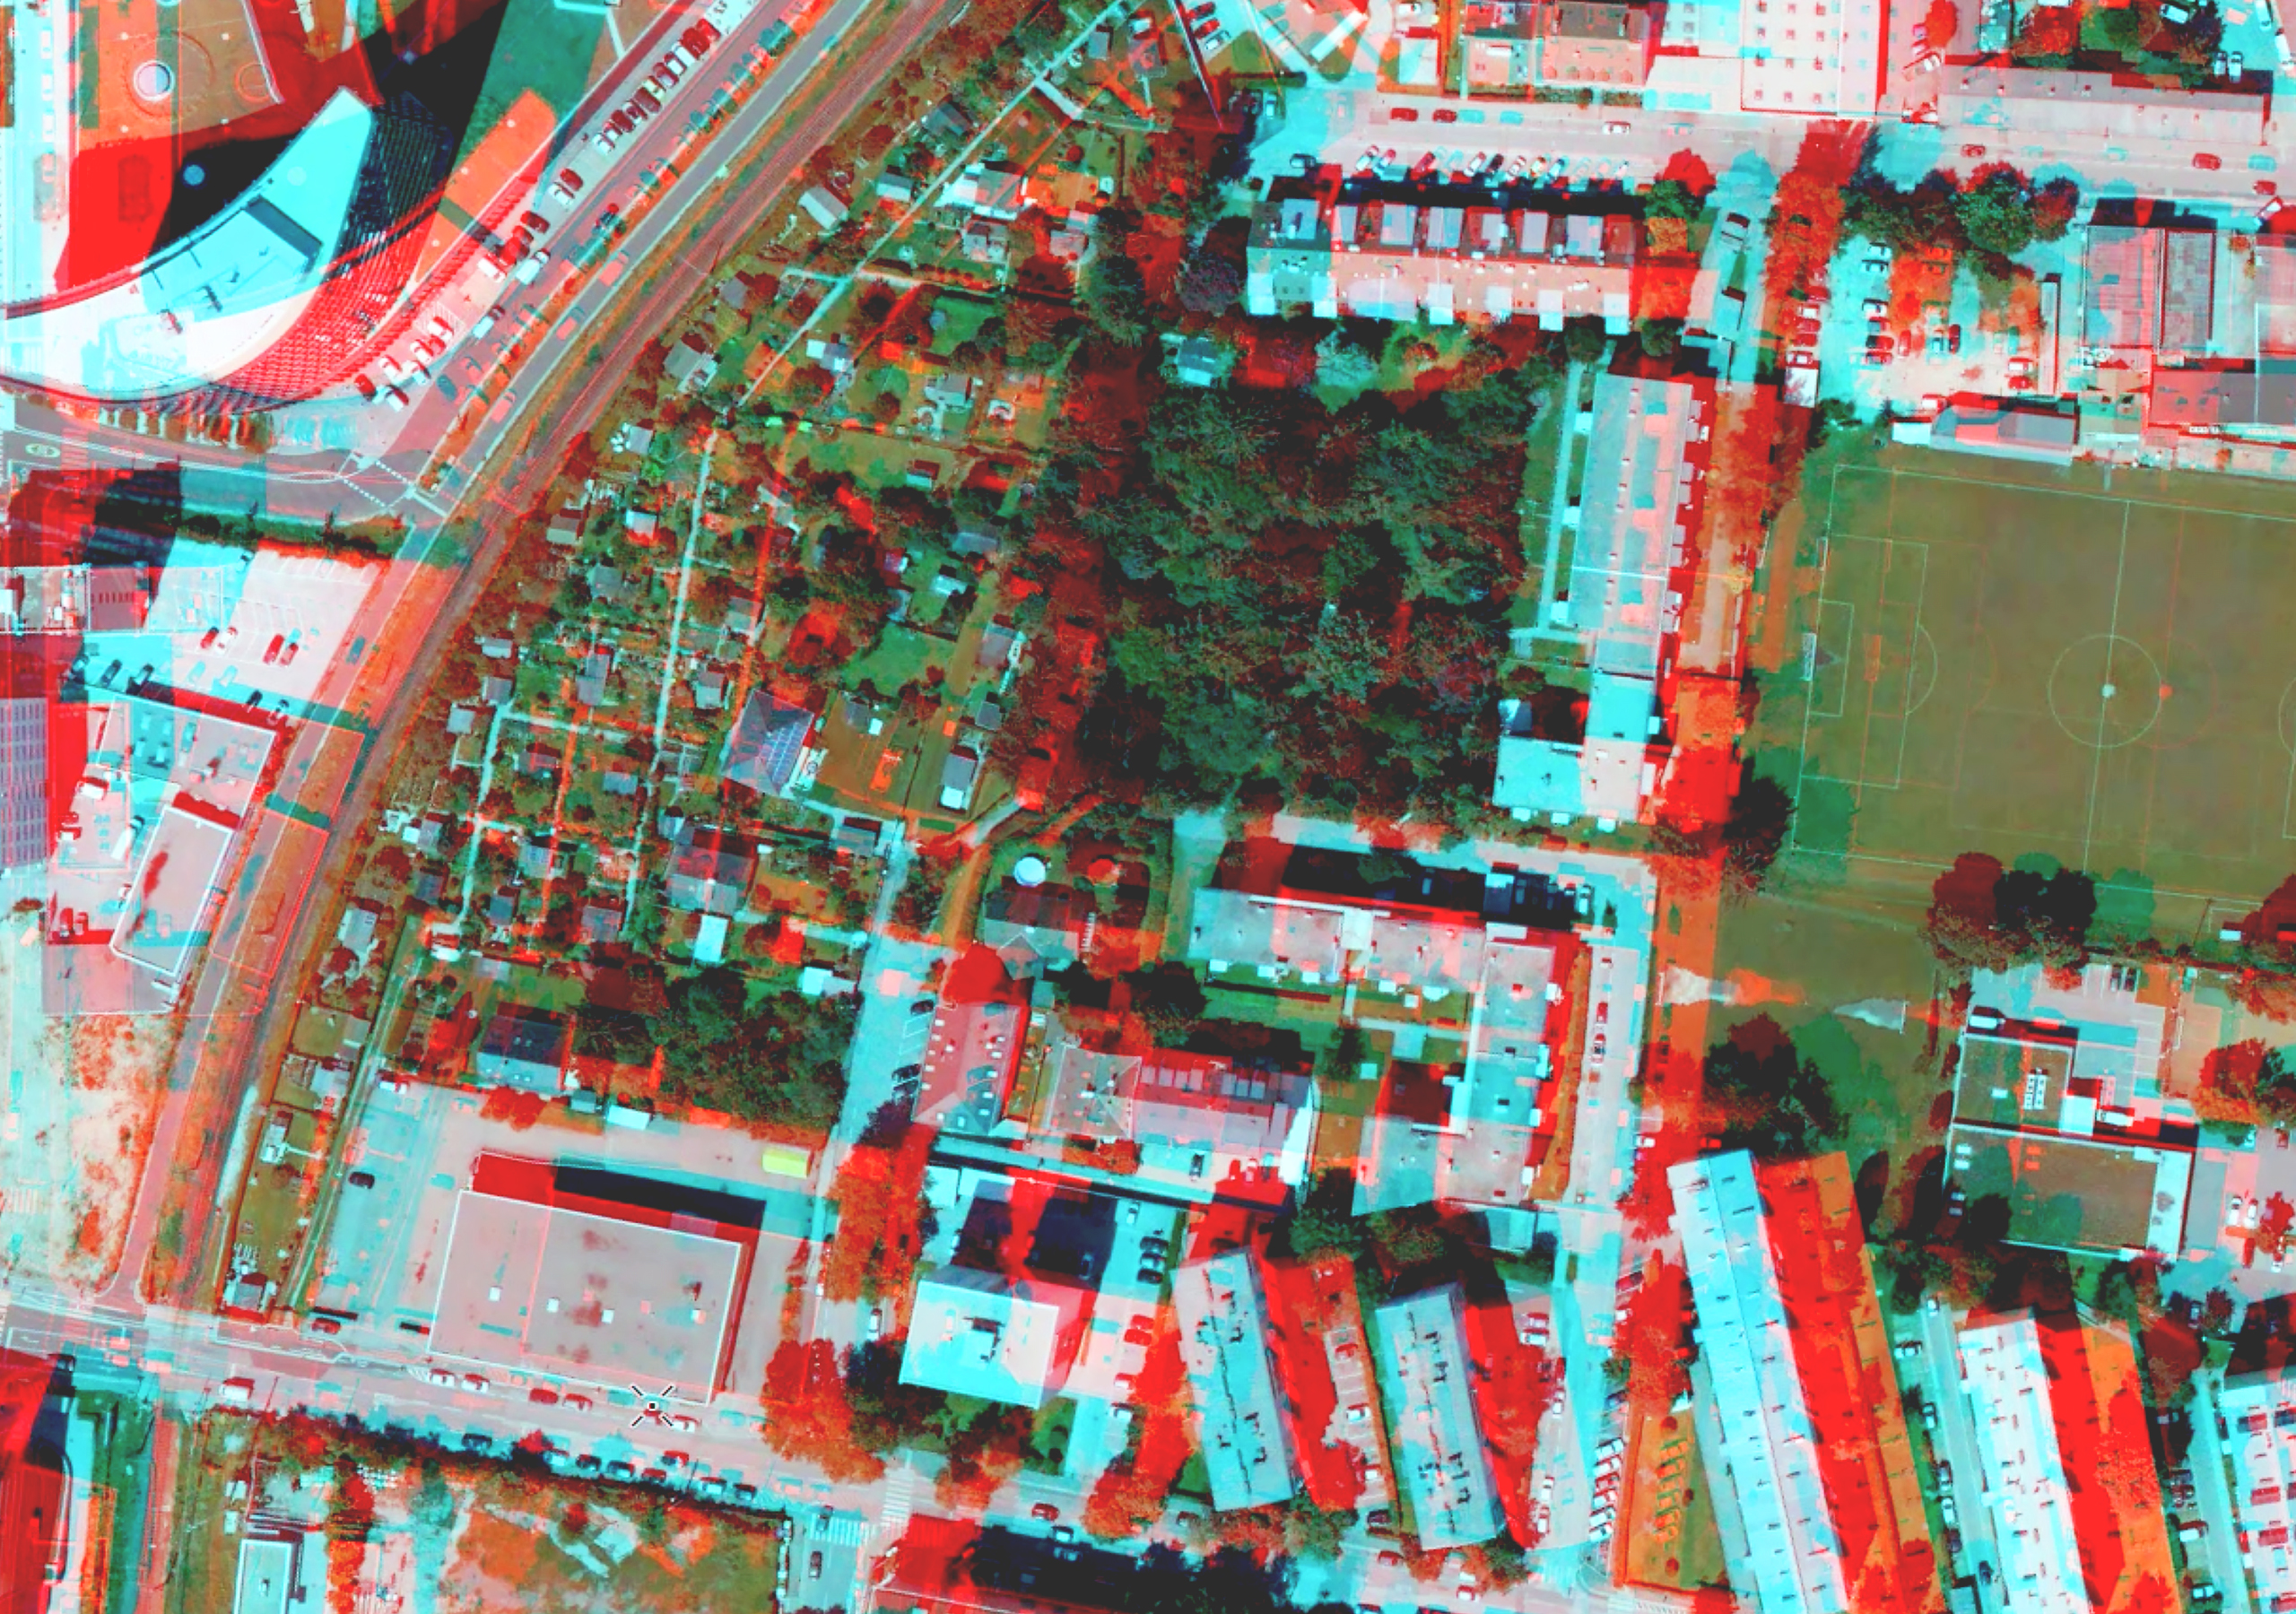
A stereo map of a dense residential area shows a red overlay where features can be shown in 3D Capture features in stereo

Interpret stereo imagery to accurately measure 3D features from satellite, aerial, and drone imagery. Collect 3D features for workflows such as vector mapping and measuring distances and heights.

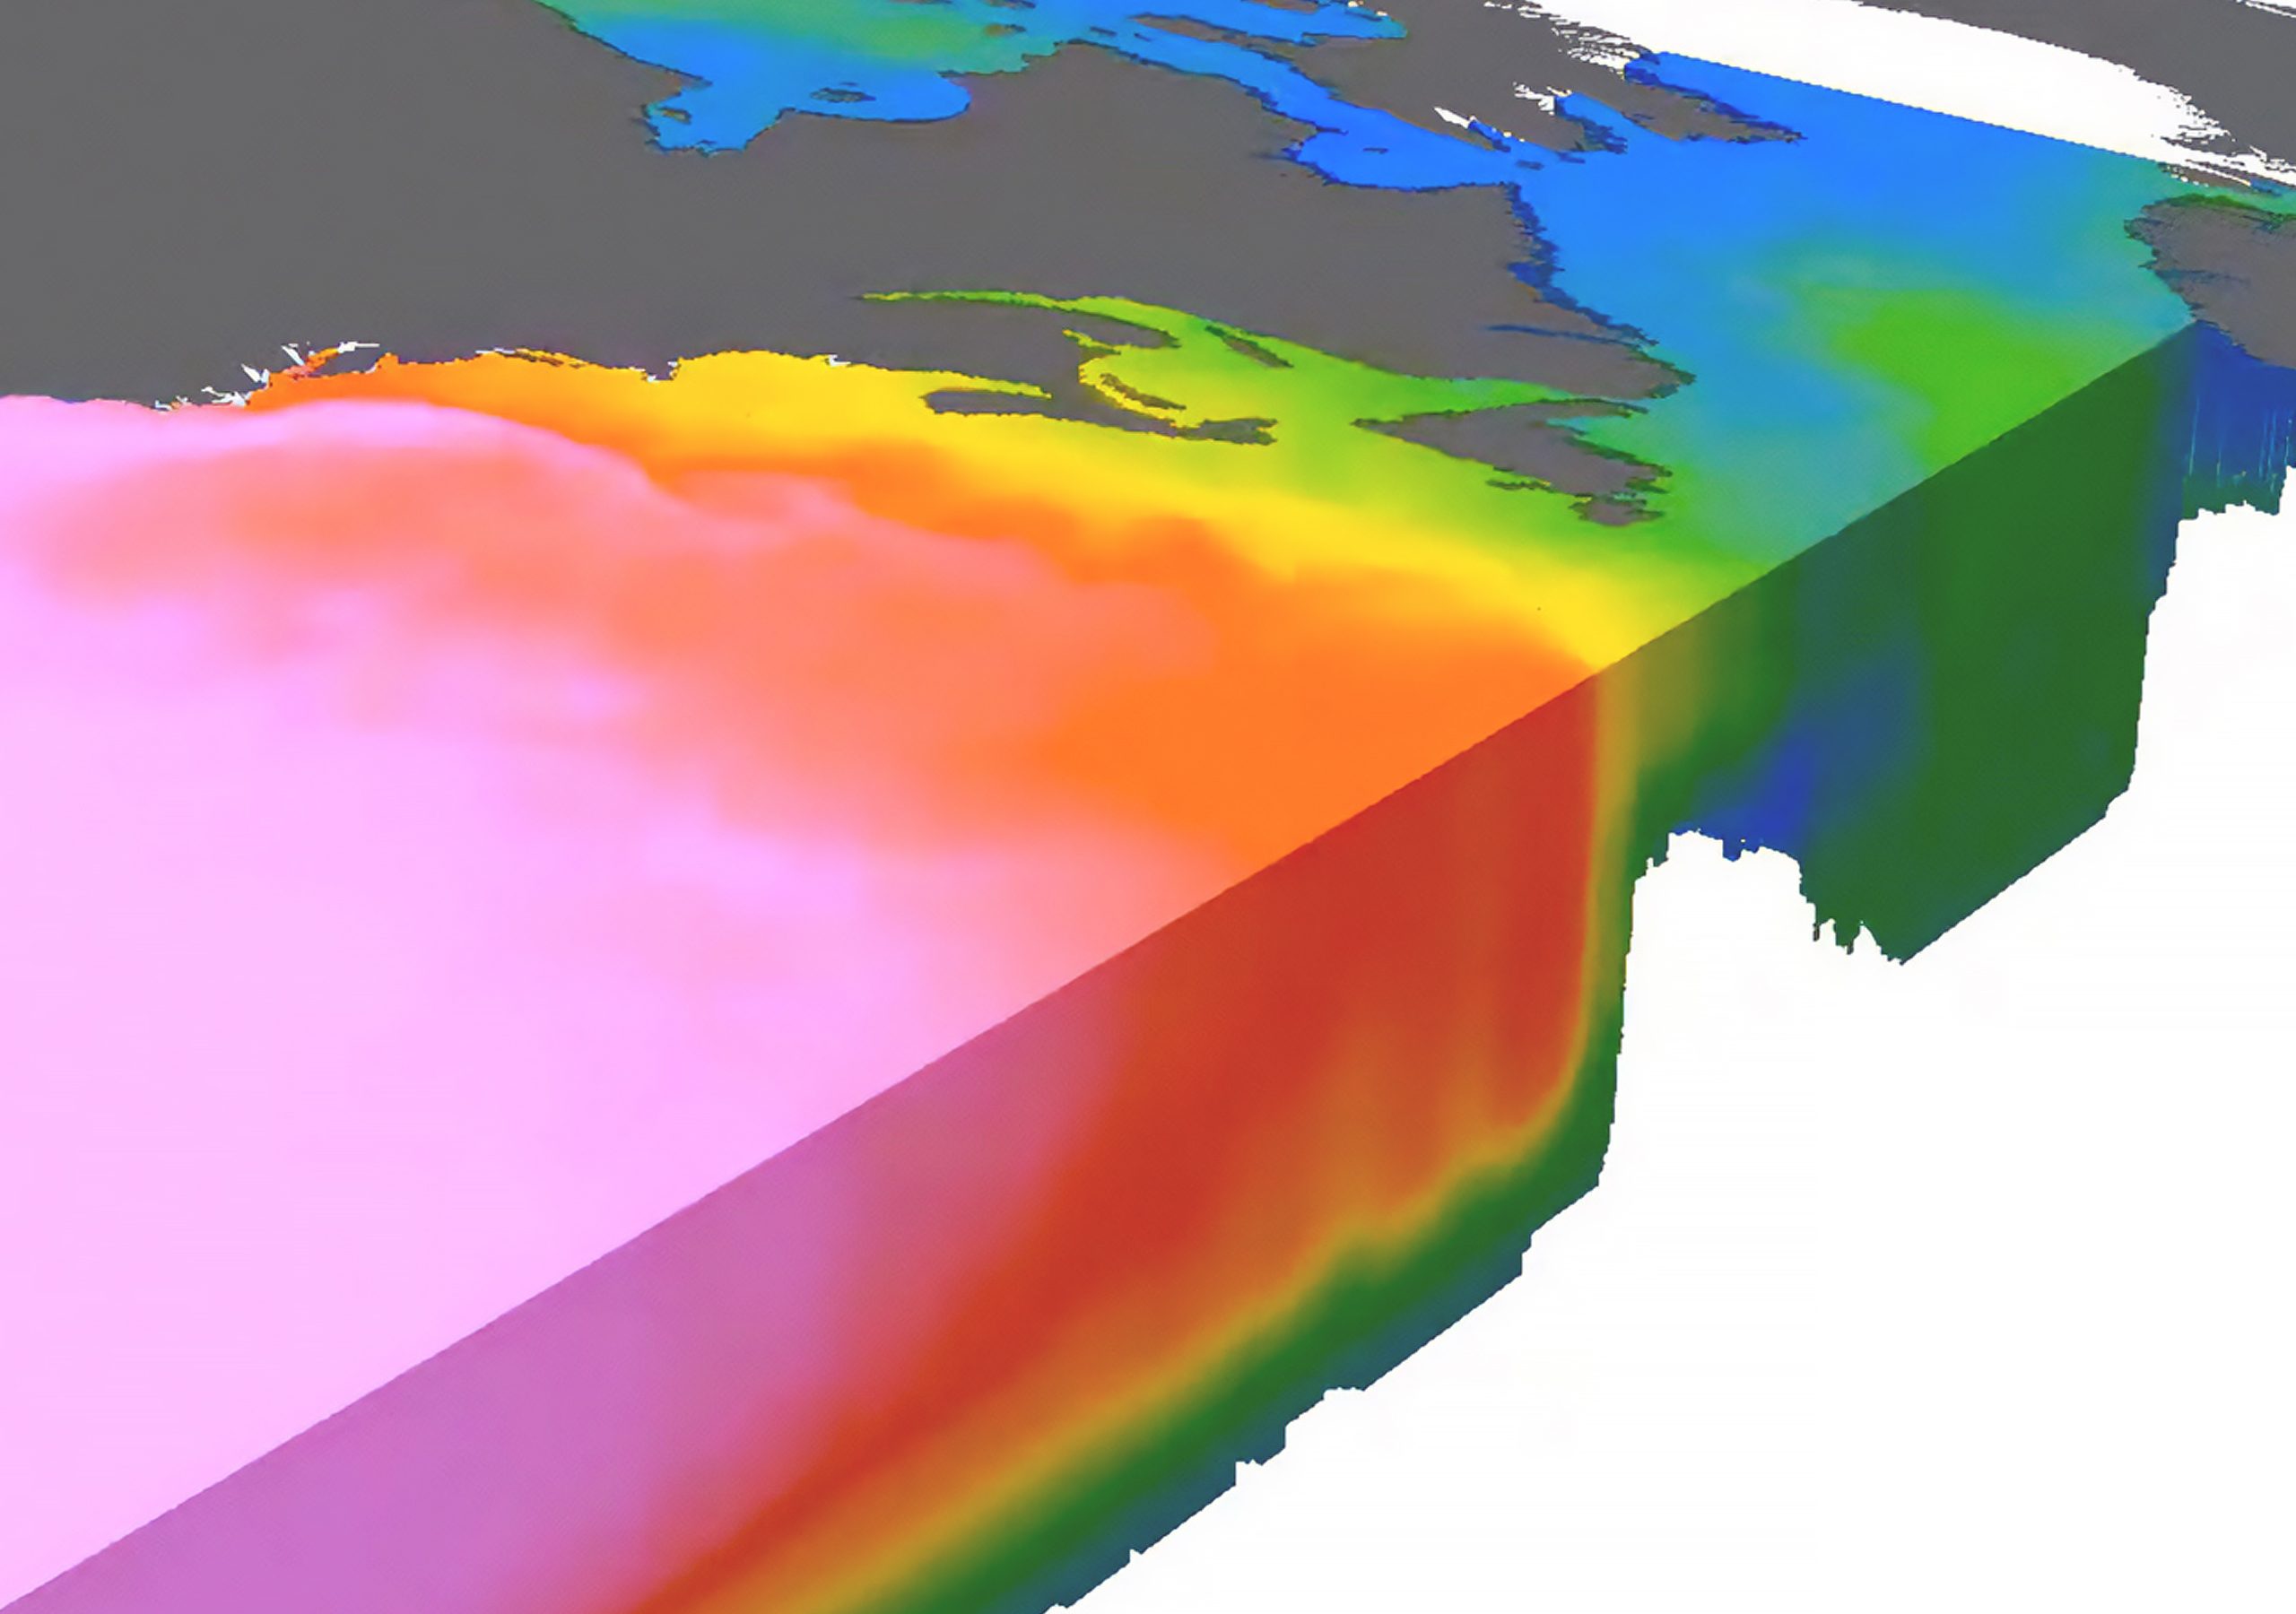
A map created using voxel layers shows multidimensional data in a gradient of pink, red, yellow, green, and blue Interactively explore multidimensional data

Step through time and dimensions when visualizing data such as atmospheric and oceanic data. Visualize voxel cubes in 3D using time animations and other interactive exploration features.

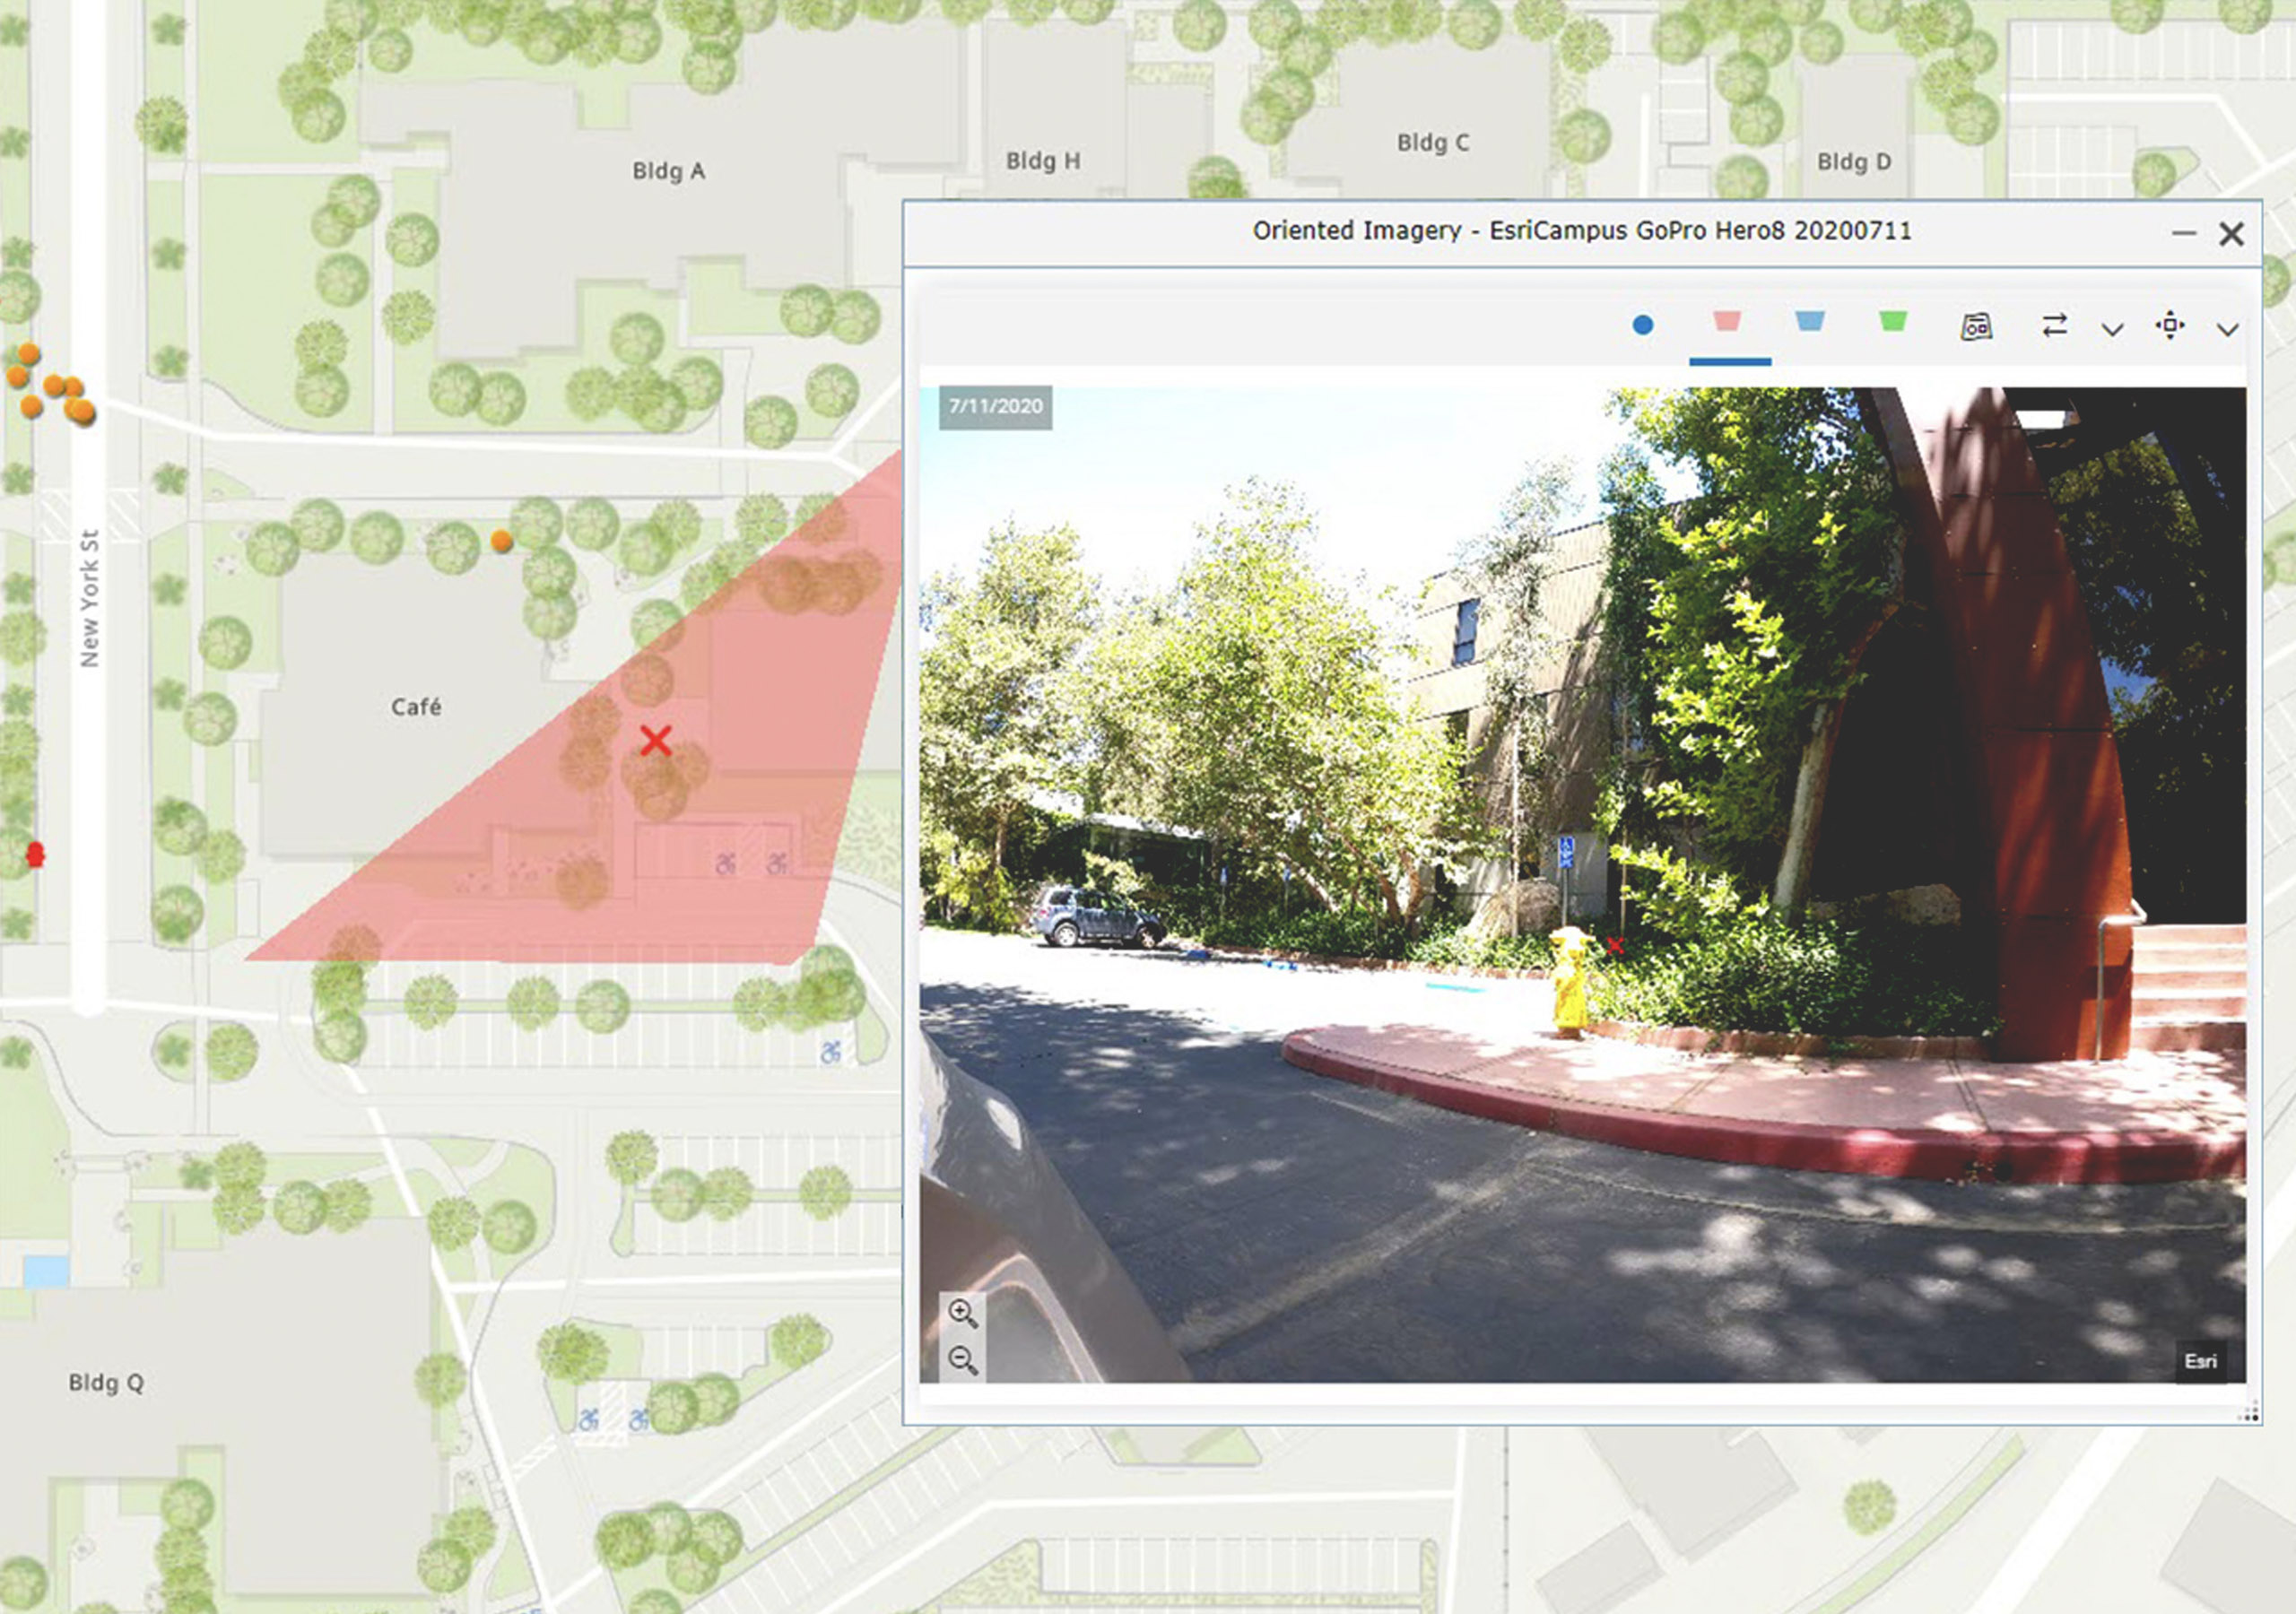
A digital map of a business campus has a location marked with a red x, and an overlay image shows that location at street level Visualize street-level imagery

Work with non-vertical imagery, including oblique images, panoramas, and imagery taken from mobile cameras. View assets from multiple directions, superimpose the display of features on the imagery, take measurements, record, and annotate features.

Explore motion imagery in ArcGIS

Video content has become a valuable and widespread source of information. ArcGIS Video Server for ArcGIS Enterprise enables indexing, searching, publishing, and streaming video as a service with geospatial and temporal context. Incorporate video into your analysis to derive meaningful insights.

Previous
Next

Create intuitive experiences that power problem solving

Quickly include imagery from multiple sensors and sources in your storytelling. Turn observations and analysis results into interactive desktop, web, and mobile apps and dashboards that anyone can understand. Build shareable tools at any level of expertise with no-code, low-code, and developer tools.

Drone imagery shows the Mt. Everest base camp full of yellow and blue tents, surrounded by snowy mountains

Esri solutions for image visualization

Previous
Next

Get help finding the right solution

Connect with an Esri sales consultant to explore how imagery and remote sensing can enhance your decision-making, analysis, and operational workflows.

Talk to someone on our sales team

800-447-9778

8:00 AM–5:00 PM, Monday through Friday (PT)

Chat online

Start chat

Contact sales

Get an email response