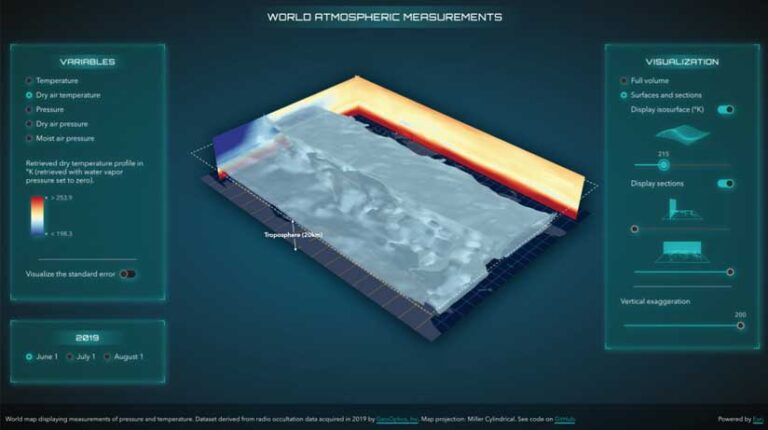
Multidimensional datasets are complex and hard to understand without good visualization tools. This article visualizes a dataset representing atmospheric temperature and pressure measurements using an application built with ArcGIS Maps SDK for JavaScript. View the live application.
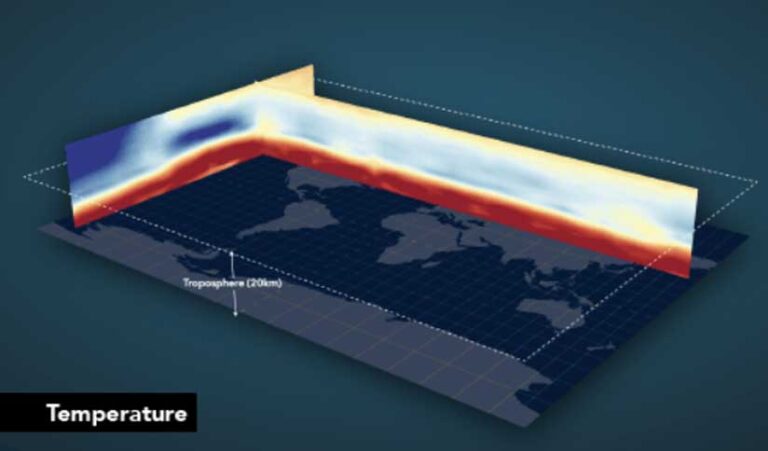
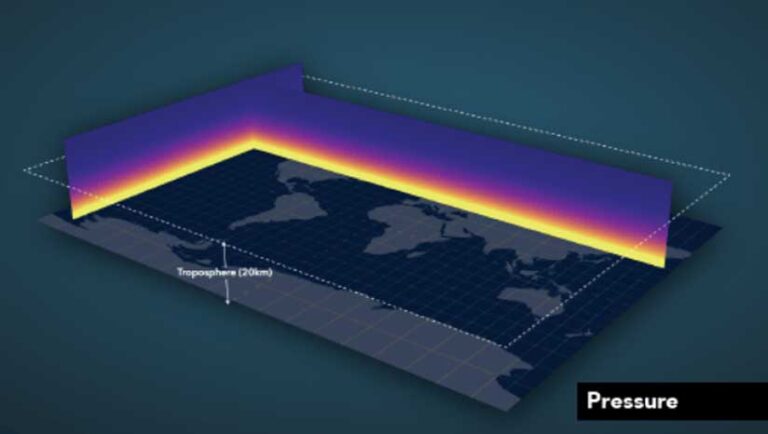
To better understand the application, some explanation is in order. Atmospheric pressure is the force exerted on a surface by the air above as gravity pulls it to Earth. The temperature at different levels of Earth’s atmosphere is influenced by incoming solar radiation; humidity; and, of course, altitude.
How are temperature and pressure measured at such high altitudes? The technique involves a low Earth orbit satellite receiving a signal from a GPS satellite. When it passes through the atmosphere, the signal is refracted in a manner similar to the way light refracts when it passes through a lens. The magnitude of the refraction depends on the temperature, air pressure, and humidity. This technique, called radio occultation, produces highly accurate atmospheric measurements, which are used in weather forecasting systems.
The dataset used by the application is provided by GeoOptics, a company that specializes in radio occultations for weather forecasts. Each occultation event lasts less than a minute and produces a linear profile of between 350 and 400 observations from the top of the atmosphere to the bottom. The data acquires heights that range from an altitude of 30 kilometers to ground level. The initial dataset contained approximately 600 occultation profiles that were used to interpolate the measurements into a 3D surface. The geostatistical interpolation method used was empirical Bayesian kriging 3D. Using GA Layer 3D to netCDF in the Geostatistical Analyst toolbox in ArcGIS Pro, the 3D surface was exported to a netCDF file, which can then be viewed as a voxel layer.

Exploring a Voxel Layer with ArcGIS Maps SDK for JavaScript
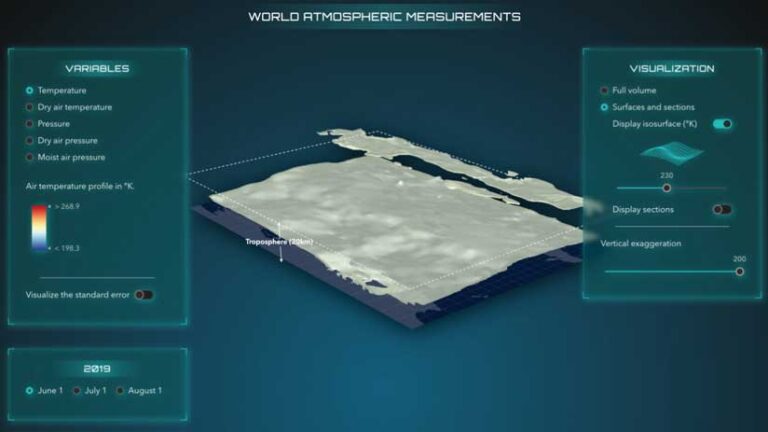
A voxel layer is a representation of multidimensional spatial and temporal information in a 3D volumetric visualization. This type of layer can be published to ArcGIS Online and visualized in a browser. View the voxel layer used in the application.
Variables
The voxel layer stores the spatial coordinates x,y and z and values for pressure and temperature variables over three days. Within ArcGIS Maps SDK for JavaScript, information about variables can be viewed by accessing the array voxelLayer.variables. For this layer, the temperature variable has the metadata shown in Listing 1.
{
description: “temperature_Prediction”,
id: 10,
name: “temperature”,
unit: “degree_K”
}
Listing 1
Temperature can be visualized by setting the current variable ID on the layer using:
voxelLayer.currentVariableId = 10;
Change the time variable by setting the time extent on view.timeExtent. Visualizing different time periods allows the comparison of pressure and the temperature. The pressure changes almost linearly with altitude, whereas temperature fluctuates much more because it depends on not only altitude but also solar radiation and humidity.
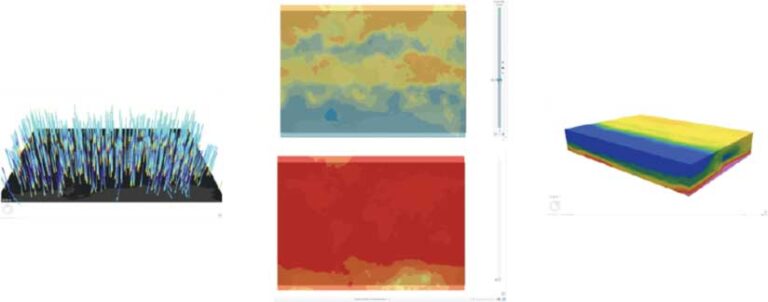
Rendering
A voxel layer can be rendered as a volume or as surfaces. To switch between the two modes, set the voxelLayer.renderMode property to either volume or surfaces.
Depending on whether the variable is continuous or discrete, it can be rendered using stretch symbology or unique values. Each variable has its own symbology saved in voxelLayer.variableStyles. This example has only continuous values for temperature and pressure, so they should be rendered using the stretch symbology.
The variableStyle.transferFunction defines how the values are stretched between a minimum and maximum value that is associated with a color scheme. In case a variable has discrete values, the unique values are defined in variableStyle.uniqueValues.
Isosurfaces
If the variable is continuous, isosurfaces—surfaces with the same variable value—can be created. In a voxel layer, up to four isosurfaces can be visualized at the same time. Isosurfaces are stored as part of the variable styles. For example, to get the isosurfaces for a selected variable, call voxelLayer.getVariableStyles(variableId).isosurfaces.
In the demo application, surfaces are generated dynamically to explore the whole dataset. How does that work? When the variable is switched, the information about the range of values for that variable is available and the range is connected to a slider. As the user moves the slider, a single surface is created with the value of that slider, as shown in Listing 2.
const createIsosurface = value => {
const style = layer.getVariableStyles(selectedVariable.id);
const color = layer.getColorForContinuousDataValue(selectedVariable.id, value, false);
if (style) {
style.isosurfaces = [
{
value: value,
enabled: true,
color: {…color, a: 0.8},
// if the color is not locked, we can override it
colorLocked: false,
},
];
}
};
Listing 2
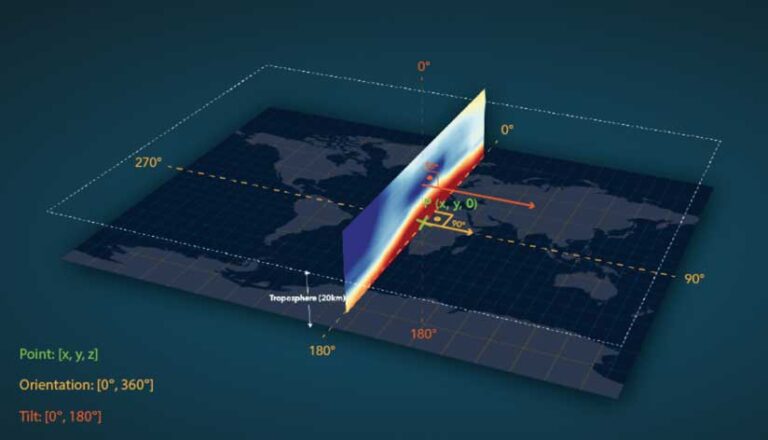
Sections
A section is a two-sided vertical or horizontal plane cutting through a voxel layer. Creating sections allows analysis of profiles in the data. In ArcGIS Pro, a section can be locked so that it also displays when changing the variable so that several variables can be compared. ArcGIS Maps SDK for JavaScript can’t create locked sections, but it can be used to visualize locked sections created in ArcGIS Pro.
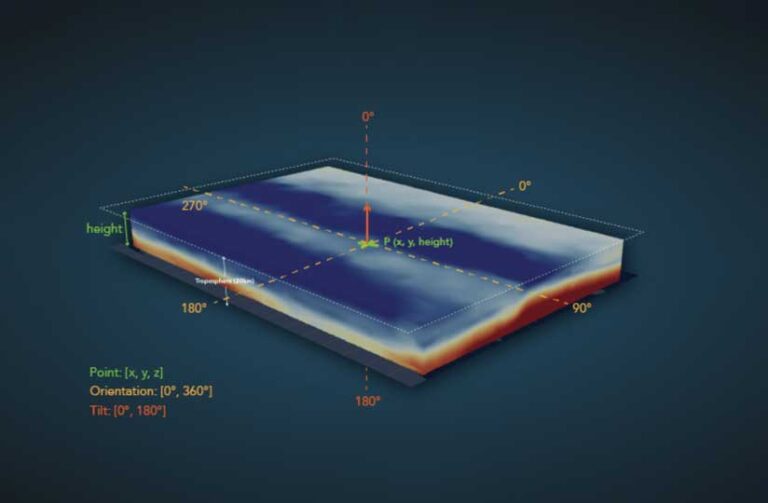
In this application, dynamically generated sections allow exploration of vertical temperature profiles at any location. To define a dynamic section, set a point at which the plane should pass through, an orientation, and a tilt angle for the plane.
Because the point is defined in voxel space, the voxel dimensions will need to be retrieved using this code:
const dimensions = voxelLayer.getVolume().sizeInVoxels;
The code in Listing 3 generates a section that passes through the center of the voxel layer and is oriented from north to south .
layer.volumeStyles.getItemAt(0).dynamicSections = [
{
enabled: true,
orientation: 90,
tilt: 90,
point: [Math.floor(dimensions[0] / 2), 0, 0],
},
];
Listing 3
Note that the y- and z-coordinates of the point can have any value within the voxel space; with the given orientation and tilt, x is the coordinate that sets the position of the plane.
Slice the Layer
Slices can be used to define areas of interest. Slices apply to both volume and surfaces visualizations. In our application we’re slicing the layer not only vertically from east to west and south to north, but also horizontally from top to bottom. Similar to a section, a slice is also defined by a point, an orientation, and a tilt value as shown in Listing 4. Using the example of slicing from top to bottom, the slice can have any orientation so the tilt is 0, and the point’s z-axis is important to give the height at which we want to slice the layer.
const getSlice = height => {
return new VoxelSlice({
tilt: 0,
point: [0, 0, height],
});
};
Listing 4
Change the Vertical Exaggeration
This application needs vertical exaggeration to see the variation of the values on the z-axis. To change the exaggeration within ArcGIS Maps SDK for JavaScript, set it using volumeStyle.exaggeration.
Learn More About Voxel Layers
This article showed just a few of the voxel layer capabilities on the web. Learn more about using voxel layers in the ArcGIS Developers documentation, which includes sample code and an API reference.
About the author