For the last 30 years a growing number of experts and analysts have developed, validated, and lately are popularizing what appears to be a better way to represent where people are located. Specifically, this better way is based on a global high-resolution gridded representation of human settlement.
Such population models estimate statistical surfaces of population density and can be used directly to estimate population, or as a basis to apportion population from polygons representing census tabulation areas. The resultant gridded population estimates provide a sharpened focus on where these populations live or engage in daily activities.
For the last several years organizations, including Esri, have been participating in the POPGRID Data Collaborative to work together to improve methods, outcomes, and the overall value of gridded population.
In addition to the goal of increasing the general understanding of the value of gridded population estimates, POPGRID.org is organizing and expanding the international community of data providers, users, and sponsors of georeferenced data on population, human settlements, and infrastructure. The organization seeks to improve data access, timeliness, consistency, and utility. It supports data use and interpretation through identifying and addressing pressing user needs. POPGRID works to reduce duplication and user confusion and encourages innovation and cross-disciplinary use.
POPGRID.org regularly meets with the organizations that most need reliable population data. The mission-driven work of various United Nations agencies such as the Office for the Coordination of Humanitarian Affairs (OCHA) and the United Nations Population Fund (UNFPA), the Gates Foundation, The World Bank, and others provides requirements for justifying the use of and requirements for producing trustworthy verifiable, geospatial analysis outcomes with gridded population products.
One of these requirements is a global collection of high-resolution annual population estimates capable of illustrating local changes in total population and five-year age and sex cohorts. In December 2021, Esri and WorldPop.org announced the release of such a collection in the ArcGIS Living Atlas of the World. WorldPop.org is part of the University of Southampton. The datasets, funded by the Bill and Melinda Gates Foundation, resulted from collaborations with the Center for International Earth Science Information Network (CIESIN) and the University of Louisville.
This collection is available as three layers that are freely available for use anywhere in the ArcGIS system or via http and REST. These layers are unique and remarkable for many reasons. Foremost is the composition of the collection: 21 globally complete annual estimates of 38 global population variables beginning in 2000 through 2020.
In raw form, WorldPop.org makes this data available by country by variable. This data, which covers 249 countries and 38 variables and spans 21 years, is contained in nearly 200,000 TIFF files that anyone can download. These files were combined into global extent rasters that represent total population, population density, and five-year age and sex cohorts. Instead of making 798 image services, a relatively new technology was used—multidimensional raster storage in Esri’s Cloud Raster Format (CRF). This technology allows this data to be made available in just three image services.
The initial release contained 1-km resolution datasets for total population, population density, and population cohorts.
- WorldPop Total Population 2000–2020 1 km—Annual estimates of total population per cell for the years 2000–2020 at 30 arc-second resolution (approximately 1 km at the equator).
- WorldPop Population Density 2000–2020 1 km—Annual estimates of population density in persons per square kilometer for the years 2000–2020 at 30 arc-second resolution (approximately 1 km at the equator).
- WorldPop Population Cohorts 2000–2020 1 km—Annual estimates of age and sex population cohorts per cell for the years 2000–2020 at 30 arc-second resolution (approximately 1 km at the equator).
These layers all represent the coarsest resolution of unconstrained gridded population data from WorldPop. [Unconstrained gridded population data is estimated over all land grid squares globally.] WorldPop.org and Esri are currently working to make the finer, 100-meter resolution, data available later this year. Esri plans to add each new year of population estimate data as it is produced by WorldPop.
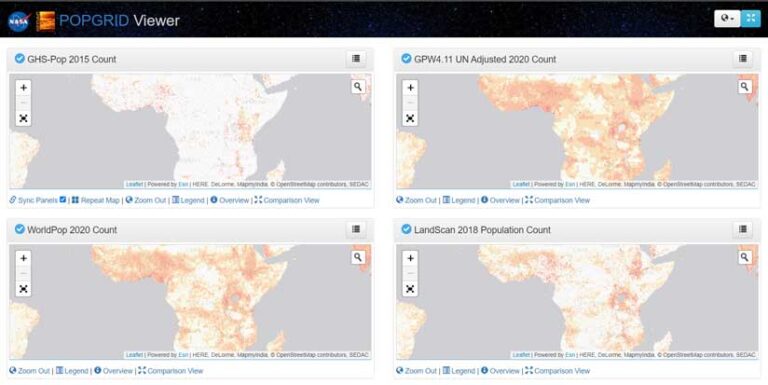
However, there are limitations to the methods and many uncertainties within the data. For instance, all countries of the world do not conduct their censuses in the same way or at the same time. Learn more about gridded population and the challenges in producing global population estimates by reading “WorldPop gridded population estimate datasets and tools: How are they different and which should I use?” and “The spatial allocation of population: a review of large-scale gridded population data products and their fitness for use.” Use the POPGRID Viewer (https://bit.ly/3sA6edf) to compare different gridded population datasets.
Gridded Population Layers in ArcGIS Online
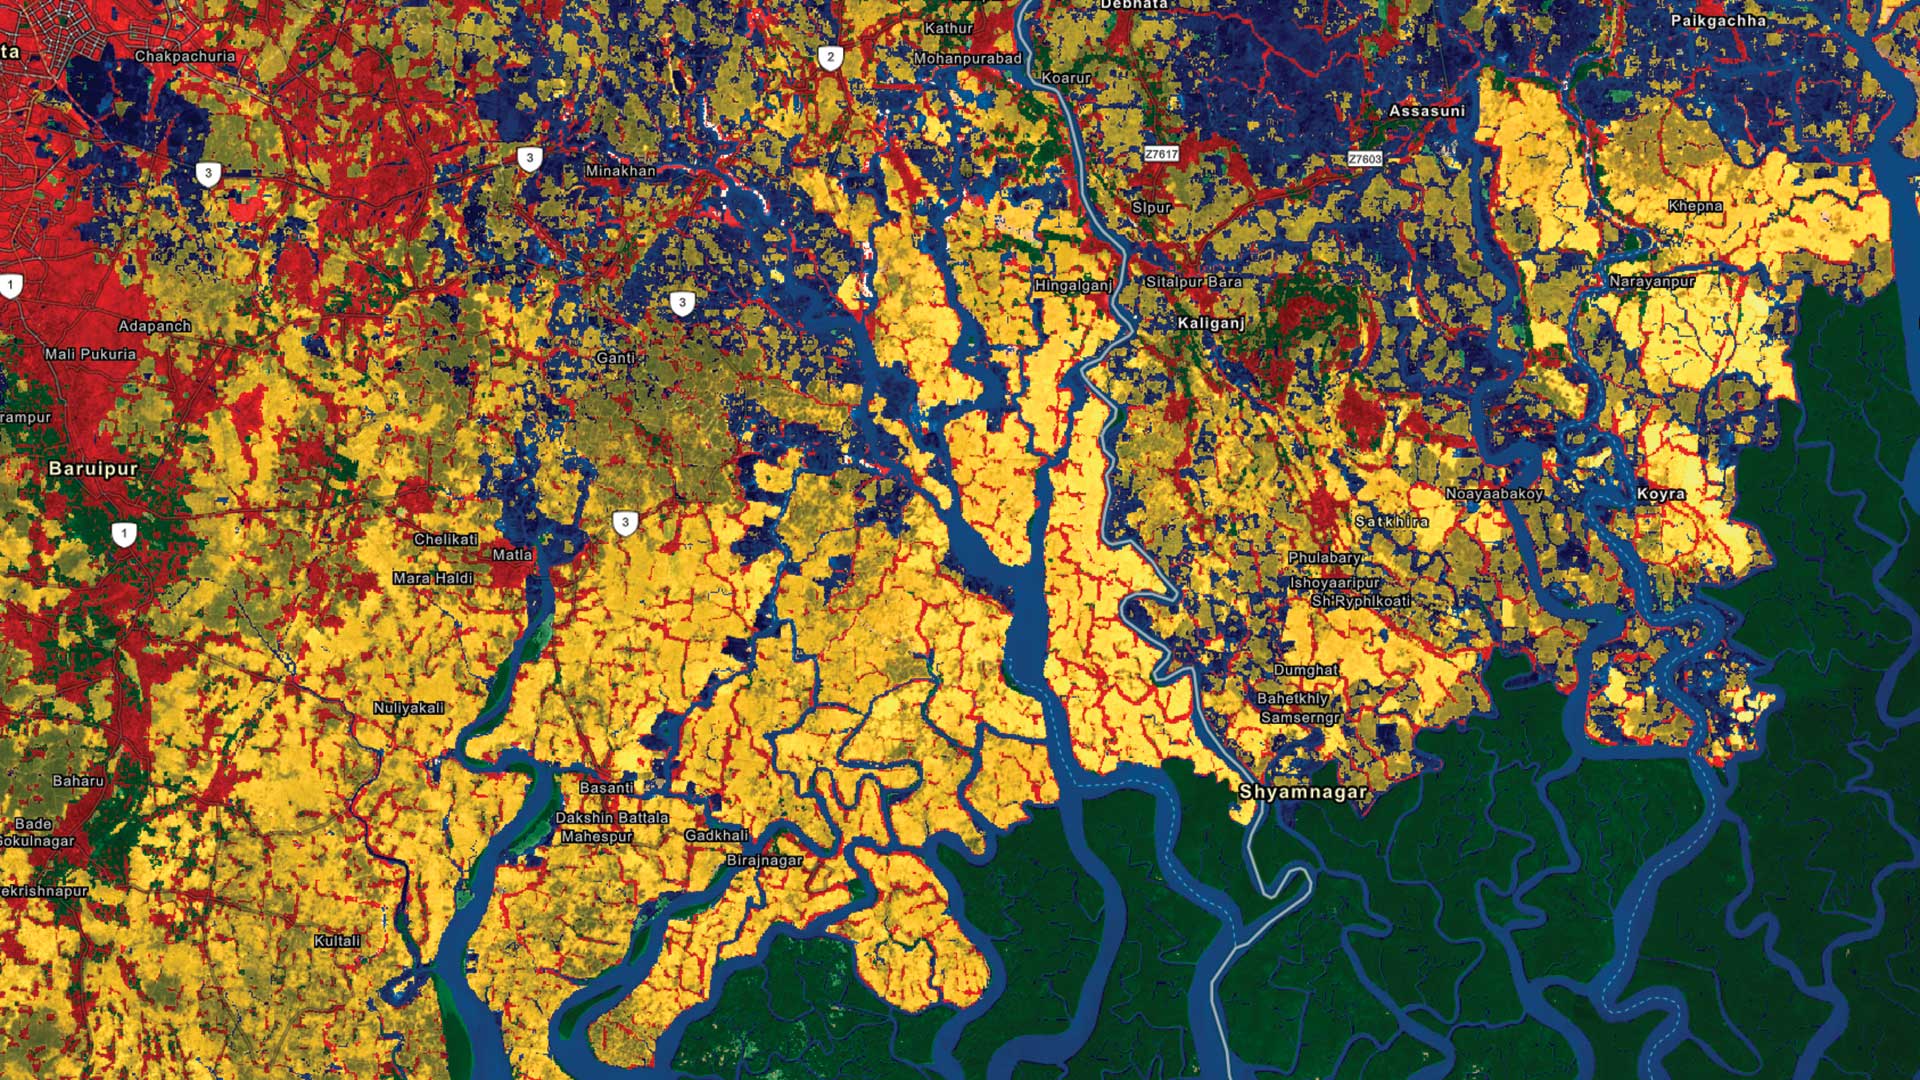
The Population Density layer is the best way to show population because values at each location are normalized to units of persons per square kilometer. Without this normalization, even raster datasets can present misleading density-like depictions when showing total population, leading readers to interpret higher densities than actually exist the further they pan or zoom away from the equator.
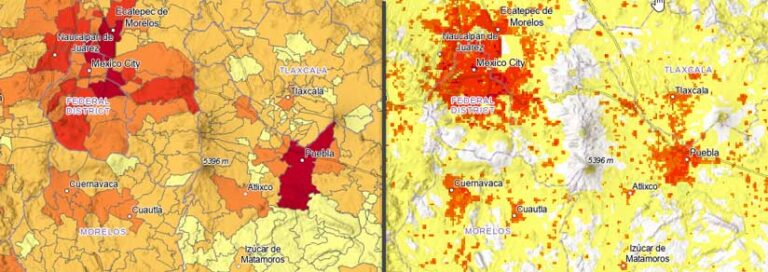
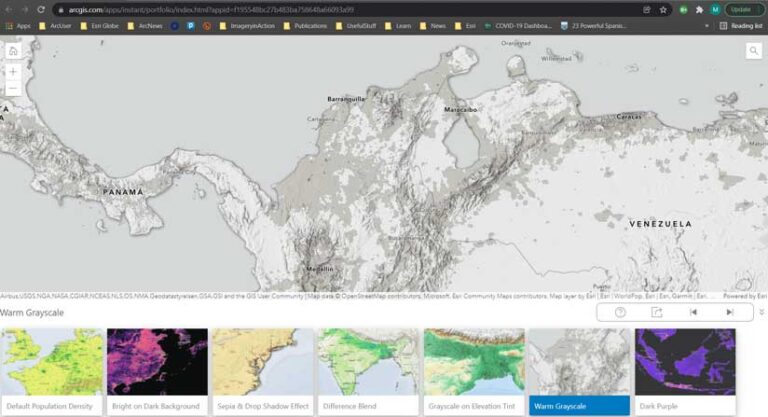
To show the variety of ways population density can be used in a web map, the author created a web app that illustrates seven different techniques for displaying the Population Density layer. Click one of the tiles at the bottom of the app, and then click the info icon on that tile to show examples, information, and a link to the instructions on reproducing that style.
Performing Analysis in ArcGIS Pro
While many analysis tasks are possible with this data, zonal statistics in ArcGIS Pro is one of the most common. This analysis finds the sum of the population estimated to live within the area of any given polygon.
- To get started, open ArcGIS Pro with a project that has a map.
- On the Map tab, click Add Data.
- On the left side of the Add Data window, expand the Portal node and choose Living Atlas.
- In the upper right of the Add Data window, enter WorldPop into the Search text box. This will result in three options.
- Select WorldPop Total Population 2000-2020 1km and click OK.
- In the map’s Contents, select the WorldPop Total Population 2000–2020 1 km layer. This will cause the multidimensional tab to appear. Click on this tab to show the tools for working with multidimensional layers.
In the Multidimensional tab, starting from the left side, the Variables list should contain Total Population. Then StdTime is a dimension for these layers, and each year of data will be shown as a choice. This can set the layer to use All (default), just one year, or a range of years. On the right side of the Multidimension tab are tools.
The most common task with gridded population data is to find out how many people living in a given area would be impacted by an event such as an epidemic or natural disaster. The Zonal Statistics as Table tool is the fastest way to learn how many people live in an area or zone.
To use this tool, a polygon layer with a feature or features representing the area of impact is also needed. The tool will produce a table containing rows for each feature in the input polygons, and columns for the unique ID of each feature, and population.
Use ArcGIS Online or ArcGIS Pro to explore the WorldPop Total Population 2000–2020 1 km, WorldPop Population Density 2000–2020 1 km, and WorldPop Population Cohorts 2000–2020 1 km datasets, available from ArcGIS Living Atlas of the World
Acknowledgments
The author would like to acknowledge the work and support of WorldPop leadership and staff he has collaborated with to create these services, particularly Andrew Tatem, Alessandro Sorichetta, and Maksym Bondarenko.