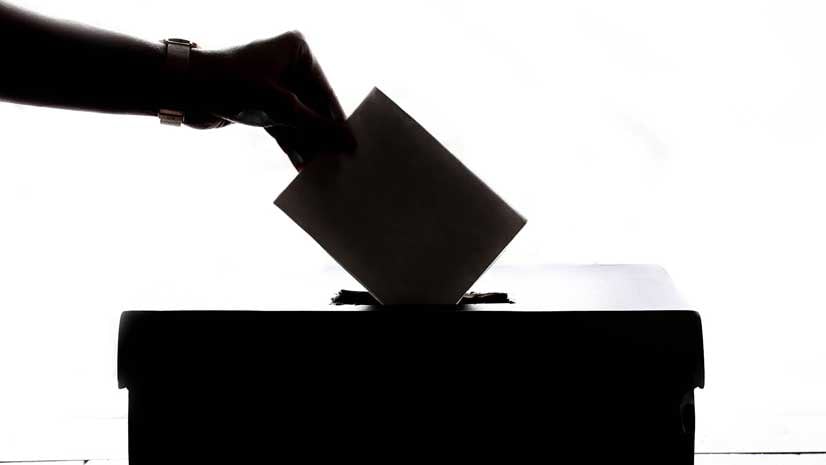
In modern elections, GIS is already common. Now, counties around the country are relying on GIS to adapt voting practices to the realities brought on by the coronavirus disease 2019 (COVID-19) pandemic. Election officials use GIS to analyze polling locations to avoid high-risk venues, increase physical distancing, and take measures that make voting safer for voters and poll workers. Frequently updated web maps can connect voters to polling places where mail-in ballots can be dropped off. GIS has already been used by election officials across the country to safeguard the election process.
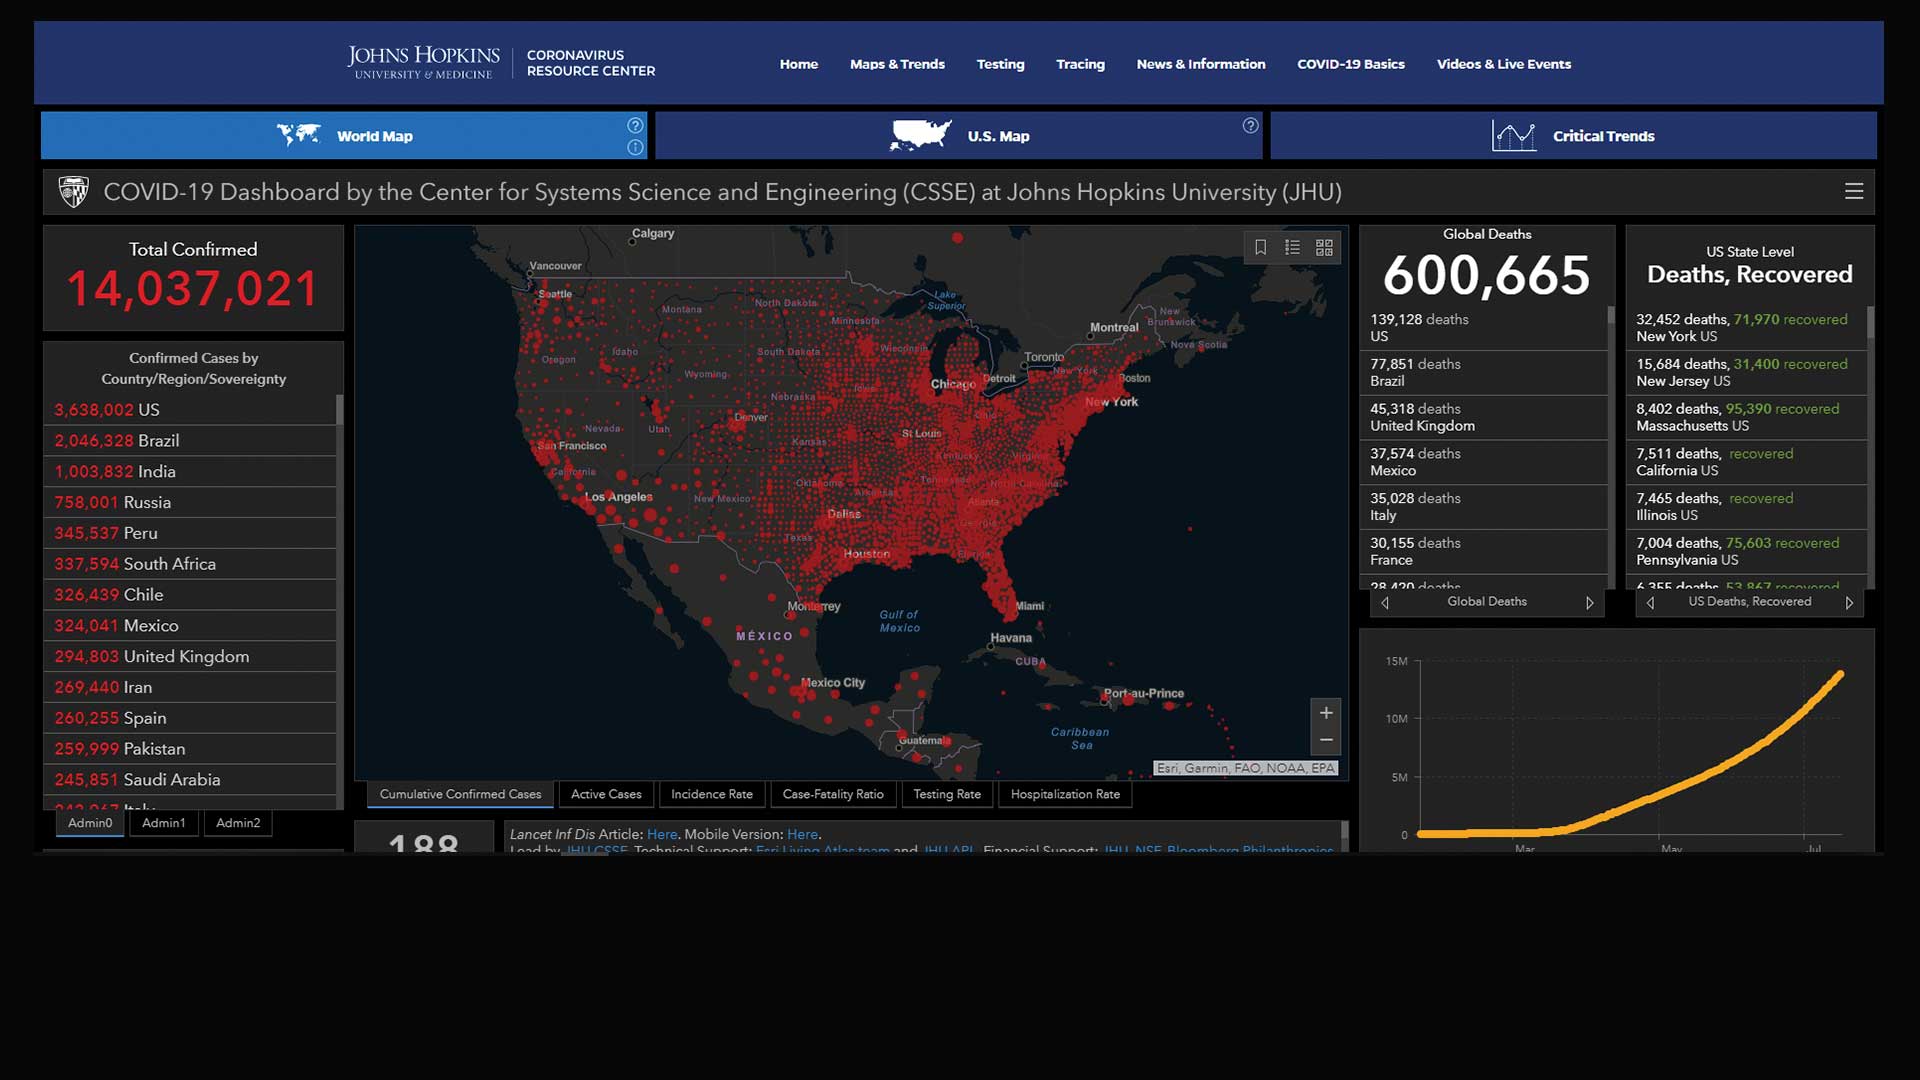
In March 2020, the number of new COVID-19 cases ballooned from nearly zero to upwards of 25,000 every day. The pandemic’s timing coincided with primary season in a major election year. States with primary elections across the country were faced with the same dilemma. It was clear that voting—which attracts large crowds to centralized locations—needed an emergency reassessment.
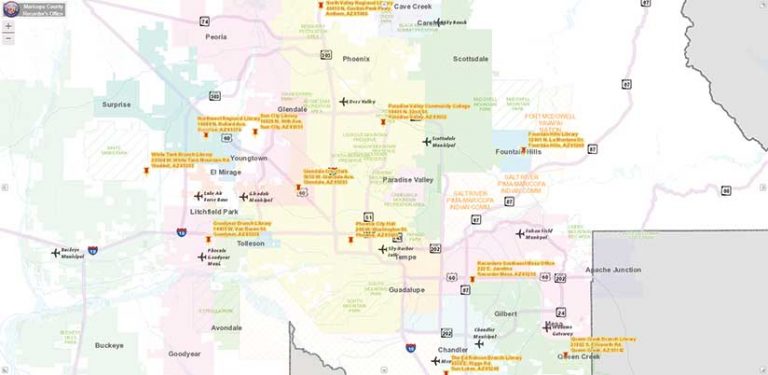
During the two weeks leading up to Arizona’s Democratic presidential primary in March 2020, officials in Maricopa County, which includes most of the Phoenix metro area, were aware that a storm was coming. They quickly shifted to implement new protections for voters and poll workers. Adding to this challenge, protective gear and cleaning supplies that had been ordered had been diverted to California, leaving insufficient quantities to carry out recommended safety protocols.
The logistical challenges in Maricopa County were especially acute. Of the more than 3,000 counties in the United States, Maricopa ranks 4th for population and 15th for size. Only California’s San Bernardino County has a comparably large combination of people and geographic area.
Furthermore, Arizona has emerged as a solidly “purple” battleground state. The ability of Maricopa County’s voters to participate in free and fair elections during an historic pandemic carries consequences far beyond the Salt River Valley.
Although most Maricopa County voters take advantage of the state’s robust mail-in ballot system, and the March election was only for the county’s 800,000 registered Democrats, officials predicted that about 100,000 people would arrive at polling places to vote.
In addition, many traditional polling locations were no longer viable. Senior centers were closed because elderly people are severely at risk for coronavirus infections. Locations that were too cramped for adequate social distancing were also out. As the primary date approached, Maricopa officials engaged in an increasingly frantic attempt to close some locations and establish new ones.
In addition, state law required Maricopa to consolidate polling places so that the total was half the number typically used in a general election. This was a meticulous process that considered in-person voting trends, population centers, and input from community advocacy groups. In 2016, Maricopa had garnered unwanted national attention after miscalculations forced voters to endure long lines at the polls. Since then, Maricopa election officials began using GIS maps to visualize the locations of likely voters and calculate travel times.
For the March election, Maricopa County leaders were able to retool the system of in-person voting by moving to a vote center model, which allows voters to choose from any of the county’s polling locations.
The county’s mapping tools stood ready for repurposing. GIS allowed election officials to ensure equal access throughout the county, while also reducing the risk of further closures at schools and senior living facilities.
The county started acquiring space in places like strip malls. “We can display them on the map, overlay them with heat maps [showing each location’s likely voters], and see where it made sense to put more locations,” said Gary Bilotta, director of IT and GIS for Maricopa County.
“When we first created the map to figure out where to put polling places, we weren’t thinking specifically about using it for this, but it came in handy right when it needed to,” said Bilotta.
Innovative but Out of Sight
The most innovative uses of GIS for elections often occur on the back end and are never glimpsed by voters. As the act of voting has itself become more political, with battles erupting over the placement of polling stations in states such as Georgia, Wisconsin, and Kentucky, municipalities are using GIS tools to ensure fairness.
“When we select a polling location, it’s not just, ‘here’s a good building,’” said Carly Koppes, clerk and recorder for Weld County in northern Colorado. “It’s also ‘here’s a building, and here’s how many potential voters could use it.’ We integrate information on a map with overlays. We can even look and see how many people have used it in the past; and if it’s low, we can see if maybe it’s because there isn’t a lot of population density, or maybe it’s because of transportation.”
The process has helped Weld County find optimal locations for 16 ballot drop boxes for voters to use in lieu of polling stations, adding a layer of social distancing to the voting process.
“We’re more accountable this way. If people worry that their ballot wasn’t counted, we can say, ‘Well, we were at this drop box at exactly this time; so if you dropped off your ballot, it was in there.' "
Encouraging New Ways to Vote
In Utah County, in central Utah, officials use GIS to promote a shift away from in-person voting. “Because of COVID-19, we’re trying to get people to use mail-in ballots, instead of voting on Election Day,” said Andrea Befus, a GIS analyst for the county. “So, we have a whole system that I built for tracking ballots from drop boxes.”
During a period leading up to an election, voters are allowed to use the drop boxes, a process that Befus believes adds a layer of credibility for voters wary of sending their ballot through the mail. A few times a day, officials check the boxes, using ArcGIS QuickCapture and ArcGIS Survey123 to register the time and leave documented proof of their location. When they return to the election office with ballots, they once again register the time and location.
“We’re more accountable this way,” she said. “If people worry that their ballot wasn’t counted, we can say, ‘Well, we were at this drop box at exactly this time; so if you dropped off your ballot, it was in there.”