Making a map is a great way to visualize quantitative data because it shows the data values in combination with location intelligence. However, making a map requires understanding the attributes being mapped. If descriptions of those attributes are a few clicks away, that significantly decreases the time the mapmaker needs to understand the attributes.
The field descriptions of feature layers in ArcGIS Online are a structured place to communicate all details of attribute fields, including:
- Definitions
- Sources
- Vintages
- Units
Expressions for Calculated Fields
These descriptions help analysts navigate the ever-growing corpus of data by putting this field-specific documentation as close to the field as possible. This limits the amount of time analysts need to search for documentation. Analysts use this information to ensure they’re using the right attributes for their purposes.
Many layers in ArcGIS Living Atlas of the World, such as American Community Survey hosted feature layers, USA Census 2020 Redistricting layers, Bureau of Labor Statistics Monthly Unemployment layer, County Health Rankings 2022, and Justice40 Tracts, include long field descriptions.
Learn Definitions
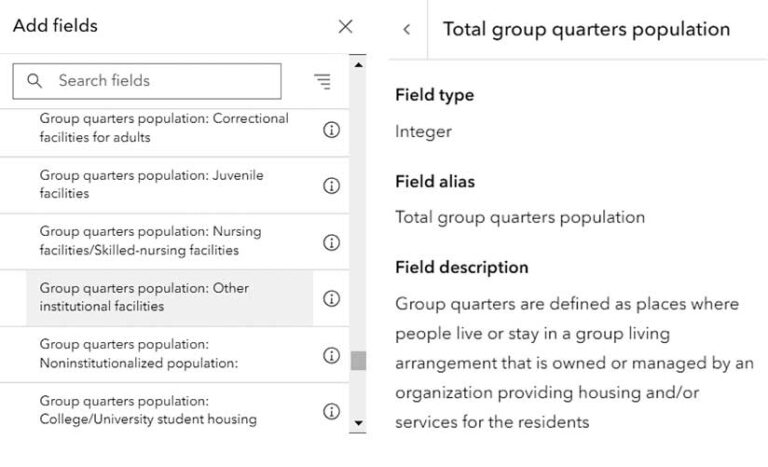
GIS analysts know that GIS can help shed light on complex topics, like climate change, social justice, and economic development, by visualizing opportunities to intervene. Those complex topics often come with a specific vocabulary that allows subject matter experts to describe details efficiently. Unfortunately, to the layperson, this language can sound like industry jargon. One example of this jargon is the phrase “group quarters population.” It’s defined as people living in group-based settings such as college dorms, military barracks, correctional facilities, or assisted living homes.
By opening the USA Census 2020 Redistricting Tracts layer in Map Viewer, you can see a field displayed as Total group quarters population in the fields list for styling the map. The i information button provides the definition:
“Group quarters are defined as places where people live or stay in a group living arrangement that is owned or managed by an organization providing housing and/or services for the resident.”
Another useful type of definition included in the field description—when appropriate—is one for coded values. For example, every census block, block group, tract, and county are contained in a state (or state equivalent if in Washington, DC, or Puerto Rico). This state is a field on the layers for lower levels of geography. Similarly, these codes are also contained within a census division. The coded values for the attribute division range from 0 to 9. In this case, the description serves as a codebook that exposes which division each value corresponds to.
One click on the i information button gives a better understanding of these topics. Not leaving Map Viewer to get the definitions on another website saves time. The layer provides the definitions you need in the field descriptions.
Learn Expressions for Calculated Fields
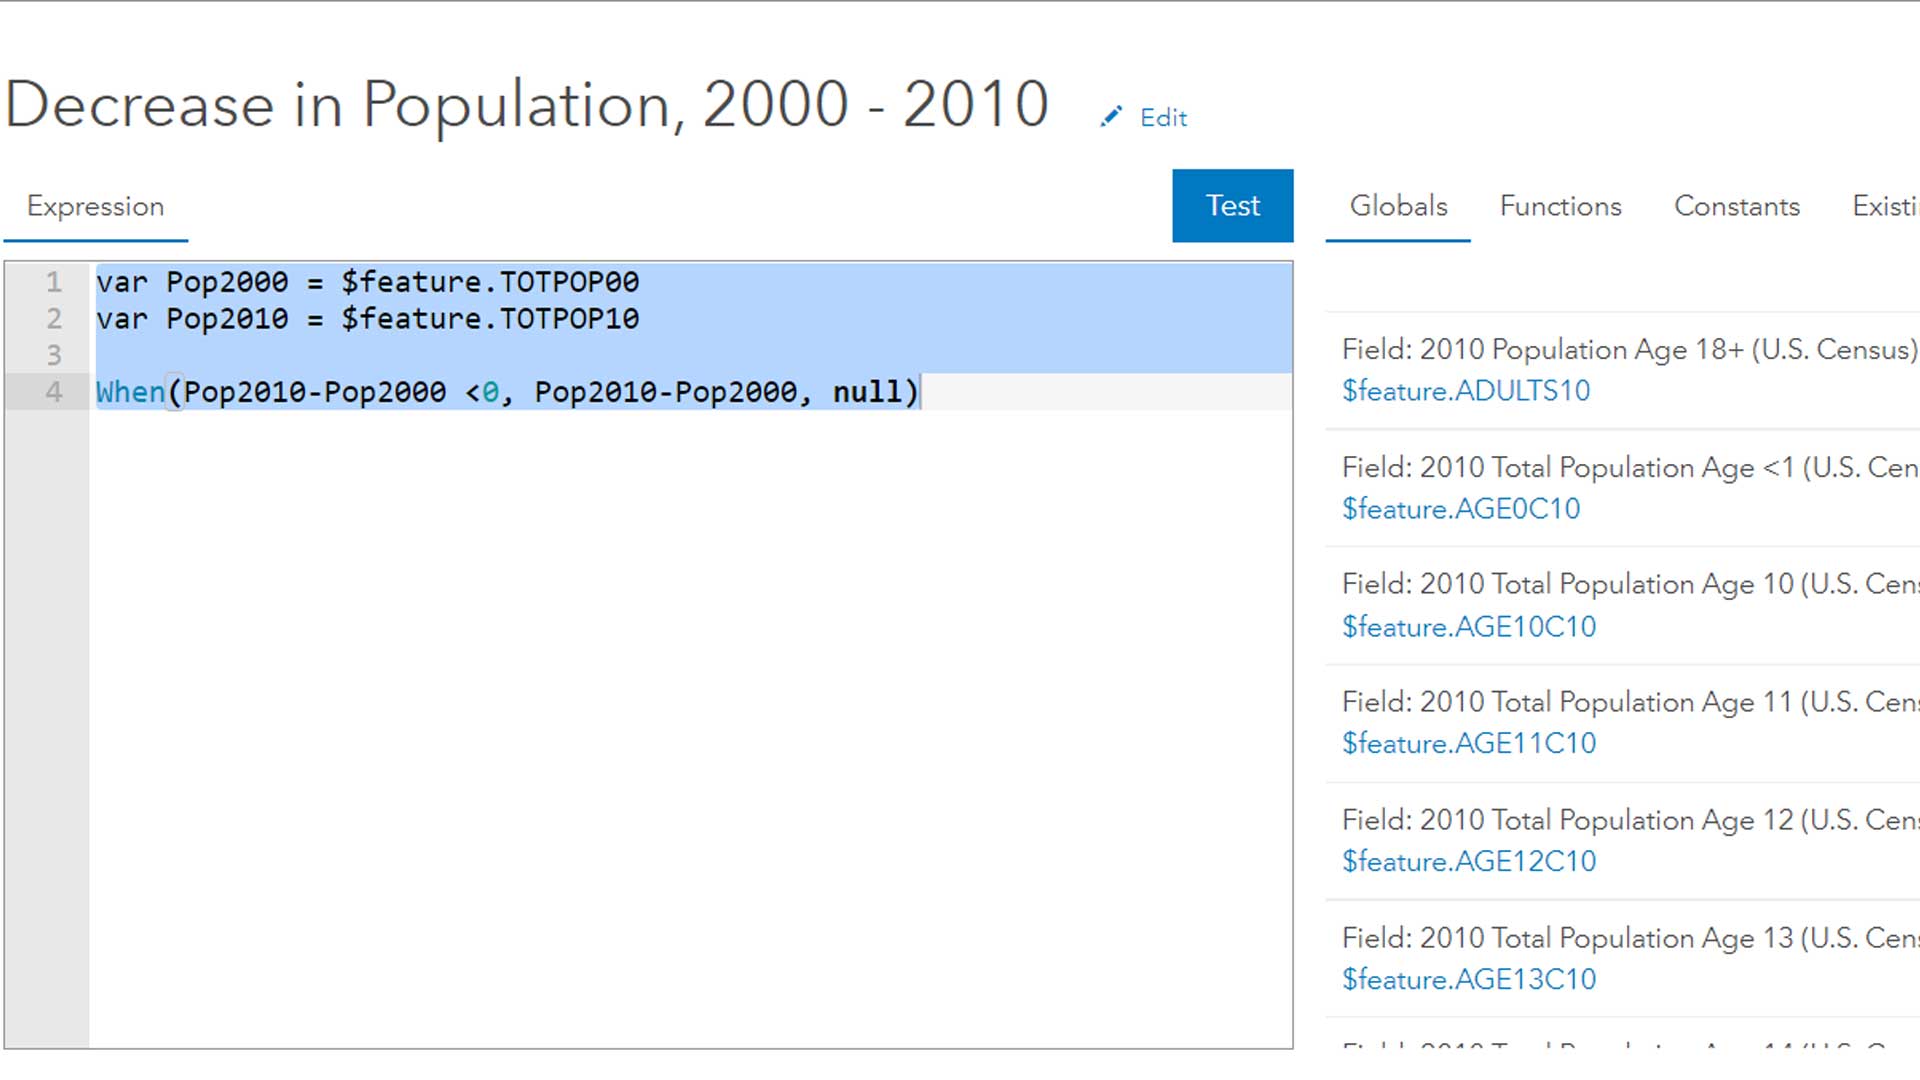
I find that working with calculated fields can be cumbersome and time-consuming, because sometimes my own calculations don’t match what I’m seeing on the layer I’m working with. I want to see the formulas used, since knowing exactly how a field was calculated can be extremely helpful.
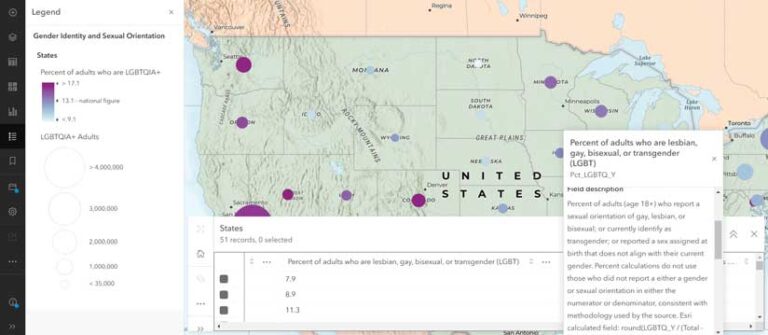
For example, the Living Atlas Gender Identity and Sexual Orientation layer does not include those who did not report certain characteristics in either the numerator or denominator of percent calculations. You can explore the field descriptions by opening the attribute table, clicking … (more options) in the header for the specific field in the attribute table and choosing the i information button to access information about a specific field including the field description. The formula used for the field can be viewed. With that information, I have greater trust in an attribute than when I wasn’t replicating the values, and I don’t need to leave the Map Viewer and read through a methodology document from the source. My question was answered in a few clicks.
Learn Sources, Vintages, and Units
Some datasets are valuable in part because they bring together information from multiple sources. While it is very useful to have different types of information in one unified layer, it can raise questions about sources and vintages. However, the field description is an ideal place to store this type of attribute-specific metadata. For example, each year the Robert Wood Johnson Foundation undertakes the herculean task of combining several sources and updating each with the latest vintage data available to produce its County Health Rankings. This results in a very informative layer that provides attributes on topics such as obesity, smoking, child poverty, and mammogram screening.
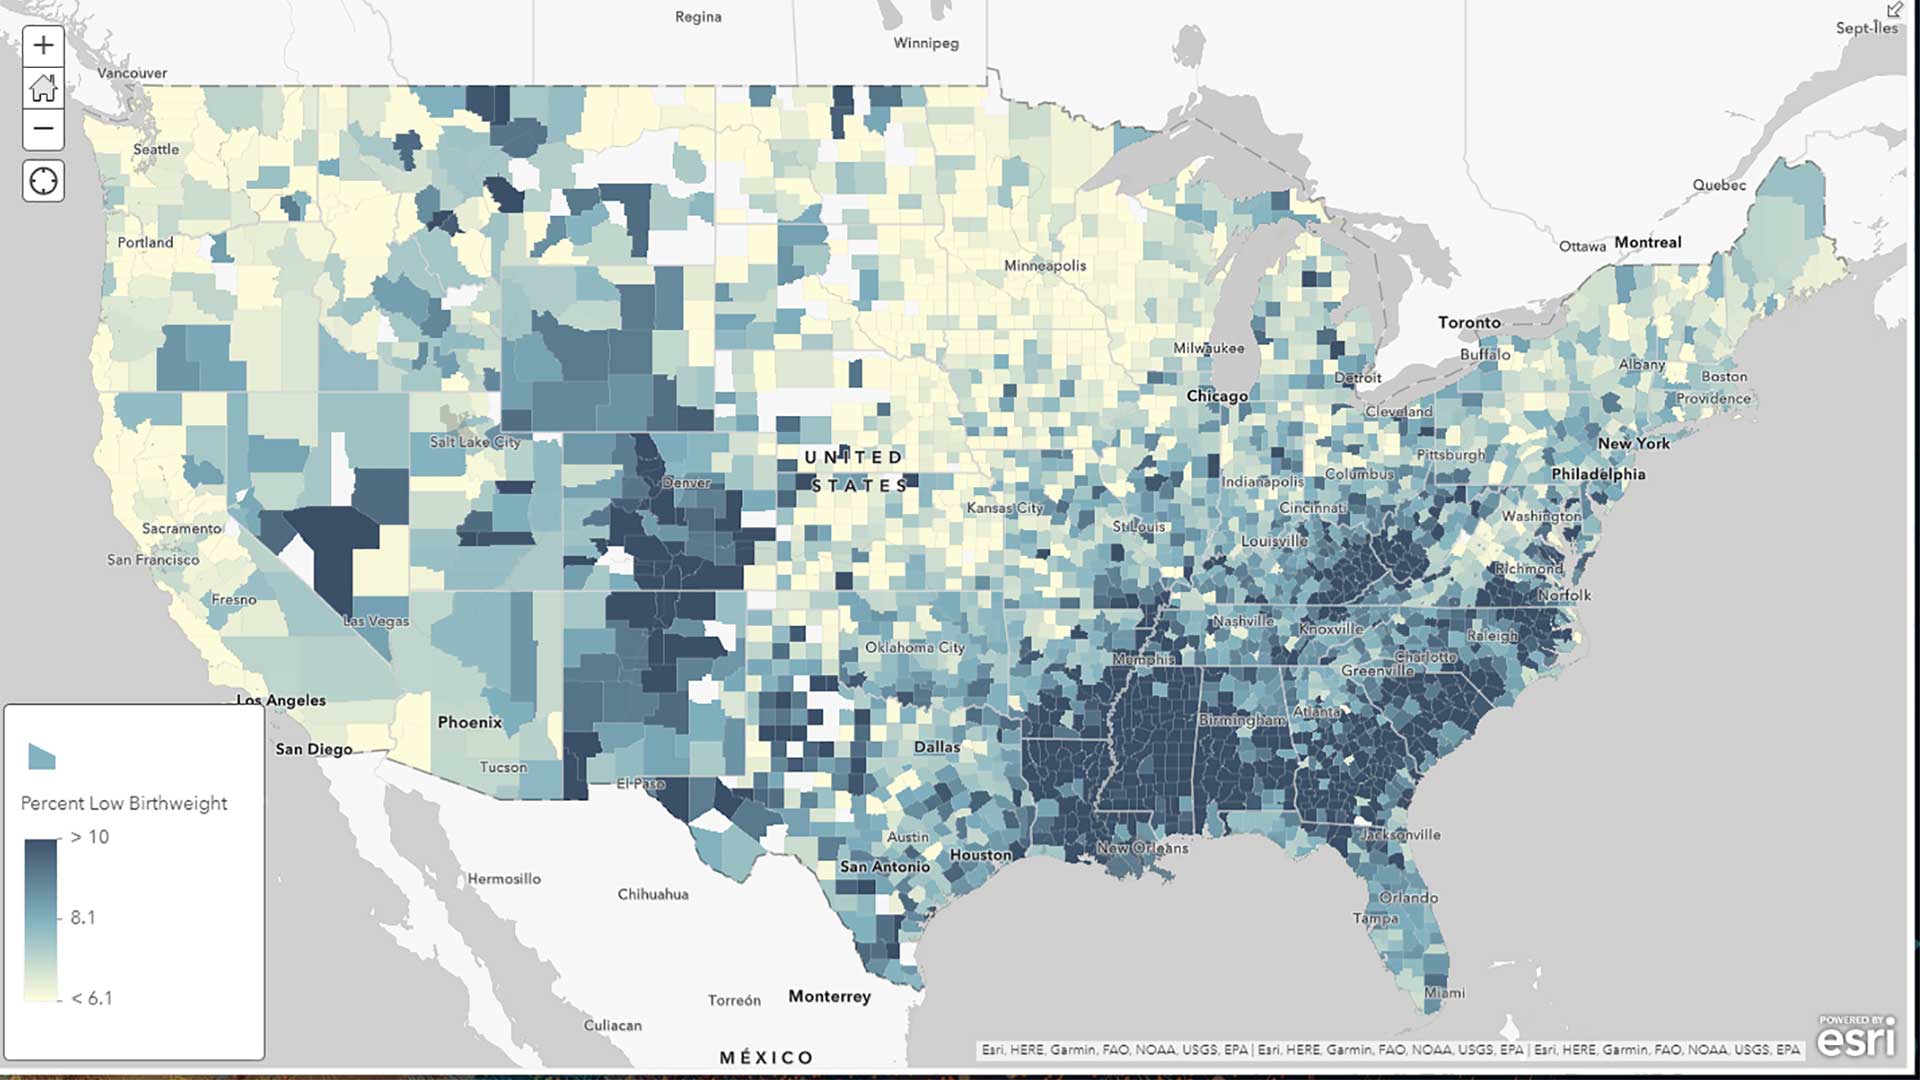
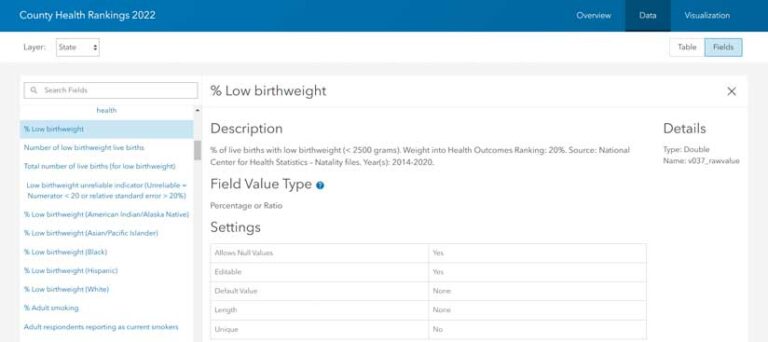
If I’m interested in underlying sources and vintages of the data used in this layer, I will look at the layer’s item page. However, much of this information on sources will differ depending on the attribute. To find out the underlying source and vintage of an attribute, all I have to do is click the Data tab on the item page. This brings me to the attribute tables, and from there, I hover over the field I want to learn more about, in this case, percent low birth weight.
Hovering over the column exposes the field description, which includes source information. The source for data on low birth weight is the National Center for Health Statistics—Natality files for years 2014–2020. This field description also notes that low birth weight is defined as weight less than 2,500 grams, and that it’s 20 percent of the Health Outcomes ranking.
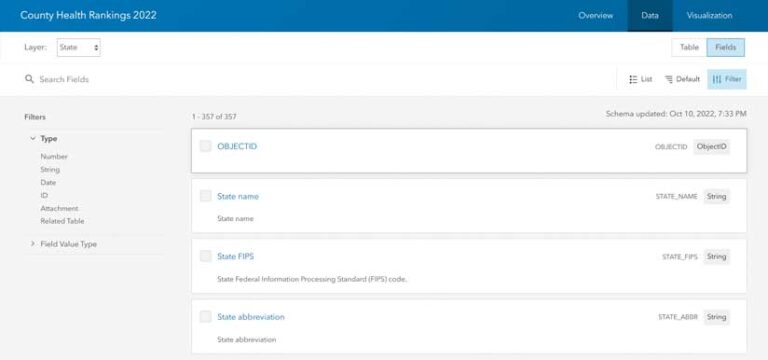
For large GIS projects, there are dozens of fields that have detailed information associated with them. Here the fields list on the item detail page can be extremely helpful. In the Data tab, simply switch from Table view to Fields view. Try the List option or the Table option to discover which one works best for your needs. I find the List option is the most ideal because it displays all field information (including field descriptions) in one place.

Field Descriptions Are Visible in Many Places
From the previous examples, you probably noticed that field descriptions are available in many places in ArcGIS Online. Get to them within the Map Viewer’s symbology options, viewing the attribute table within Map Viewer, and in the Data tab of the item page. Exposing the field descriptions in multiple user experiences makes viewing the descriptions just a few clicks away from whatever you’re doing. Next time you’re working with a layer in ArcGIS Living Atlas and have a question about an attribute, check for a field description.
Include Long Field Descriptions on Your Feature Layers
In most large organizations, the analysts who publish layers are different from the analysts who use the layers for mapping. And the people who create dashboards, apps, and stories can be different. Are you publishing feature layers for your organization that others use downstream in a workflow? Consider including long field descriptions on some of your layers in this case.
From an organizational perspective, analysts are creating a high-quality institutional asset that can avoid misinterpretation of data, which reduces costs. From an individual perspective, analysts are providing answers to specific questions about various fields in a self-service style, which reduces questions piling up in analysts’ inboxes.
Creating Descriptions
The most time-intensive part of creating field descriptions will be writing out the descriptions themselves because that can involve looking through codebooks, metadata in data warehouses, information across multiple sources, and other kinds of technical documentation that may or may not be well organized. Since the main goal of field descriptions is to communicate information about the field, it can be worthwhile to ask people who use the map layers you create what they need to know about the attributes. You can ask questions such as:
- Is the source the most important thing to put first?
- What definitions are needed?
- Do we include formulas?
- Do any acronyms need to be spelled out?
When they write descriptions for a handful of fields, analysts will quickly realize that it takes dedicated time. If creating field descriptions for every single field seems overwhelming, start with the fields that generate the most questions. Which attributes generate the most questions?
The actual mechanics of applying the field descriptions are easy for the item’s owner. It can be done manually through the ArcGIS Online graphical user interface (GUI), or through a scripted process. A scripted process is most ideal when editing many fields.
Applying Descriptions Manually through the GUI
From the item page, click Data > Fields > to change from Table view to List view. Then click the field you’d like to edit.
By opening the USA Census 2020 Redistricting Tracts layer in Map Viewer, you can see a field displayed as Total group quarters population in the fields list for styling the map. The i information button provides the definition.
If you’re working with multiscale layers, make sure the desired layer is selected in the drop-down option. If your layer contains many fields, use the search bar to search within the fields. Or use the filter options to filter by field type. The character limit for adding descriptions manually through the user interface is 500.
Applying Descriptions through a Scripted Process
If you’d prefer a scripted process to save time and reduce the potential for human error, I highly recommend AliasUpdater, a Python script created by Esri staff member Lisa Berry. It was designed to help you update the aliases and descriptions for hosted feature services.
You’ll need a Microsoft Excel table containing the field names, desired aliases, and desired descriptions. This script also allows for assigning other options including attribute field type, decimal places to display, and comma separators. The character limit for adding descriptions through a scripted process is 1,064.
Recap
Field descriptions help clarify confusion around definitions, units, sources, vintages, and more. Many layers in Living Atlas contain field descriptions for all attributes. This helps analysts learn more about what exactly they are mapping in just a few clicks. Adding field descriptions to your own layers is straightforward.