Often you find that the layers you own—and especially layers you don’t own—don’t meet all your mapping needs. You may want to calculate new values for fields, spruce up your pop-ups with data from additional layers, or summarize your data based on geometry. You could copy datasets and join them to produce a third dataset that you would then have to manage. Instead, you could use ArcGIS Arcade, which allows you to calculate new data values on the fly.
What Exactly Is Arcade?
Arcade is a portable, lightweight, and secure expression language written for use in the ArcGIS system. Like other expression languages, it can be used to perform mathematical calculations, manipulate text, and evaluate logical statements. It also supports multistatement expressions, variables, and flow control statements. Arcade was designed specifically for creating custom visualizations and labeling expressions in the ArcGIS system. It allows users to write, share, and execute custom expressions in ArcGIS Pro, ArcGIS Runtime, ArcGIS Online, and the ArcGIS API for JavaScript.
Arcade allows you to access feature geometry, store constants and variables, and provide access to attribute values. You can use the broad functionality in Arcade to calculate new data-driven values.
For example:
- Make basic calculations, such as calculating a percent.
- Use functions, such as ABSOLUTE VALUE, ROUND, and logical statements.
- Create an index or ratio.
- Manipulate text or resize symbols based on map scale.
- Use geometry-based functions.
- Perform data cleanup such as fixing fields that contain incorrect values or typos.
If you’re brand new to Arcade, read “Your Arcade Questions Answered” to learn more.
Using Census Data from ArcGIS Living Atlas and Arcade
ArcGIS Living Atlas of the World contains US Census Bureau American Community Survey (ACS) layers that are quick and easy to use when mapping demographic topics in the US. Combining Arcade and ACS layers can save time and enhance your maps.
The ASC provides a lot of interesting data points from social, economic, housing, and demographic characteristics about the US population every year. This data can be used to make important public and business decisions that clearly identify issues and opportunities and help more effectively allocate resources.
ArcGIS Living Atlas of the World contains layers of the most current ACS five-year estimates that are curated, free to use, and ready to go. The layers are updated annually to reflect the most current data values and geographical boundaries. Layers contain data for state, county, and census tract geographies. Each layer contains single or multiple ACS tables, grouped by topic, and each topic is available as boundaries and centroids. Many layers include precalculated fields such as sums and percentages. Coastlines and water features are clipped to meet cartographic needs. Field aliases and long descriptions bring metadata directly into the user experience.
1. Construct New Values to Map
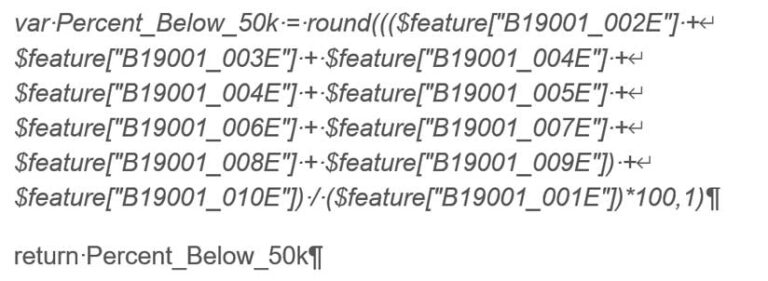
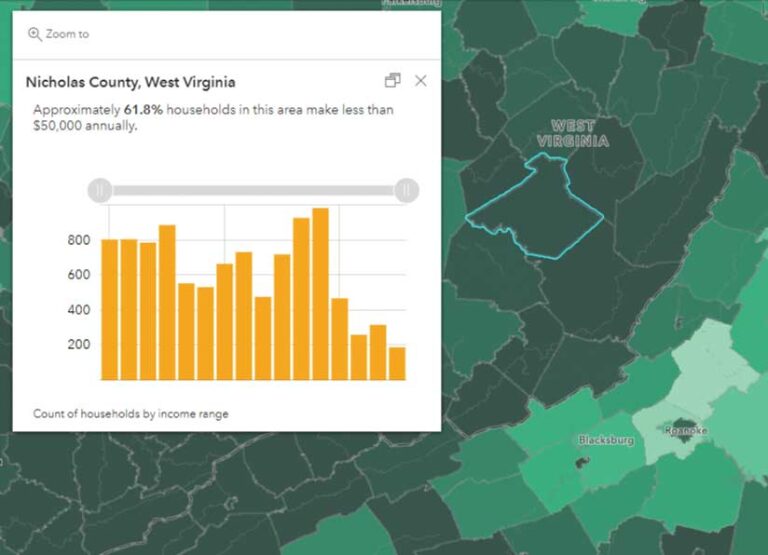
A lot of valuable fields are given in ACS data, but often you may want to combine fields and construct new values to map. For instance, if you want to map the percentage of households with income below $50,000, you can use the ACS Household Income Distribution Variables layer in ArcGIS Living Atlas of the World and Arcade to calculate this attribute on the fly.
ACS offers the count of households within different income ranges such as $0 to $14,999 and $15,000 to $20,000. But if you want to combine those fields to identify households with incomes less than $50,000, Arcade allows you to combine the different attributes and normalize them into a percentage as shown in Listing 1.
2. Spruce Up Your Pop-ups
Arcade allows you to quickly add new information to your pop-ups, such new calculated fields, as well as writing conditional statements to provide information about your data. From the field calculations shown in Listing 1, you can simply copy and paste the Arcade expression as a new expression in the pop-up panel and re-create the percentage of households whose income was below $50,000. In addition, Arcade allows you to bring in information from another layer, using FeatureSets, without having to run any join functions.
3. Writing Conditional Statements
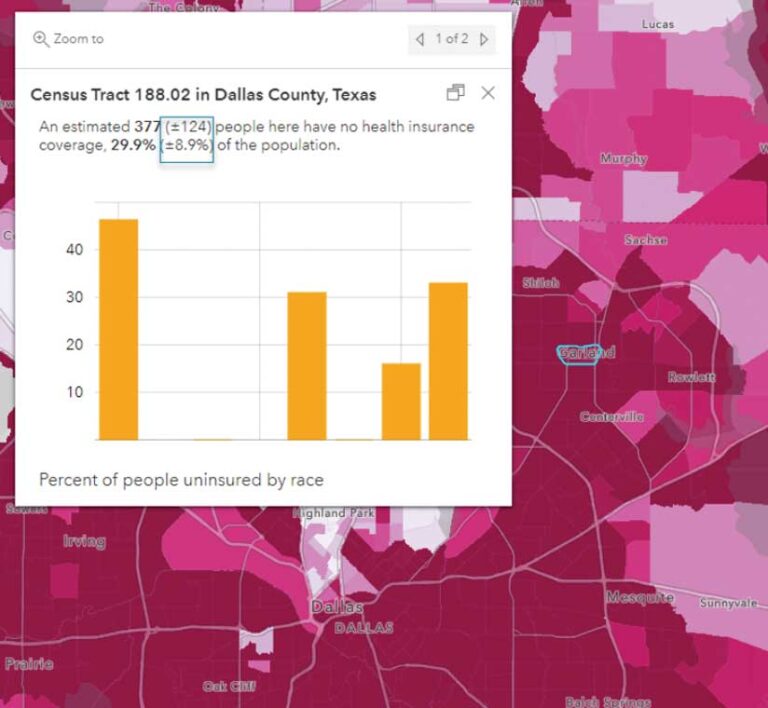
Writing logic methods is useful for checking for empty values and writing conditional statements such as if/else logic and implementing switch-case statements. All ACS layers in ArcGIS Living Atlas of the World contain margins of error fields that are displayed in pop-ups. You can write logical statements in Arcade to determine whether a given census geography has reliable estimates for any given attribute by using the associated margin of error such shown in the Arcade statements in Listing 2. For an in-depth explanation on using Arcade to write statements for margins of error, read “Effective ways to communicate margins of error through pop-ups.”

4. Use Data from Other Layers
Often, you’ll want to add additional information into a pop-up that resides in another layer. You could join the layers of interest together, but that requires additional time, credits, and some additional work. That’s where Arcade’s FeatureSets capability comes in.
FeatureSets are Arcade data functions you can use with feature layers. With FeatureSets, you can work with multiple features in a layer when authoring a pop-up or calculating fields. For a detailed explanation of FeatureSets, read “What’s new with Arcade: Taking a stroll through FeatureSets (Part 1).”
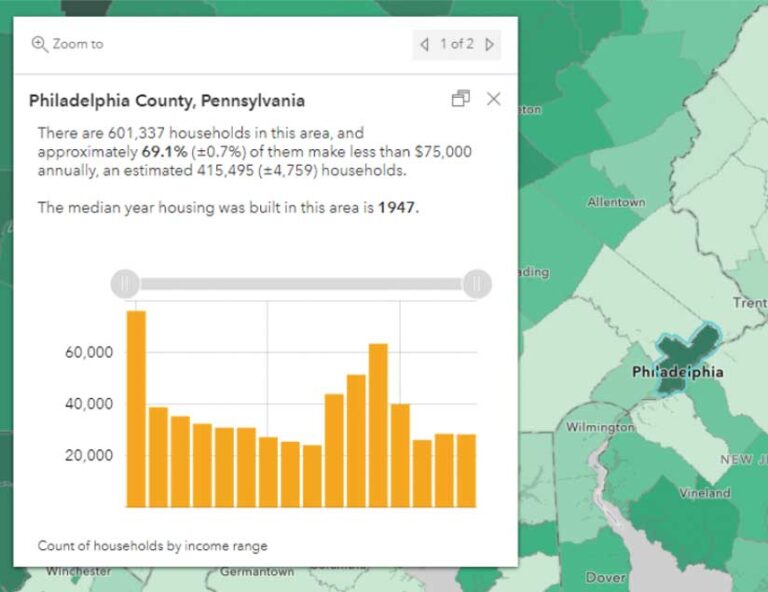
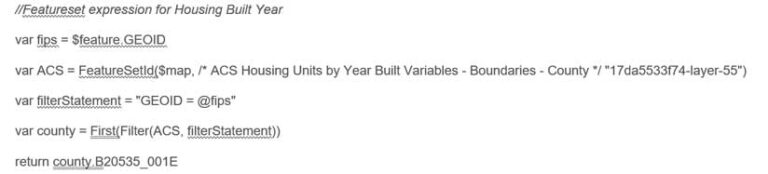
Listing 3 uses FeatureSets to bring data from one ACS layer into another. Specifically, bringing data from the ACS Housing Units by Year Built Variables layer into the ACS Housing Costs Variables layer to bring in context about the median age of housing to households by income map. It uses the FIPS/GEOID field to find the matching record from the similar layer. This is an attribute-driven approach that is a lot like a join, which combines two tables based on a corresponding value. The FeatureSetByPortalItem() function allows you to pull data from another layer into a pop-up without adding the layer to your map. When retrieving data from a layer within your web map, use the FeatureSet function and access data with $map. When retrieving data from a layer that isn’t in your web map, use FeatureSetbyPortalItem function.
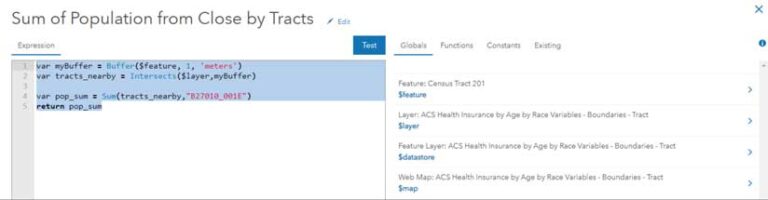
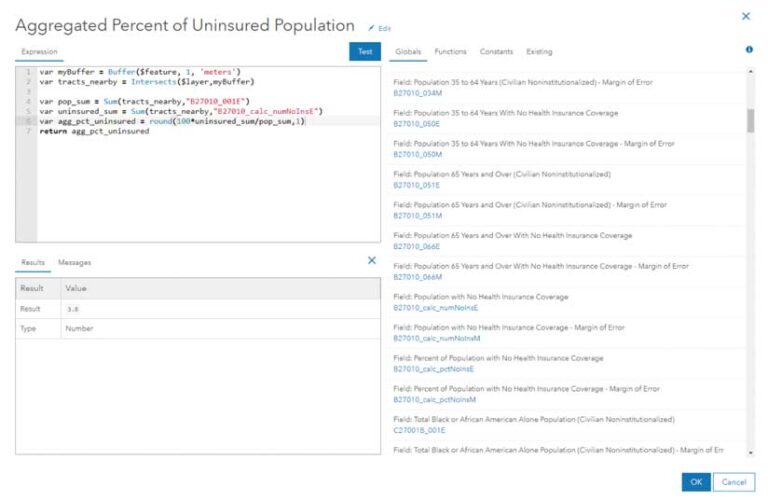
5. Using Geometry Functions to Provide Spatial Context
While all the uses of Arcade described so far are awesome, when is the spatial in geospatial with using Arcade? Fear not, Arcade allows you to use geometry functions such as Spatial Union, Intersection, Clip, Buffer, Overlaps, and more of your favorite spatial relationships.
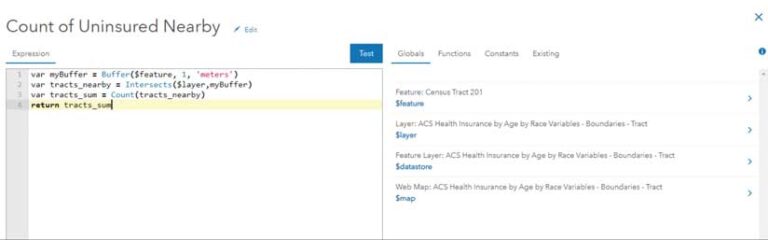
For a more detailed description of geometry functions using Arcade, read “Use Arcade geometry functions with FeatureSets to provide spatial context.” For instance, you might want to aggregate areas based on an area of interest, such as a buffer. When dealing with margins of errors in ACS, you might want to aggregate surrounding census tracts to get values that are more reliable.

Use Arcade to Enhance Any ArcGIS Map or App
These are just some of the many ways that you can use Arcade to elevate ACS layers or any feature layer: calculating a new field to map an attribute of interest by sprucing up pop-ups with newly calculated fields and conditional statements or bringing in additional layers and displaying spatial relationships. Arcade makes working with ArcGIS Online, ArcGIS Pro, ArcGIS Dashboards, and web applications easier than ever.
About the author