One of the goals of a web developer is to build performant web applications. Notice, that we said one of the goals. As developers, we shouldn’t overprioritize performance optimization and neglect other user expectations. Users drive what we do. We should meet user needs while staying as performant as possible. These strategies can help make your web applications built with the ArcGIS API for JavaScript work better.
Before You Begin
The rendering logic in JavaScript API is already optimized. Because the software fetches data efficiently, you should test the app on various devices first to understand its performance before diving into optimization. API performance is constantly being improved—in terms of CPU and memory usage—so using the most current release of the API can benefit your application’s performance. If you start noticing performance issues when many features are in the map view, or if your app needs many visible layers, consider the recommendations in this article.
Designing Your Map for Performance
Whether using the ArcGIS Online or Enterprise Map Viewer to create a map and then loading it into your app, or constructing your map manually using JavaScript code, it’s important to design the map for performance. This is where web mapping application optimization starts. A map designed for performance is one that loads only the data needed to make a meaningful visualization, at the right time. If you really understand both your data and your user’s requirements for interacting with it, you can design a map that optimizes both performance and experience. Let’s explore some tips to consider for accomplishing this.
Reduce the Number of Features Displayed
With the fast rendering pipeline used by JavaScript API and the smart client-server implementation of feature services, you can render a shocking amount of data with speed that is often comparable to that of a desktop application. Often end users access applications on very resource-constrained devices or with limited network bandwidth, so it is important for some developers to optimize applications for this scenario. The following strategies will reduce the amount of data your application is working with, which can reduce network latency, rendering time, and the application’s memory footprint.
- Establish the minimum and maximum scale.
- Preprocess data when appropriate.
- Limit the map to the layers needed by the application.
- Use definition expressions to filter data displayed by layers.
- Only load the attributes you need.
Establish the Minimum and Maximum Scale
The number of features displayed impacts performance, especially on memory-constrained devices. When you set a minimum and maximum scale (also referred to as the visible scale range), a layer’s features are displayed when the zoom level is within the set range. What layers should you show at each scale? When configuring the visible scale range of each layer, think about what features make sense to view at small and large scales. Can users distinguish between features at small scales? As you zoom out, it may become difficult to see more detailed information, or as you zoom in, information may become too coarse. Often the best way of determining the visible scale is by playing around with it and looking at the data through your end user’s eyes.
Preprocess Data When Appropriate
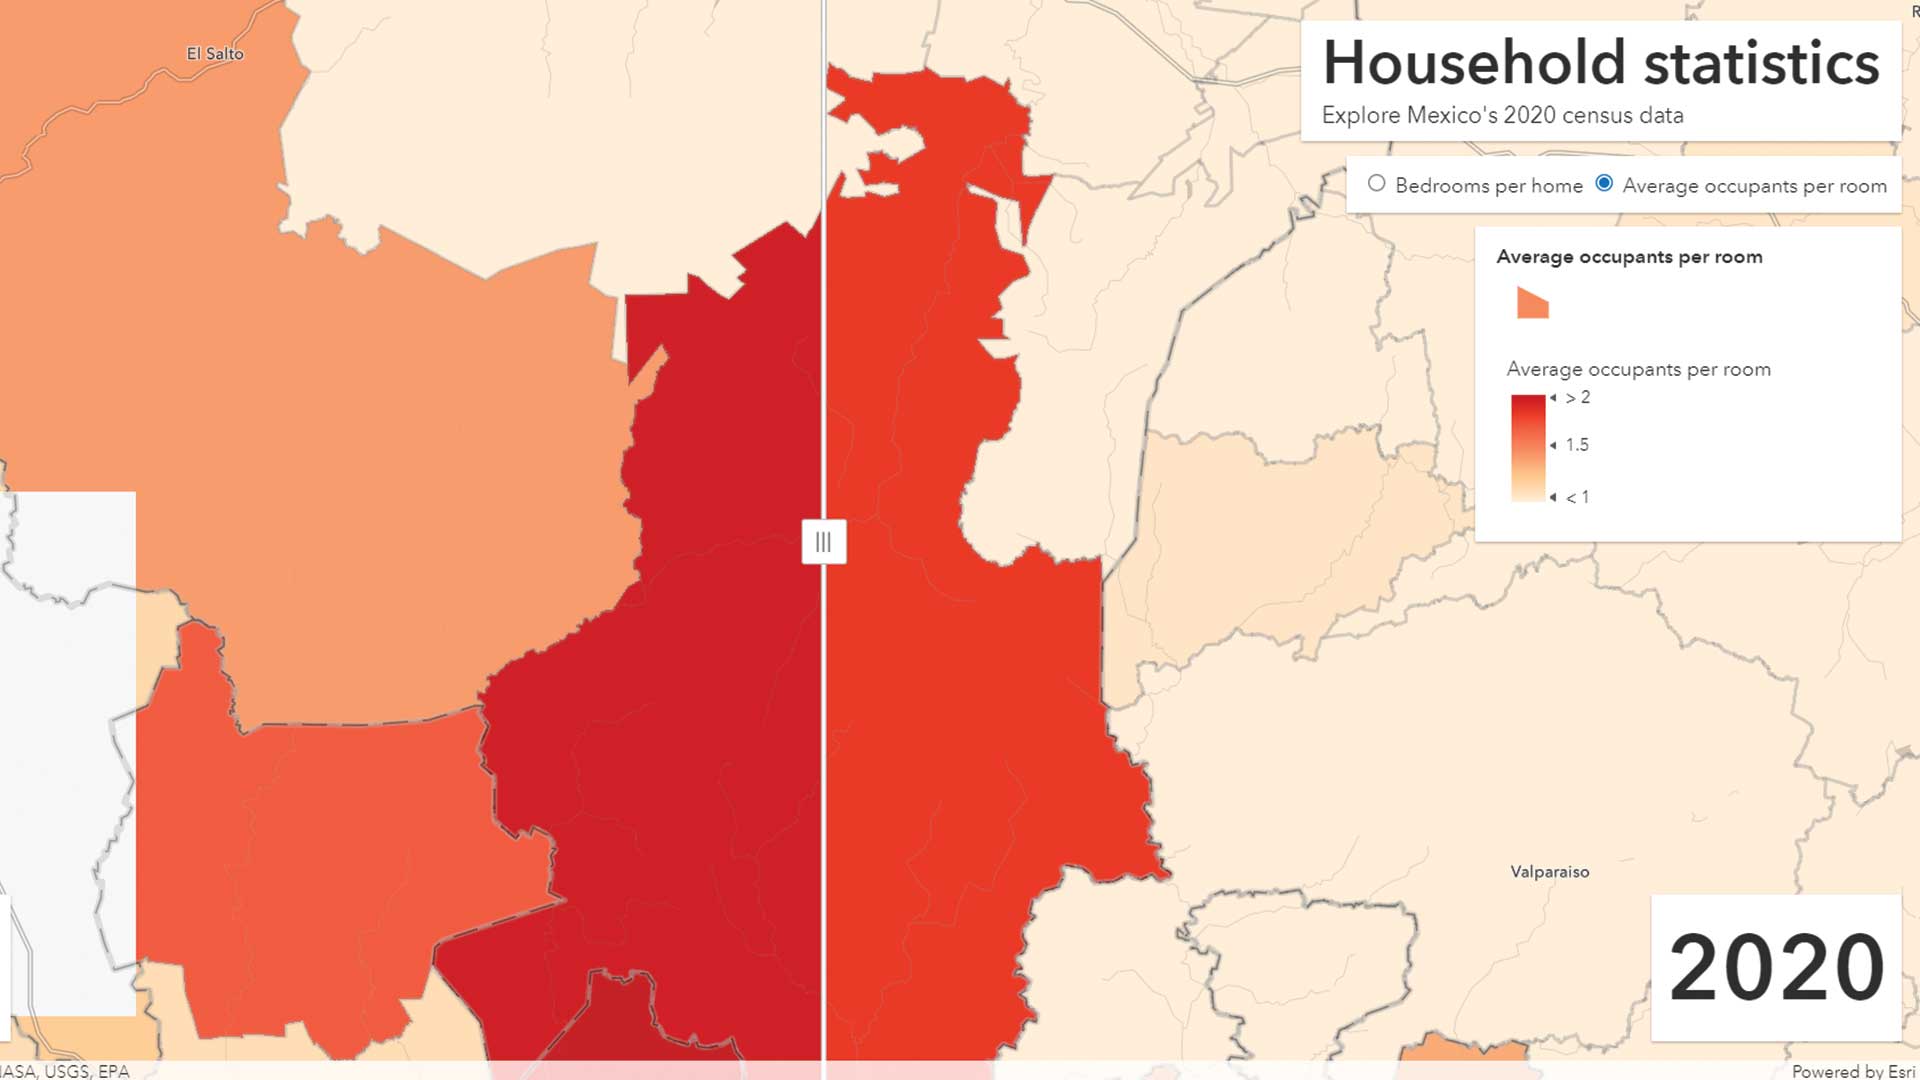
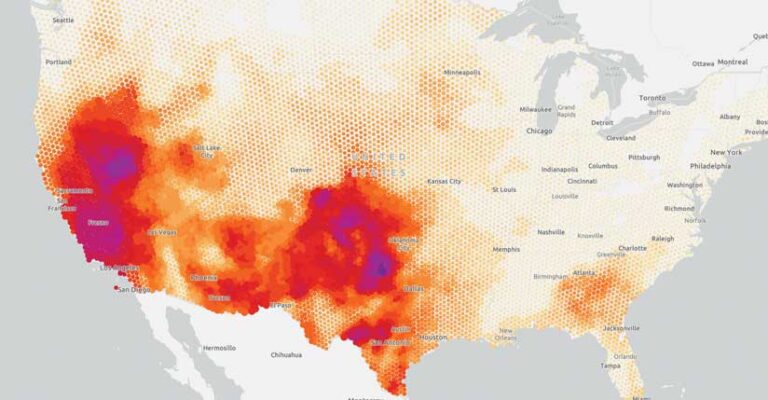
Use the ArcGIS system to preprocess your data for display at small scales. At the country, state, or county level, it may be more useful to display the data as aggregated polygons as opposed to individual points. There are multiple ways to summarize data within polygons. Polygons can either be a standard geography such as a state boundary or they can be regularly divided into a grid or hexagons. If it is meaningful to summarize your data at a standard geography, calculate the summary statistic for each geography and thematically map each polygon according to its value.
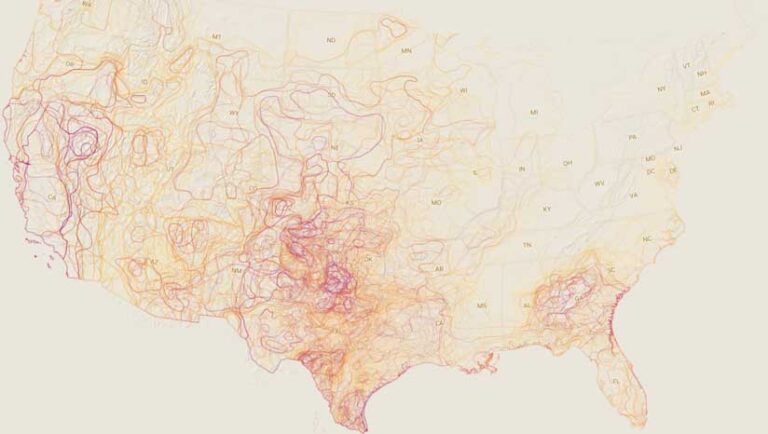
If it doesn’t make sense to summarize at a standard geography, an alternative is binning. Binning aggregates large amounts of point features into polygons called bins. A single bin represents all features within its boundaries and appears wherever at least one feature lies within it. For layers that contain thousands or millions of point features, binning vastly improves layer drawing performance. You can use ArcGIS Pro or ArcGIS Online to aggregate data and create summary layers. Use a scale dependency to display the summarized data at small scales and display individual features as the user zooms in. This approach only makes sense if your data is not constantly changing because each time your data changes, you will need to process the data again.
Limit the Map to the Key Layers Needed
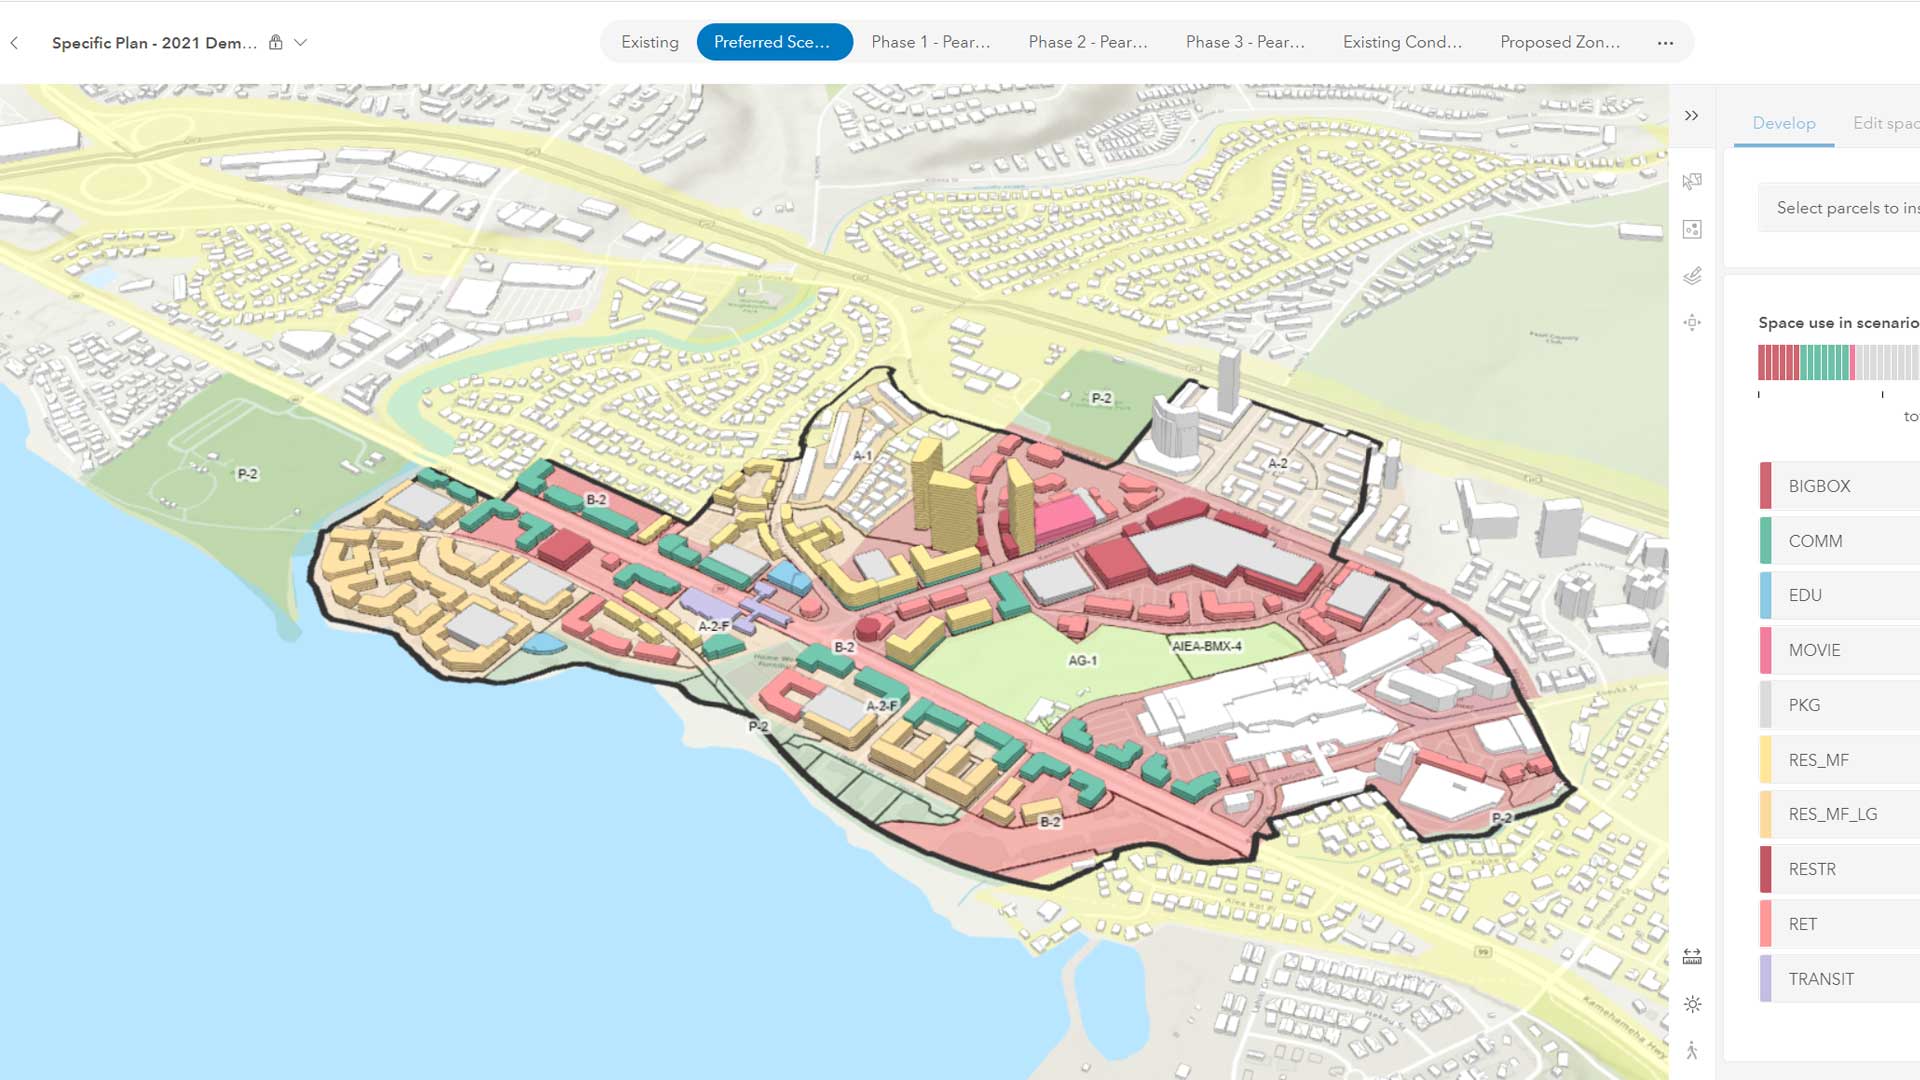
Avoid authoring web maps with a dozen or more layers. A web map with many layers is usually a web map trying to address too many user needs in a single application. Breaking the content into different maps to build focused applications will better meet specific user needs. A good approach for doing this is to categorize your users into groups based on their role and data and application requirements. Then design maps for users with similar needs and create clean and easy-to-use mapping applications that target their use case. These applications can often streamline users’ workflows while providing better performance because they work with less data.
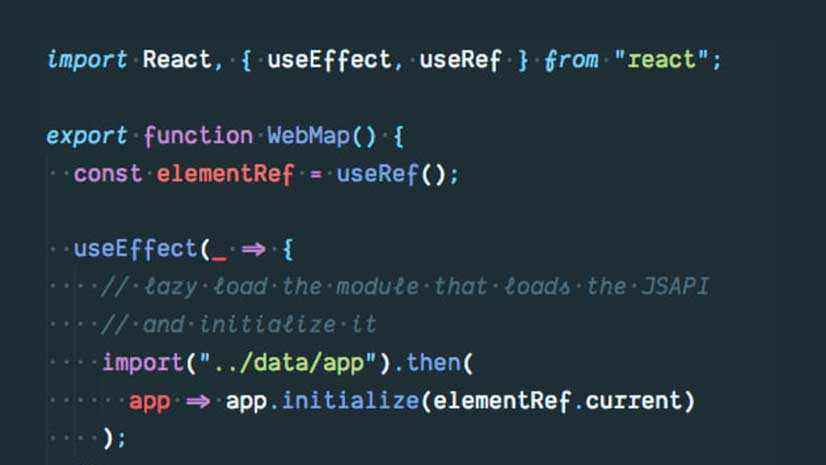
If you must create a map with many layers, you may be able to squeeze a bit more performance out of it by loading the layers in your application as needed. Listing 1 shows how you could accomplish that. It loads the map, finds the layers needed when the application loads, and then loads the other layers as required.
Use Definition Expressions to Filter the Data Displayed
If your application requirements are met using only a subset of the layer’s features, set a definition expression on the layer. Definition expressions set on the layer are different from defining a client-side filter. When a definition expression is set on the layer, the server will only return the needed features.
Load Only the Attributes Needed
By default, JavaScript API will only load the attributes it needs for visualization. This is done for performance reasons, because many datasets have a lot of attributes that are not used by the application. Sending many attributes to the client and storing them in memory can degrade map loading time. However, the application may need attributes in addition to the ones needed for display. For example, if you are building workflows that include client-side filtering, querying, or statistical calculations, you’ll need all corresponding attributes available on the client. Developers sometimes make the mistake of using an asterick (*) to set the layer’s outFields, which means all attributes are loaded. Instead, determine exactly which attributes are needed and explicitly set those attributes as outFields.
Optimize Services
Improve the performance of your application and the services it uses by employing the following techniques:
Enable Control Cache
One of the best performance enhancements for public feature services is to enable the control cache. The JavaScript API uses a concept called feature tiles, which is like raster tiles but works with features rather than precooked images. It allows the JavaScript API to do cacheable queries when requesting data, so both the server-side data fetch and client-side display operations can be extremely efficient. Feature services hosted in ArcGIS Online can be cached, so requests do not have to go to the back-end database. (The ability to enable a similar cache will come to ArcGIS Enterprise in a future release.) Caches can be configured to be valid for between 30 seconds and 5 minutes. If data doesn’t change frequently, set the cache to the maximum time so data can be retrieved as fast as possible.
Precook Features into Vector Tile Layers
Feature services often load as fast as vector tile layers when loaded using a laptop. That surprising fact is due to the fast rendering engine in JavaScript API and client-server optimizations for feature services. Displaying feature services—as opposed to vector or raster tile layers—is ideal because it allows you to build interactive workflows in your app. This is because all feature geometries and attributes are available on the client for use in any geometric, querying, filtering, or statistical operation.
However, if end users are on more limited devices, you may not have the luxury of loading all features. To preserve a crisp display at any scale and minimize memory consumption, you can precook features into a vector tile layer. Interactivity will depend on a feature service used behind the scenes. Queries will go to the server rather than a client-side feature layer, but the display will be handled by the vector tile layer. When end users are using very resource-constrained devices or in low network bandwidth situations, consider precooking raster tiles as opposed to vector tiles. However, this will come at a cost. The raster tiles will not display as crisply as vector tiles and are not dynamic. For example, as the user rotates the map, the labels won’t rotate.
Optimize Application Design
There are several methods you can use to optimize your web mapping applications with a custom build geared toward your application. The PRPL pattern is a common method for making applications performant, especially on low-end devices and in regions with poor Internet connectivity.
- Push critical resources
- Render as soon as possible
- Pre-cache assets
- Lazy load as needed
Push Critical Resources
You want to be able to push critical resources to your web application as soon as possible. These resources include JavaScript, CSS, images, fonts, or other assets needed up front for your application. You can leverage the rel=”preload” attribute in your script and style tags. The browser will prioritize loading of these assets. Some build tooling will let you designate bundles with this attribute for the output HTML file. Most modern build tooling will create bundles for you so that your application will only request the required bundles on load.
Render as Soon as Possible
A side effect of pushing critical resources when an application starts is loading and rendering the initial route as soon as possible. This is also an area where you can leverage an app shell. An app shell is the minimum amount of HTML and CSS needed to display your page right away. It might not have the detailed layout but would display the bare minimum of the application. If the map takes up a significant region of your initial page, you could have an image of a map or globe displayed until the map loads. It does not have to be an exact image of the map you want the application to display; the placeholder can just indicate where a map will appear.
Precache Assets
Ideally, you want to limit the number of requests made to a server. Service workers, a script that runs in the background of the user’s browser, can help with this. You can configure a service worker to cache resources, such as JavaScript, CSS, images, and fonts, so that on the next load, your application doesn’t need to make extra requests. After the initial load, this means faster page loads on subsequent visits.
Lazy Load
Once you have preloaded and cached critical resources in your application, you may want to lazy load the remaining resources. This doesn’t necessarily need to be an initial route, but there are portions of your application—such as charts, or even the map—that are loaded at runtime.
For example, an application might display a list of locations by name. When a location is selected, a map is loaded displaying that location. In this case, you want to render that list as soon as possible, but you can lazy load the resources for the map later. This can be accomplished in a few ways including using dynamic imports of modules for when they are needed. You don’t want to overuse dynamic imports because this could result in code being repeated in the bundles generated by dynamic imports.
Conclusion
The best applications are built by developers that truly understand their end users and optimize their application’s experience to focus on their users’ requirements—no more and no less. Using the techniques in this article, you can tune your map, the services it uses, and your application design to create the happy intersection of a good user experience and optimized performance. Learn more by reading the ArcGIS API for JavaScript documentation.