Homelessness is a complex problem that is typically brought on by personal hardship, unemployment, and the lack of affordable housing or mental health services. It is a human tragedy that has been exacerbated by the COVID-19 pandemic.
ArcGIS Solutions has been developed to assist communities dealing with homelessness. These solutions provide industry-specific configurations for ArcGIS that are designed to meet key business requirements and support common workflows in an organization. Each solution includes one or more applications, surveys, maps, feature layers, and ArcGIS Pro projects.
Conducting Point-in-Time Counts
The Department of Housing and Urban Development (HUD) requires each Continuum of Care (CoC) community to conduct a Point-in-Time (PIT) count each year during the last 10 days of January. [CoC is a regional or local planning body that coordinates housing and services funding for homeless families and individuals.] This count of sheltered and unsheltered people helps communities understand the extent of homelessness and provides a foundation for social programs and funding. Many communities did not perform the counts during the height of the COVID-19 pandemic, which made the count in 2021 extremely important.
An updated version of the Homeless Point-in-Time Counts solution, an ArcGIS Solution, was released in November 2021. This was a relatively minor update, but it did include updated choices for demographics, ethnicity, and gender in the Homeless Count Survey and to align with the FY 2022 HMIS Data Standards Data Dictionary published by HUD.
Conducting these counts on one night can take a lot of resources, thus in many cases volunteers are used to help canvas the area and perform the surveys. Volunteers interviewing people experiencing homelessness can use a series of questions provided by HUD to guide the process. If a person cannot be interviewed, observation data can be collected. This survey can be easily extended with community-based questions, such as awareness about local resources. Communities wanting to track volunteer progress and ensure data is not exposed can utilize ArcGIS Hub Premium, with community users to grant access to the survey.
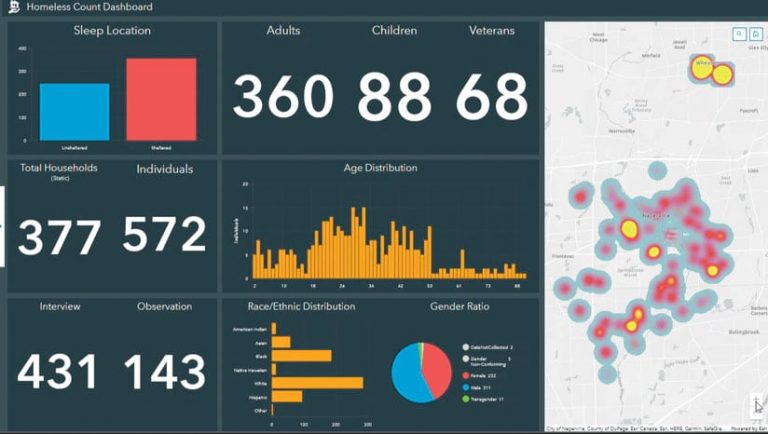
Some CoC communities activate their Emergency Operations Center on the night the count occurs. This helps managers track the progress in real time and can help ensure areas that are not being canvassed can be covered before the night is over. The solution provides a Homeless Count Dashboard so that managers can visualize this information in real time. After the count, the dashboard values, such as gender or age, can be selected to see how the geography changes.
HUD has specific guidelines that govern how CoC communities must report the results of their point-in-time counts. After the assessment, the program manager can then generate reports that meet the HUD requirements using the HUDReport Notebook, an ArcGIS Notebooks app.
Assessing Homeless Risk
Homelessness counts are typically conducted on a single night in January. However, this doesn’t necessarily reflect the extent of ongoing homelessness activity in a community. The Homeless Risk Reduction solution can be used by local officials to leverage continual reports of homeless individuals and encampments in the community and identify which areas are at risk for generating homelessness.
The solution enables a collaborative approach between the public and local government agencies to determine where resources can be deployed, offer services to homeless persons, and determine any additional steps required. Homeless Risk Reduction is typically implemented by health and human services agencies to proactively address homelessness and connect homeless individuals with available resources.
The Homeless Risk Reduction solution includes an ArcGIS Survey123 form, crowdsourcing app, dashboard, and ArcGIS Pro project that deliver a set of capabilities that help users understand where homelessness originates and actively monitor regular reports of homelessness so assistance can be offered to individuals in need.
Resources for People Experiencing Homelessness
The Homeless Outreach solution can be used educate the public and help individuals experiencing homelessness find available resources. This solution helps manage information about homelessness in a community and community services available to homeless persons. It also assists public health agencies in maintaining information about homeless populations.
Promoting a collaborative approach helps ease the burden on communities that are dealing with increasing service demands, limited access to technology, and real-time data. Homeless Outreach is typically implemented by health and human services agencies that want to take an active role in reducing homelessness.
The Homeless Outreach solution delivers a set of capabilities to inventory available services for people experiencing homelessness, communicate the extent of the homeless challenge to the public, solicit volunteers to help deliver these services, and share resources with those experiencing homelessness.