Most GIS professionals know that the value of imagery goes way beyond a backdrop for GIS layers. The information contained in most maps and GIS layers is derived from imagery to create or revise maps and GIS layers. Actionable information can be derived from imagery. Detecting, identifying, and mapping change for a wide variety of applications is a primary function of many organizations.

For example, burn severity maps can guide wildfire response activities such as public safety efforts, assessing landslide risk, and mitigation measures. Imagery is a critical component in creating those maps, but imagery must be current and analyzed, and the results shared appropriately with the organizations that can take action.
ArcGIS Image for ArcGIS Online (ArcGIS Image), part of the ArcGIS Image suite, is a cloud-based product for hosting, managing, and analyzing collections of imagery. This integrated system of capabilities can extract information from imagery for decision support in operational environments. ArcGIS Image Online provides access to an extensive collection of raster tools and functions. Because it is a software as a service (SaaS) solution, ArcGIS Image Online eliminates not only the need to manage and maintain IT infrastructure, but also the requirement to manage and update imagery collections. Because ArcGIS Image Online is cloud-based, it has the advantages of cloud computing power, storage, and scalability. Deployment in the cloud also adds efficiency to analysis of imagery by bringing analysis capabilities to hosted imagery, rather than moving large collections to process them.
Store Once, Use Continually
To use ArcGIS Image Online, transfer your imagery from local storage media to the cloud. Hosting your imagery and raster collections in ArcGIS Image Online is straightforward. Add your imagery as a tiled imagery layer or a dynamic imagery layer, depending on the intended use for the layer.
Use a tiled imagery layer to host a single mosaicked image layer, or one or more individual image layers in a tiled format for fast performance, image processing, and analysis. Use a dynamic imagery layer to host an image mosaic layer or collection of images that will allow you to manage, process, and analyze the individual images that populate a mosaic or collection. [For detailed information on imagery layers, see “A Guide to Sharing Imagery and Raster Data” in the winter issue of ArcUser.]
When hosting imagery to the cloud, choose to configure the image as one image, one mosaicked image, multiple imagery layers, or as an image collection. Drag and drop locally stored imagery into the dialog window and specify properties. The image is uploaded to the cloud. Imagery is published to your folder in the cloud with its own item page and URL. On the item details page, you will specify the settings for the image file, processing, display, and sharing.
Analyze Imagery in the Cloud
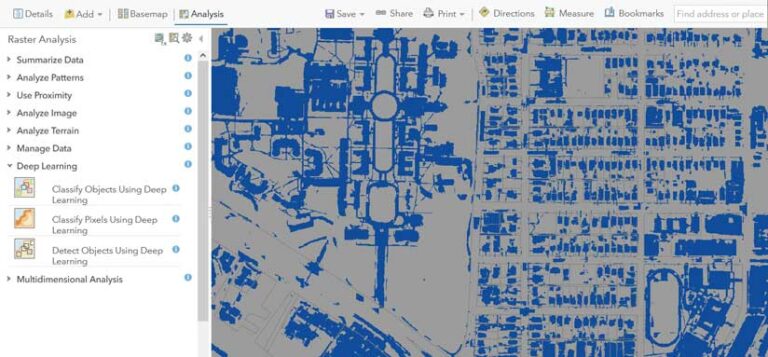
Tools and functions in ArcGIS Image Online transform remotely sensed imagery and multidimensional raster data into a smart image. Hosted tiled and dynamic imagery layers can be analyzed and actionable information extracted for operational decision support. Map Viewer and Map Viewer Classic support visual analysis of imagery and raster layers. Enhance imagery with renderers such as Stretch and Colormap and apply any number of standard or custom raster function templates (RFTs) published with the image layer.
Quantitatively analyze imagery in three ways with Map Viewer Classic, using:
- Standard tools on the Raster Analysis pane.
- Standard raster functions using on-the-fly processing.
- Custom RFTs and processing chains built in the Raster Function Editor pane and shared with members inside and outside your organization.
Both dynamic and tiled imagery layers support all the bands, bit depth, and other characteristics of the source imagery, and they are suitable for accurate image analysis and processing. Both imagery types can be analyzed using tools on the Raster Analysis pane. In addition, dynamic
imagery layers support server side on-the-fly processing using functions and raster function chains.
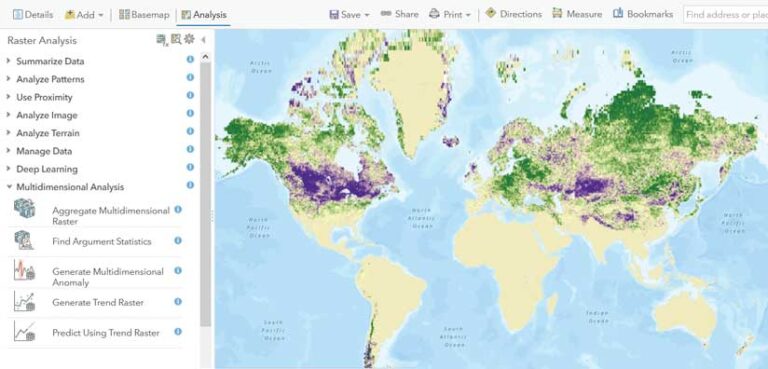
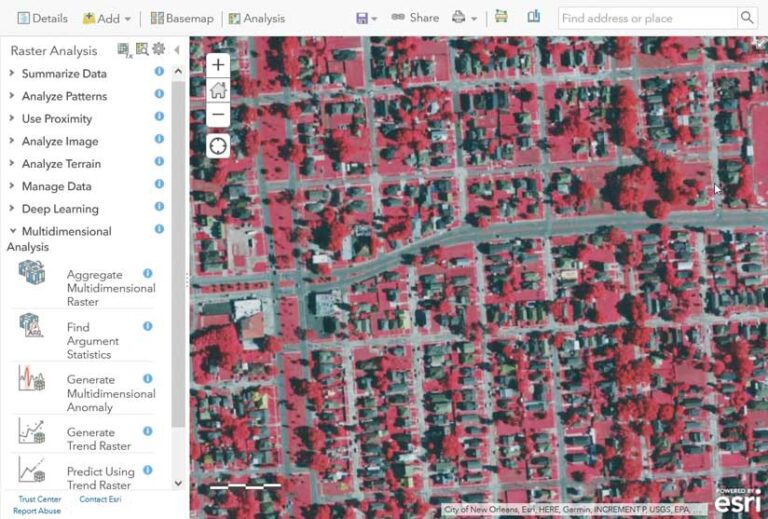
Using the Raster Analysis Pane
The Raster Analysis pane in Map Viewer Classic includes more than 25 raster processing tools contained in functional categories. These tools produce a new raster analysis layer that can be saved to the cloud. See ArcGIS Image Online documentation for a detailed description of these tools.
Click on a tool in the Raster Analysis pane to display the tool and adjust parameters, including output name and location to save the new raster layer in the cloud, then click Run Analysis. When analysis is complete, a new raster item will be created, and you can add information such as definitions or specify sharing conditions to its item description.
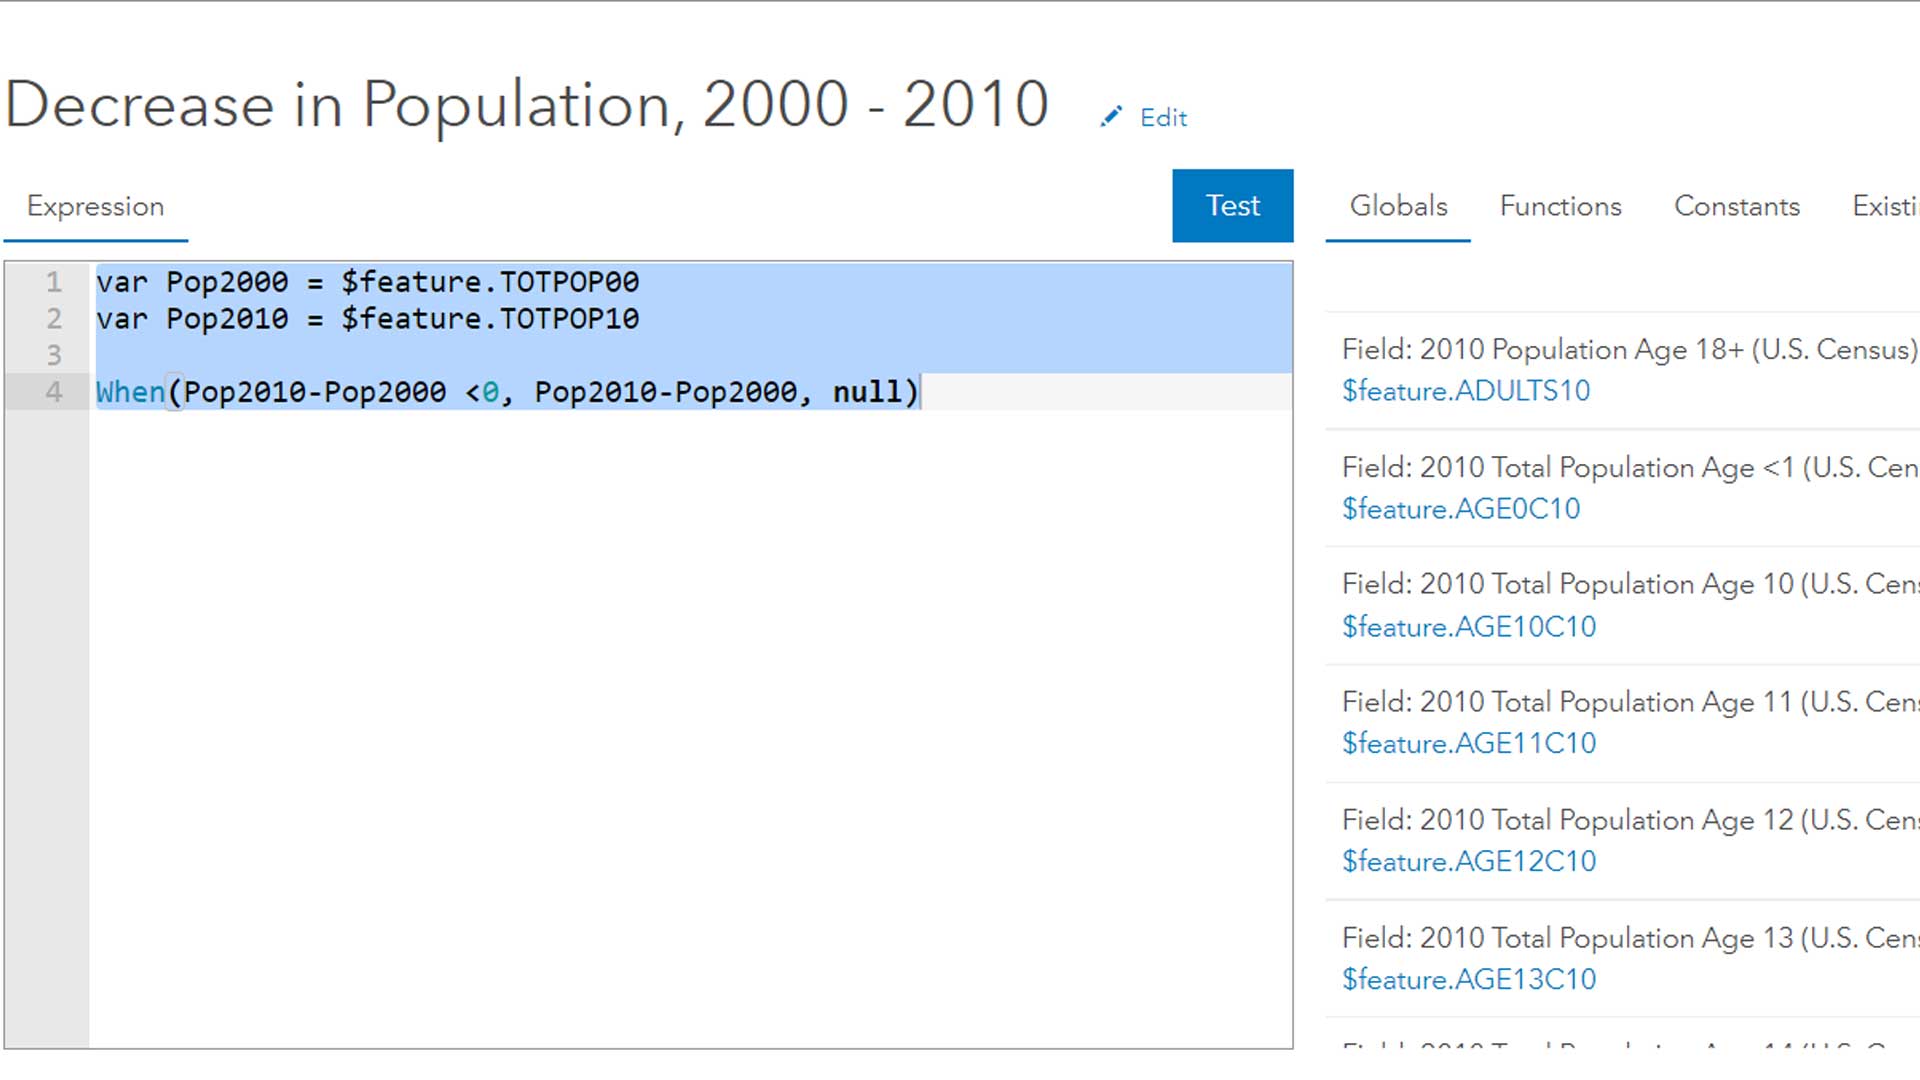
Using Raster Functions
You can find the raster functions in the Custom Analysis Tools and Raster Functions pane. ArcGIS Image Online provides raster functions for analysis, appearance, classification, conversion, correction, data management, distance hydrology, math, statistical, and surface to process and analyze dynamic imagery and raster data. These functions process multispectral and hyperspectral imagery, multidimensional scientific data, and temporal data for time series analysis.
Dynamic imagery layers can be processed on the fly using raster functions that are applied as you pan and zoom imagery in the map display. Because image processing calculations are only performed on the pixels that are visible in your map, results can be viewed and analyzed immediately. This allows you to adjust parameter settings as needed to visualize and optimize your results. After you fine-tune your parameter settings, you can publish your final results to the cloud.
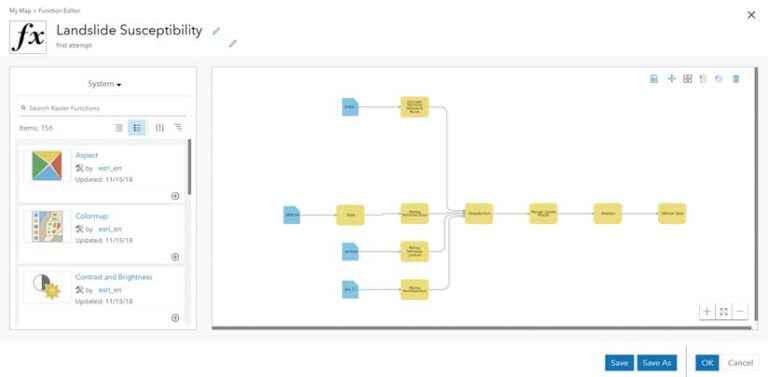
Using and Building RFTs
More than 150 raster functions can be used to process dynamic imagery or chained together to create RFTs, which can be saved and shared with your organization and applied to different sets of imagery to standardize processing, results, and products.
RFTs are built or modified in the Raster Function Editor, a visual programming interface for building imagery and raster analysis processing chains. Function chains are represented as diagrams in which functions are chained together, using the output of one or more functions as the input to another function. These raster function chains can be saved as RFTs, which you can reuse to automate your image analyses and processes. You can publish source imagery with any number of RFTs, which will render different products and visualizations in the map viewer.
For example, you can publish a collection of Sentinel satellite images with RFTs that use different band combinations, ratios, and math operators, which allows members in your organization to use results of your custom algorithms. For instance, employing RFTs, others in your organization can view imagery as an orthoimage mosaic, visualize land-cover classes, detect stressed vegetation, and assess burn severity.
About Using Credits
Your organization is charged credits for the storge and processing of imagery. The number of credits charged to store hosted imagery layers depends on the layer type, number of images, and size. The number of credits charged to process imagery depends on the complexity and CPU resources required. After specifying the tool and function parameter settings, the estimated number of credits needed to process your imagery is calculated before you click Run. Refer to the ArcGIS Online documentation for more information about credit usage.
Accessibility with Security
Projects often involve different stakeholders from different departments, external organizations, or the public. These stakeholders have different needs and permissions to view, edit, analyze, publish, and share imagery layers and information products and ArcGIS Online ensures data is properly managed and can be securely accessed at different levels. Proper sharing of imagery layers and derived products is important for effective communication, operations, and governance.
Imagery Analysis Benefits across ArcGIS
Because it is part of the ArcGIS Online ecosystem, the output of ArcGIS Image Online analysis can be incorporated into information products and shared in a controlled fashion. Data and products can also be integrated with ArcGIS Pro, ArcGIS Enterprise, ArcGIS extensions, field apps, and dashboards. Image analysis is no longer just the domain of the remote sensing scientist. With ArcGIS Image Online, GIS practitioners can analyze imagery—either visually or computationally—and benefit from the insight it can provide.
About the authors

Jeff Liedtke