Good decision-makers have a high-level of situational awareness. They understand the broader context in which they operate. However, in today’s global, fast-paced, and densely interconnected world, decisions require gathering insights from a wide variety of heterogeneous resources.
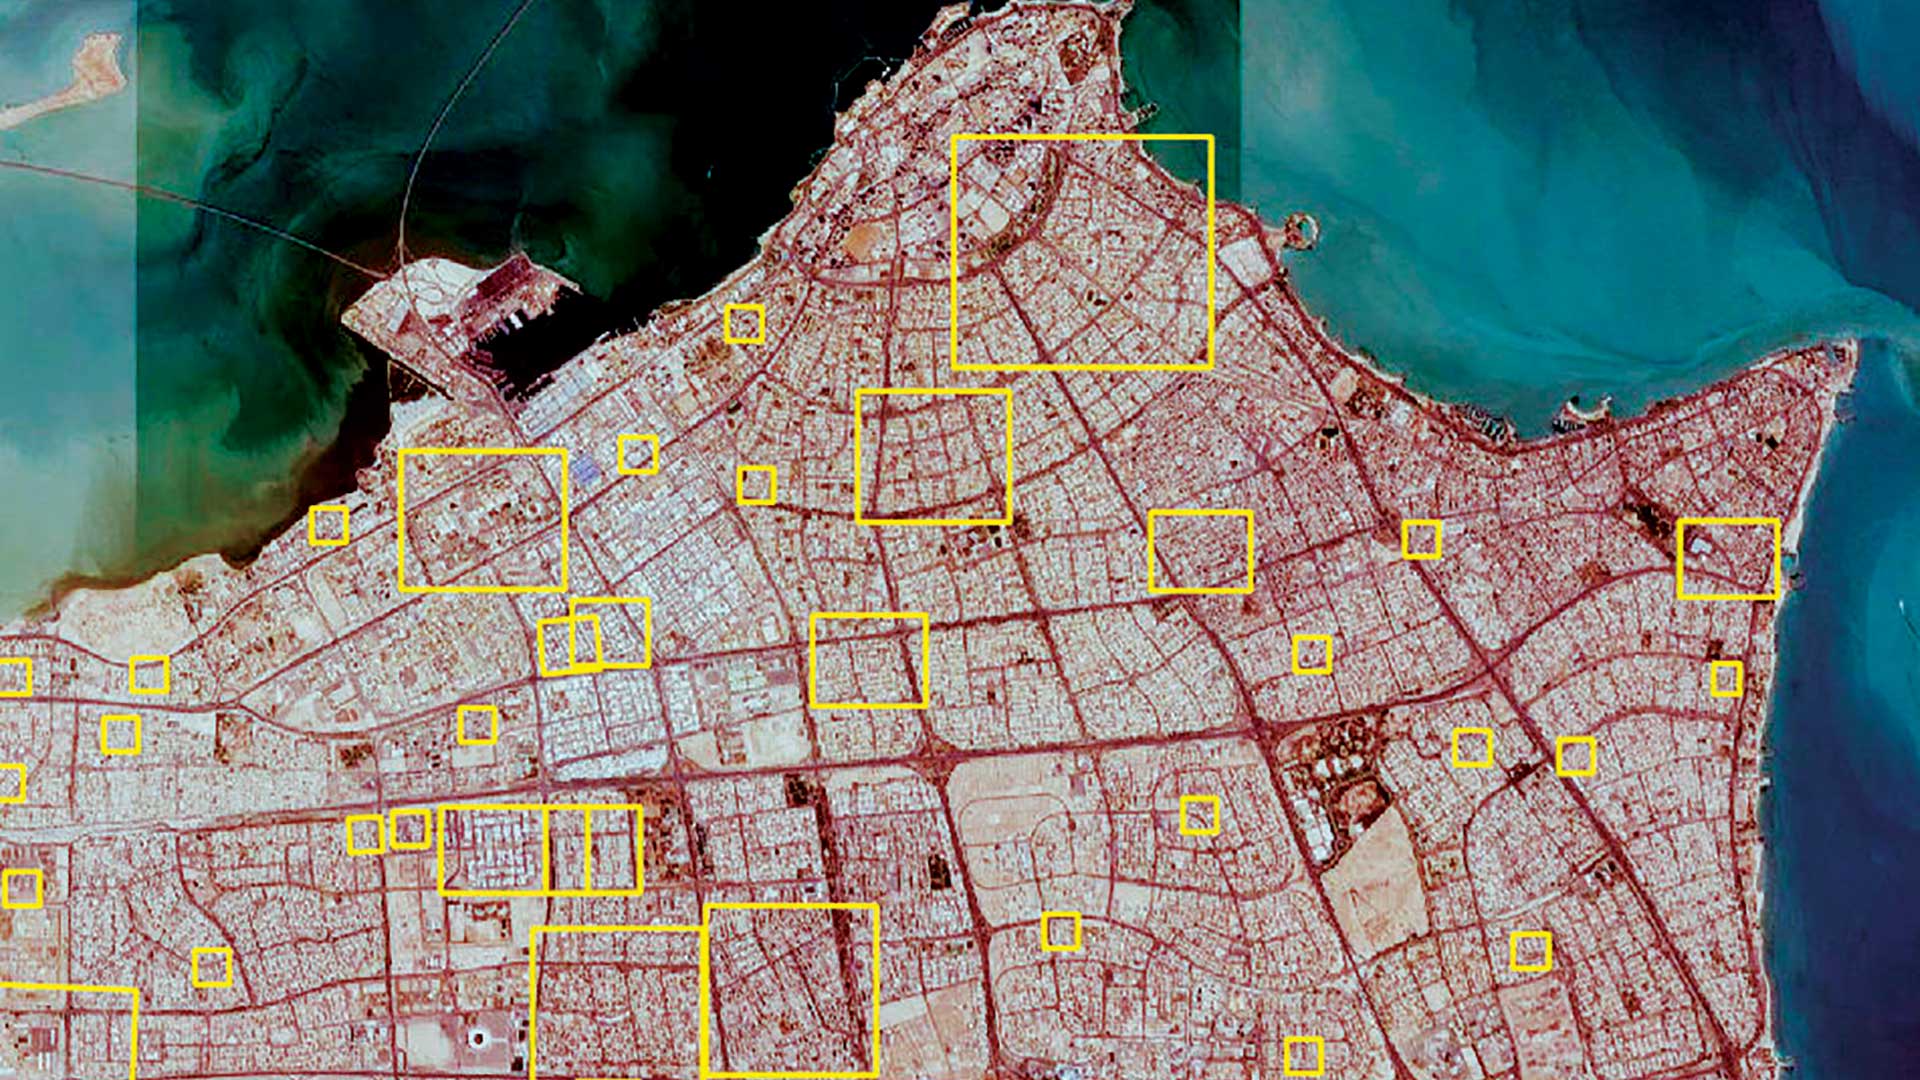
Environmental intelligence provides insights into how our changing environment affects society, from predicting how coastal erosion impacts the local real estate market to understanding the long-term effects of unhealthy air quality due to increasing wildfire activity around the globe.
To capitalize on environmental intelligence, decision-makers and data scientists must ingest multimedia and highly diverse data into their analytical frameworks to contextualize their own information with auxiliary data at the interface between humans and the environment. In many regards, the diversity of data sources is more important than the sheer size of individual datasets. This puts data integration and interoperability at the forefront of data science and data-driven decision-making.
For instance, commodity trading companies incorporate climate change effects at different spatial and temporal scales into their decision-making. They also consider the effects of public opinion and changes to environmental policy. Consulting companies offer their customers near real-time analysis of markets and assets based on extracting and geolocating information from unstructured text such as news.
Humanitarian relief organizations include causal analysis in their GIS workflows to model relations such as those between hurricanes and cholera outbreaks. And government agencies rapidly integrate economic indicators with anonymized human movement statistics and relate them to a wide variety of forecast models to study the spread of COVID-19 under different scenarios.
Such information not only comes from a wide variety of sources and media types, but it also challenges our narrow definition of what counts as geographic or spatial data.
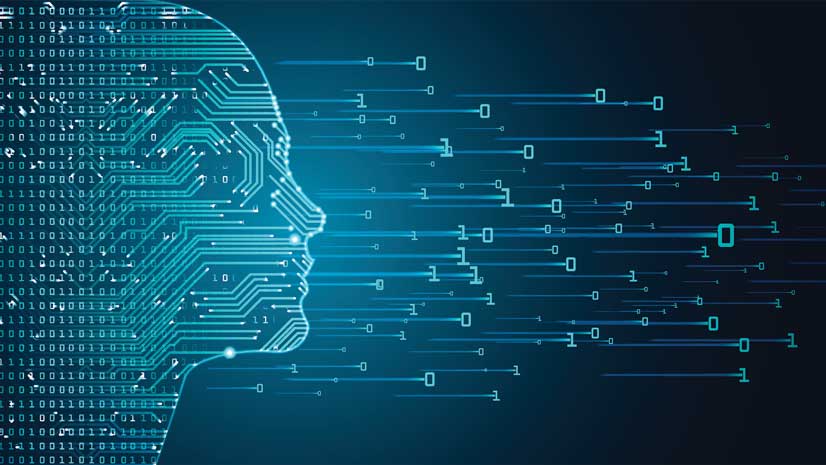
Knowledge graphs are both an emerging paradigm and a technology stack that allows reenvisioning how data is represented by focusing more on the connections between places, people, events, diseases, news, and other factors instead of merely focusing on properties. These graphs combine scalable technologies, semantics, and data cultures to represent densely interconnected statements derived from structured or unstructured sources across domains in a reasonable way that is readable by humans and machines.
These graphs originate from a vision of the World Wide Web that transitions from linked documents to linked data. This vision has partially been implemented in search engines and virtual assistants such as Apple’s Siri. It allows those systems to directly answer questions, rather than merely pointing to web pages containing relevant information.
Because knowledge graphs focus on connections among arbitrary entities and their properties, they support complex crosswalks even if not all nodes on a query path are spatial. [Metadata crosswalks translate elements and values from one schema to another schema. They have been developed between metadata standards such as Dublin Core and MAchine Readable Cataloging (MARC).]
For instance, with the rising role of environmental, social, and corporate governance (ESG), a company may want to document that none of its value chain suppliers (and their suppliers) makes use of forced labor. Such a query would span several datasets, each of them containing partial information about companies, goods, manufacturing processes, people, demographic factors, and policies. Despite the deeply spatial nature of these queries, current geographic information systems struggle with such tasks.
Technically speaking, knowledge graphs enable seamless crosswalks by explicitly representing identity and equivalence relationships between individuals and classes. For instance, they state that a global place identifier used in one data hub signifies the same place as a second identifier in another part of the graph.
This allows partial information from multiple sources to be merged, providing a more holistic picture of that place.
Similarly, relationships can be defined on the schema level. For example, by declaring that the meaning of forest used by one data provider is broader than the definition of forest applied elsewhere.
These schemata are called ontologies, and their rich axiomatization supports semantic interoperability and machine reasoning. The ability of web-scale knowledge graphs to handle diverse and even contradictory ontologies is a core strength of these technologies. Meaning is in our heads, not in the world. Consequently, concepts such as forest, drought, and poverty are artifacts of human cognition that vary geographically and through time.
The National Science Foundation (NSF) has created a new large-scale structure called the Convergence Accelerator. For one of its first tracks, NSF selected the topic of open knowledge networks. As part of this program, a team of partners from industry, government agencies, humanitarian relief organizations, and academics are working on a project that is creating the KnowWhereGraph. This is an openly available graph and situational awareness services for data at the human-environment interface.
This graph spans topics as diverse as soil health, hazards, food supply chains, commodity markets, human expertise, and the historical slave trade. It is walking the divide between the physical sciences and the humanities. For example, it enables querying of the path of an approaching cyclone to check whether there has been a recent outbreak of cholera in the regions that will be affected by the storm; it also suggests experts who have worked in those regions as well as related hazards that might affect relief operations on the ground.
At first, it may not be clear how identifying human expertise relates to GIS. Interestingly, expertise itself is a deeply spatial and temporal phenomenon. Researchers may have worked on a topic years ago but then moved on. Similarly, they may have expertise in a specific topic related to a given region, such as the effects of droughts and floods in sub-Saharan Africa. Given their strong focus on geometries and absolute reference frames, GIS is not yet well equipped to support such use cases.
The value proposition of the KnowWhereGraph—and knowledge graphs in general—goes beyond providing a unified framework for accessing data on the level of individual statements (e.g., observations), but also in overcoming the data acquisition bottleneck. Experience shows that most of the resources for a typical data science project—human, financial, and temporal—are spent on data acquisition, cleaning, integration, and apportionment. This leaves few resources for deriving insights from data. This turns the desire for data-driven decision-making into wishful thinking for many smaller projects or companies.
Knowledge graphs and situational awareness services that enable decision-makers to enrich their own data with the full breadth of graph-available, up-to-date knowledge on demand have the potential to become a key part of tomorrow’s cyber-infrastructure. The ArcGIS GeoEnrichment Service offers a glimpse into this fascinating future by showcasing how users can overcome data acquisition bottlenecks. It enables them to enrich their data on the fly with a wide range of demographic variables apportioned to their study area.
Connecting such a service to a potentially open-ended, densely connected, cross-domain knowledge graph would be a logical next step. Most work on knowledge graphs so far has focused on freeing data from silos and creating smart data instead of creating smart applications through providing rich data semantics, producing powerful tools for spatial analytics and powerful graphs but no integration between them. Put differently, we must get the graphed data back into our GIS. Existing solutions merely import graph data and flatten it into a tabular structure, thereby reducing the graph to just another data store.
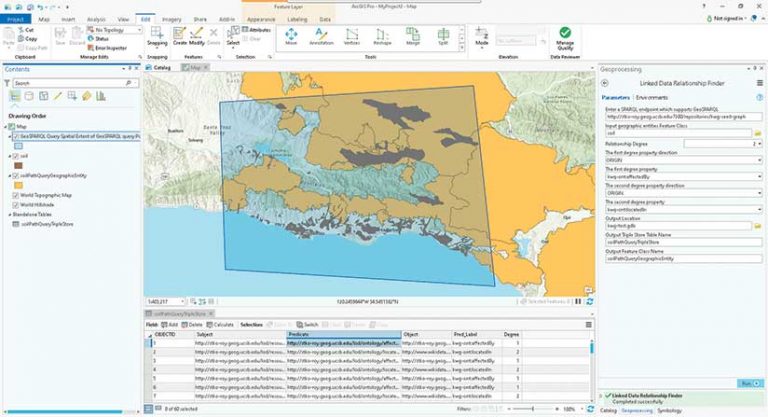
In contrast, the KnowWhereGraph project team is developing a plug-in for ArcGIS Pro that enables native graph queries from within a GIS. The plug-in creates geodatabases and their database schema during query time, allowing users to explore the KnowWhereGraph instinctively while retaining the full analytical functionality of ArcGIS Pro. For instance, a historical geographer may ask for regions studied by explorers who were students of or influenced by the famous geographer Alexander von Humboldt and display those regions together with demographic and environmental properties.
Such a path query would start at von Humboldt, find statements (called triples) about the explorers that he influenced and continue from these explorers to the regions they studied, and, finally, their properties. The data to support this query is already incorporated in graphs such as Wikidata and DBpedia.
In reality, many interesting graph queries will fail because individual links among a path query may be missing. While existing knowledge graphs contain billions of statements, they remain sparse due to their sheer size. The longer a path query gets, the more likely that a single link will be missing.
Luckily, in addition to their capacity for rapid data integration, knowledge graphs also introduce entirely new geospatial artificial intelligence (GeoAI) analytics to the GIS community. One such example is the prediction of missing links in sparse parts of the graph. Learning to predict links also provides insights such as uncovering new causal relations, contributing to the explainability of machine learning models, and growing the source graph itself at the same time.
So, what is missing? To fully enable the value proposition of knowledge graphs and their use in GIS will require engineering and research along several dimensions. As demonstrated in the past, spatially explicit machine learning models often substantially outperform more general models when applied to spatial data.
One such example is graph summarization. It describes the task of finding a representational subgraph for a given region. In contrast to ArcGIS GeoEnrichment Service, a graph cannot be easily apportioned to the user’s study area because it often contains thousands of direct statements about a geographic region.
The number of related statements increase rapidly from the initial statements. For example, the ability to seamlessly navigate from a place to information about the people born there to the companies those people founded to the places where the companies they founded are headquartered is one of the key value propositions of knowledge graphs. Efficiently computing such summaries of geographic knowledge graphs during query time remains one of many unsolved problems.
Another pressing issue results from biases encoded in these graphs and the services that run on top of them. The uneven geographic coverage of data is one such bias. We know more about some parts of the world and less about other parts. Similarly, the knowledge about many notable events, historical figures, famous places, and companies results from a particular perspective that has its own cultural biases.
While knowledge graphs offer the technical capability to integrate different views and foster participation and inclusion of data based on open standards, utilizing these technologies to enable a more holistic perspective on Earth and societies will remain a joint challenge for years to come.
Deeply integrating knowledge graphs and graph data models more generally into ArcGIS Pro will not only provide a wealth of diverse data to GeoEnrichment Services and open new types of analytics but also enable graph users to finally analyze their data from within a GIS.
For more information, contact Krzysztof Janowicz at janowicz@ucsb.edu.
About the author