Russ Butler and Craig Gillen, along with a team of undergraduate research assistants at AdventHealth University (AHU), have been applying GIS technology on the micro scale to add image classification to spatiotemporally stamped human health data.
Butler and Gillen are not the first to apply GIS to analyzing the human body. Eric J. Topol, an American cardiologist, scientist, and author, proposed a human GIS in “Individualized Medicine from Prewomb to Tomb,” an article published in the March 27, 2014 issue of Cell. Topol’s theoretical human GIS
model incorporated layers of human health information from individual biological molecules in context with environmental conditions.
According to Butler, who is the director of the Center for Population Health Research (CPHR) at AHU, the relationship between human health and well-being corresponds to factors that range from the molecular to the global scale. “We are spatiotemporal beings, and GIS has the inherent capacity to capture these layers. GIS can provide us with a more comprehensive view of a patient for both treatment and prevention,” said Butler.
Embedded in GIS systems are powerful image classification tools. These tools, in conjunction with Human GIS layers, could provide a unique way to visualize patient medical information. To augment practitioner diagnoses, imaging data such as biosensors, X-rays, MRIs, mammography, and sonograms could be classified in ways that make the data machine readable, analysis ready, and ultimately more useful.
Moreover, all this information can be linked to a patient’s geographic coordinates. The places where people live, work, and play are known to affect life expectancy, wellness, and health. The image classification abilities of GIS, together with its amazing capacity for almost limitless data layering and analyses from molecules to environment, could provide novel insight into understanding the complex factors determining human health and wellness.
Present-day electronic health records (EHR) systems compile extensive patient-related information. But, EHRs do not currently integrate all pertinent patient information, such as classified patient imagery and allied health notes on neighborhood characteristics, physical and occupational therapy, rehabilitation, and dietary and nutrition services.
Butler and Gillen are performing spatial analyses at the micro-GIS level by modeling cellular distributions to better understand Mycobacterium tuberculosis—the bacteria that causes tuberculosis (TB)—a disease that has infected humans for millennia. The World Health Organization (WHO) noted that 1.5 million people died from TB in 2020, making it the second-leading infectious killer after COVID-19.
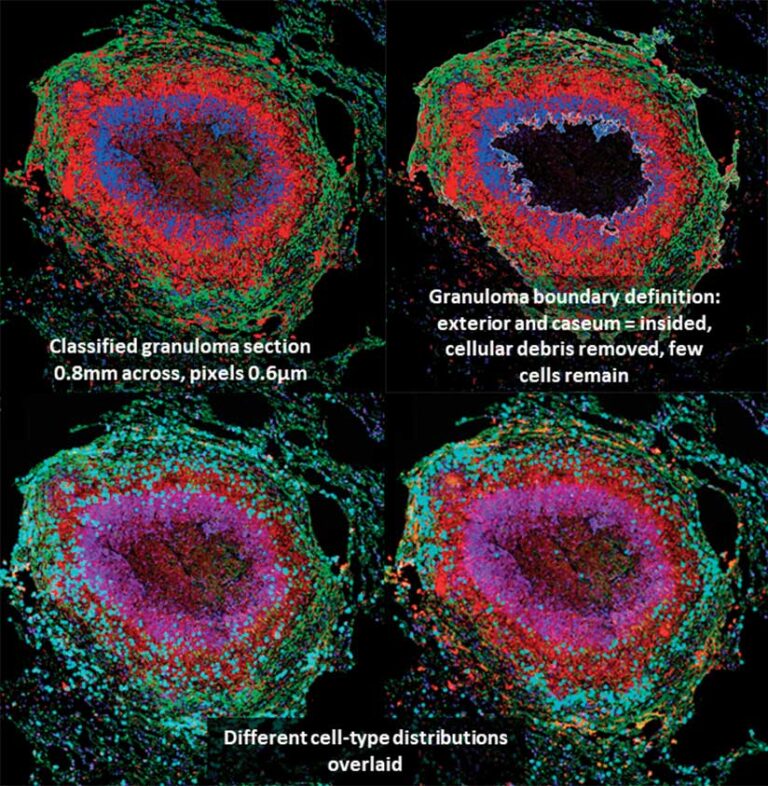
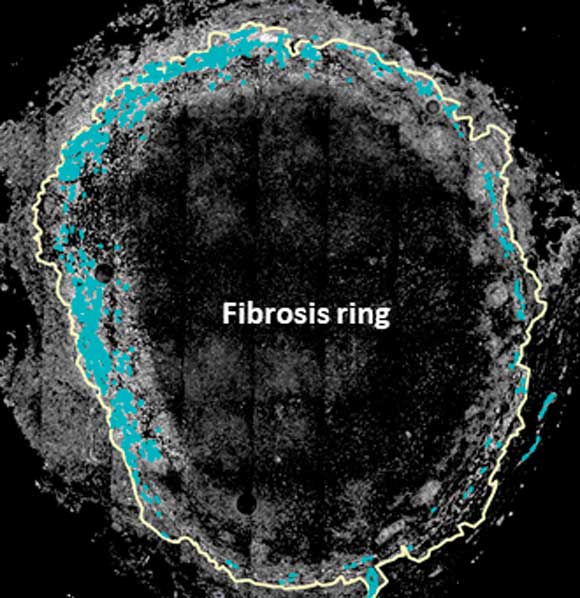
“TB is a difficult disease to treat. One of its intractable features is the formation of multiple cellular masses within the lungs called granulomas,” said Butler. “TB granulomas are small masses formed during infection that develop and grow through a dynamic process between the host immune response and mycobacteria. It is well-known that granuloma-scale outcomes, are related to disease severity.”
Researchers used knowledge gained through these runs and applied it to unsupervised runs. These classifications produced subsequent category collapsing to identify the desired cell types.
“This is a very complex process where human input and machine classifications are iterative, with the human input the final arbiter,” said Butler. “For example, unlike, say, a forest classified from satellite imagery, our images have depth.” A tissue section of a cell could be angled from deep in the cell to its surface, which would vary the expression of staining.
This process is much more complex than classifying a forest on a slope because the samples the team works with—tissue, intracellular matrix, or other cells—are more difficult to handle. As a result, Butler noted that, “It is virtually impossible to produce an undamaged tissue sample that is only one cell thick. We have been working on this for five years now and appreciate the advice and support that Esri staff members have provided us.”
Extending the micro-GIS capabilities for cell image analysis to human imaging modalities, such as X-ray, MRI, CT scans, and ultrasound—when combined with immunology, microbiology, histology, and/or epidemiology—could lead to a significant reduction of the global burden of disease concluded Butler.
Using micro-GIS to quantitatively assess granuloma structure, Butler believes this research can significantly contribute to understanding TB and lead to better treatment outcomes. Butler, in collaboration with researchers from the University of Michigan and the University of Pittsburgh, has published several papers about the use of micro-GIS to examine granulomas.
“Using the power of ArcGIS classification algorithms and by applying Cartesian coordinate systems, we are among the very first to create a novel pipeline for spatioquantitatively defined cellular patterns within granulomas,” said Butler. Several different image classification techniques were used—support vector machine (SVM) and random tree—on a variety of granuloma images. These supervised machine learning techniques require training sample files. These training files were created by selecting as many as 100 sample sites of the different cell types.
Researchers were interested in two to three different cell types for any given image or project. The analysis used geoprocessing tools, often the Classification Wizard, to produce classified images that provided feedback about the distributions of different cell types.
This also showed that staining techniques often resulted in cellular debris being misclassified as cells. The use of geoprocessing tools helped to develop an unsupervised classification process, which greatly helped separate stained cells from merely stained cytoplasm. Classified images compared to the same stained biological samples revealed the cellular nuclei.
About the author