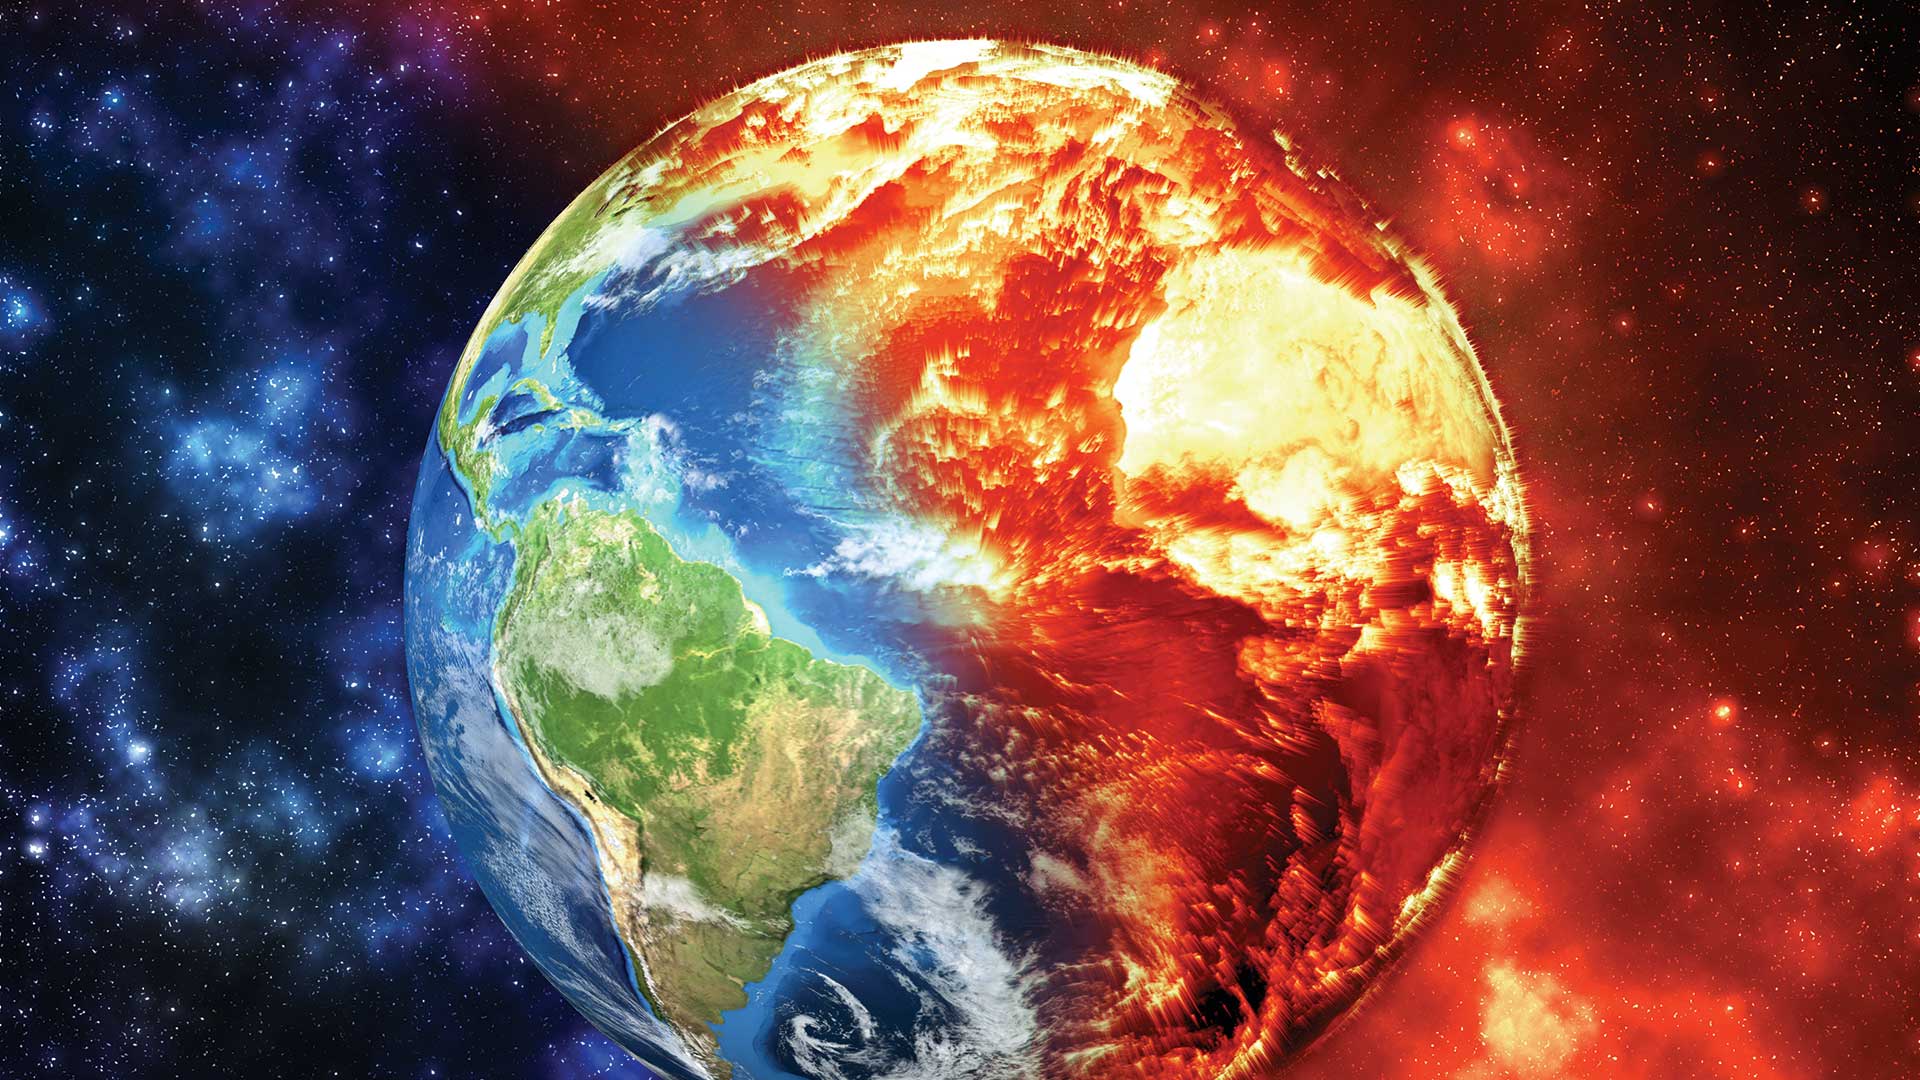
Climate change, already a generational challenge, produces another problem that can feel insurmountable: hopelessness. Highlighting the climate action efforts and solutions that are underway—and showing progress—is a viable antidote and the focus of Atlas of Climate Action: Resilience and Reduction through a Geographic Approach, an event sponsored by Esri that was presented by the Los Angeles Times in September 2022.
“The changes we’re seeing are unprecedented in the history of human civilization on this planet. But there is so much good work going on,” observed Katharine Hayhoe, who led a discussion into the steps being taken to tackle the effects of climate change including the use of GIS and data analysis. Hayhoe—my friend and an enduring source of hope—is the chief scientist of The Nature Conservancy.
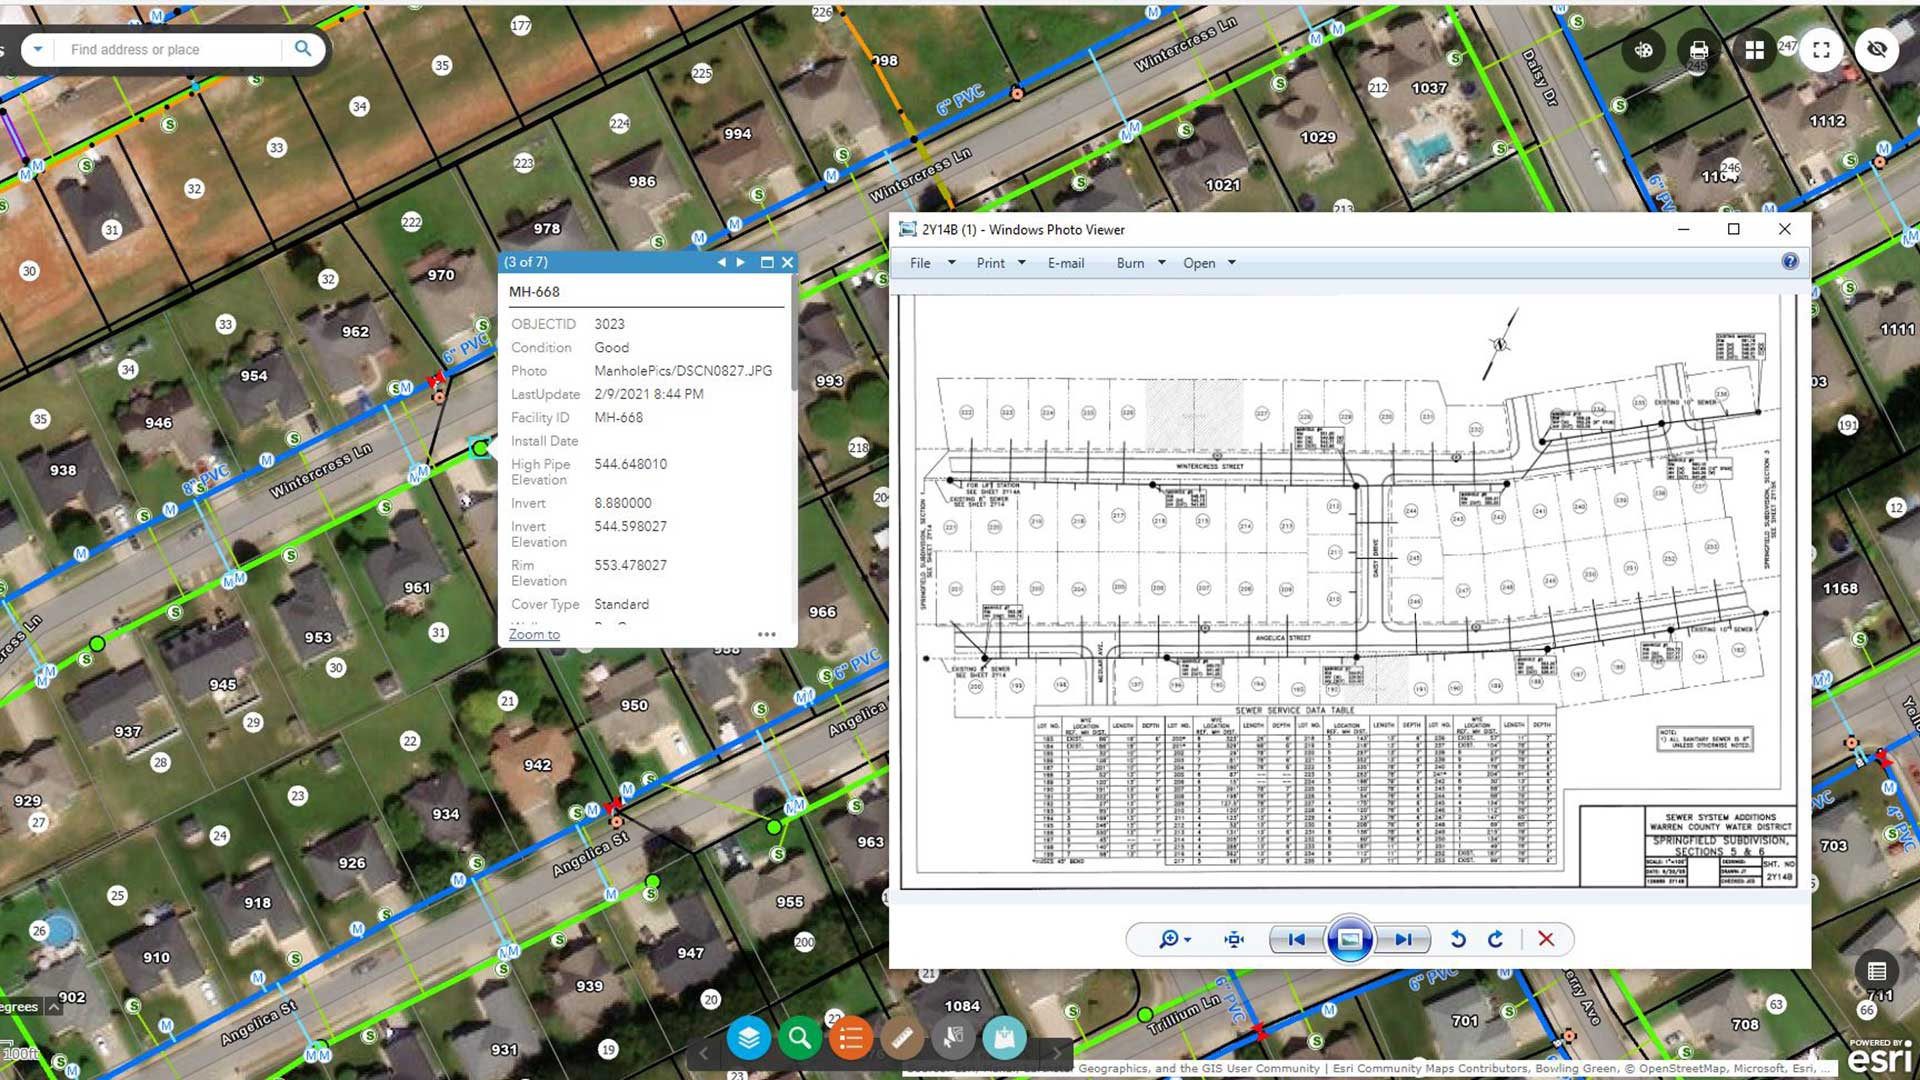
Much of that good work is a result of the amount of location-based data that is being collected from satellites, sensors, and people on the ground, and gathered and analyzed with GIS. In GIS, users run models, display progress on dashboards, and make data and data products available to whoever may want it. Open data and open science are fueling a more inclusive and collaborative approach to meet the urgency of the moment.
Based on what we learned at the Atlas of Climate Action event, this article outlines what’s already being done, what we can do in the future, and how we can make a difference on climate change and in people’s lives both today and tomorrow.
Focusing Mitigation Efforts
We can better pinpoint where needs exist to have the greatest, most equitable impact on environmental mitigation. Governments are using location intelligence to determine where to dedicate funding.
California’s CalEnviroScreen 4.0, a new version of the California Communities Environmental Health Screening Tool, identifies and displays communities that have been burdened by environmental harm. It combines 21 indicators of population and pollution characteristics, from poverty to pesticide use. Communities identified by the tool are then prioritized in the California Climate Investments program, which has already invested $11.4 billion in projects aimed at furthering environmental justice and mitigating climate effects.
“It’s vital we understand data gaps and who might be left out because of them, as well as how to get feedback from those with the lived experience being mapped,” said Yana Garcia, California’s secretary for environmental protection. “Open government and open data must be constants,” Garcia said.
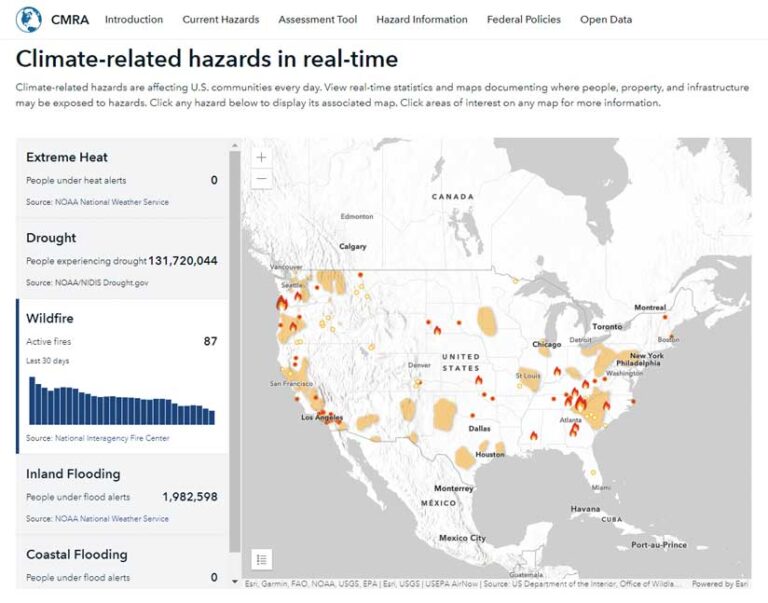
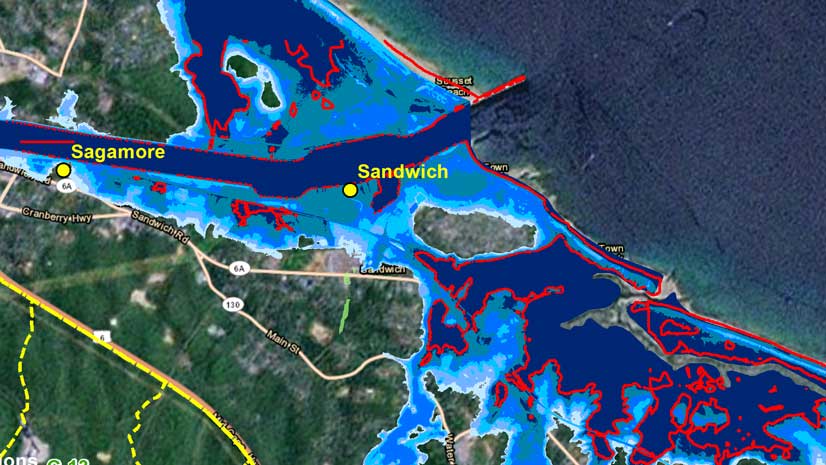
Nationally, the White House’s Climate Mapping for Resilience and Adaptation (CMRA) portal, produced in collaboration with Esri, explores current and projected climate conditions. This data highlights climate risks where we live and work, helping communities better prepare. And it elevates equity, an important metric that may make places eligible for government funding to build up resiliency. At an announcement for the portal, Phoenix mayor Kate Gallego noted that the city is spending tens of millions of dollars on climate resilience, “and this tool will help me understand where the most effective places are to put these dollars.”
Adapting to Threats
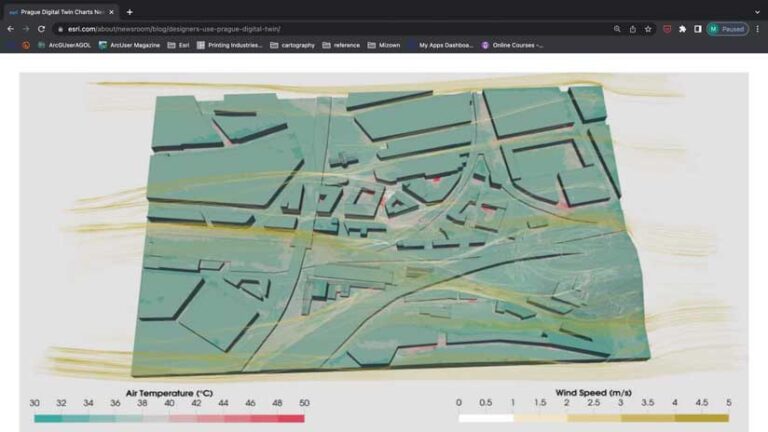
We can see the risks cities are facing using sensor and satellite data to visualize vulnerability and build up resilience to threats. The City of Prague is studying which areas are most prone to extreme heat and using that information to decide where to plant trees and grass and install cooling surfaces.
Extreme heat is among the deadliest effects of climate change, and cities use GIS to examine heat islands and design mitigation measures to combat rising temperatures. Officials with the Prague Institute of Planning and Development are measuring and monitoring environmental changes (including temperature, humidity, and solar radiation in ambient air and the soil) and how adjustments to buildings and landscapes make a difference.
The analyses include visualizing the amount of chlorophyll plants that emit and studying the fluctuation of surface temperature with the aim of drawing down heat in densely populated areas of the city. All of this is helping Prague plan for worsening heat waves by designing adaptable future developments that better withstand environmental impacts.
Dealing with Extreme Weather
We are using location intelligence to prevent flooding by using smart sensors to divert runoff to where there’s capacity. The company Xylem has been using sensors to monitor water levels and flow during storm surges, combining data from devices with machine learning to know which water storage facilities are full or which have the capacity to take in more runoff. The awareness is used in the moment, automating the opening and closing of valves to divert water to where it can fit during a storm.
Sensors can determine how much water is being used for crops during a drought. At a time of extreme drought in California, Land IQ, an agricultural and environmental consulting firm, monitors water use and crop acreage for both the agricultural industry and government regulators. It presents facts supported by science with data collected from satellites and on-the-ground measurements.
To find available public lands that might be ideal for holding solar panels, The Ray, an Atlanta-based nonprofit, uses maps to identify the best open rights-of-way along highways and freeways to position solar panels, making the most of unused public land by using an analytical map-based tool developed in partnership with Esri.
Observing the Earth
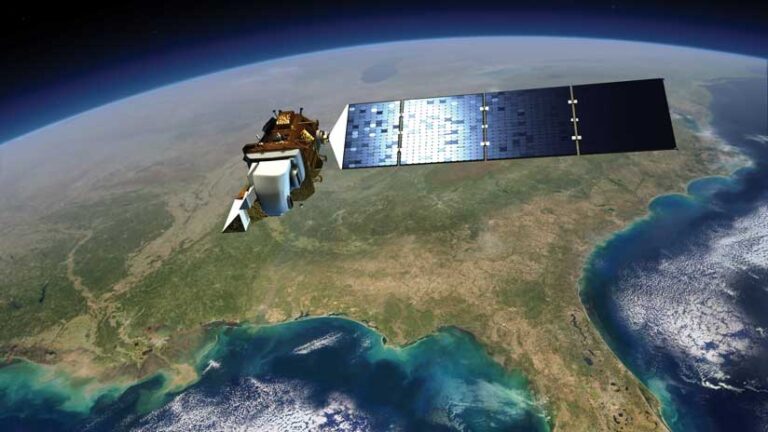
We are not only exploring space but also closely observing what’s happening on the earth. A fleet of about 20 National Aeronautics and Space Administration (NASA) science missions has been orbiting the earth since the early 2000s. The sensors aboard these satellites record not only the ever-changing condition of ecosystems and agricultural land, but also the state of the cryosphere (the part of the earth’s surface where water is in solid form) for sea level rise monitoring. The data provides continuous information for input into GIS models to track a wide range of climate variables, as well as biodiversity loss, from regional to global levels.
To bridge information gaps, satellites keep an eye on parts of the world that haven’t been observed as closely before, said Carmen Blackwood, a scientist with NASA’s Jet Propulsion Laboratory.
Planting Trees for Optimal Impact
We aren’t simply planting more trees; we’re planting trees where they’ll benefit the most people and thrive. It’s critical that trees be planted in the right forests, in the right urban locations, and at the right time, said Paul Cooper, chief information officer for the Arbor Day Foundation. That’s where GIS outputs, including maps and dashboards, help inform people where heat islands exist or where there’s a lack of shade. “Being able to pull up either your neighborhood or that forest that you’re interested in and see where those impacts can be made most effectively—that’s where we want to plant our trees,” he said.
Integrating Traditional Wisdom
We’re taking a nature-based approach. The Karuk Tribe of Northern California has been utilizing geospatial technology as it revives its ancient traditional practices of prescribed fires and cultural burning to not just suppress potential fires but also clear dangers to homes and roads and improve stream flow—which can, in turn, cool temperatures.
Making Sustainable Choices
We’re using maps to make more sustainable choices about appliances with heavy energy consumption. Space heating and domestic hot water use are responsible for much of the energy use and carbon emissions by the New York City Housing Authority’s 400,000 residents. The agency has been using maps to identify areas that need improvements. It invests in new technologies that are not only efficient but also affordable and don’t diminish residents’ quality of life, such as heat pumps. It’s one element of what the agency’s senior vice president of sustainability, Vlada Kenniff, called its “geographic path to decarbonization.”
Building Resilience
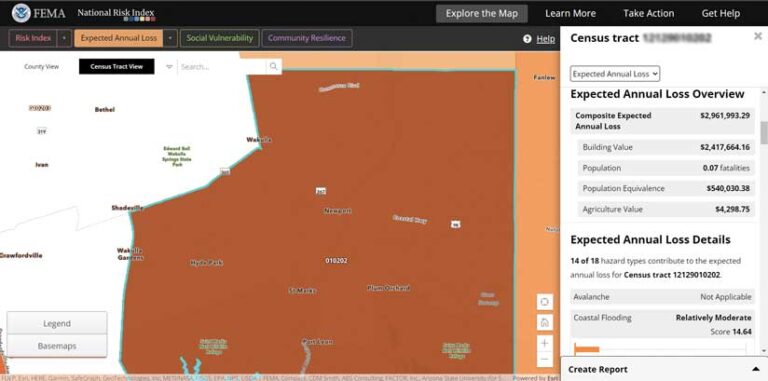
We’re not just responding to disasters; we’re equipping communities to better withstand them when they happen. Tools like the US Federal Emergency Management Agency’s (FEMA) National Risk Index for natural hazards, an online mapping application, help the agency and public identify where risks may be disproportionately greater. The tool combines data on 18 potential natural hazards and helps communities consider social vulnerabilities. By knowing what the risks are, people can better plan how to make their communities more resilient. FEMA has also launched a national building code strategy to encourage the adoption of hazard-resistant building codes for new and existing structures. The standards are included in the White House’s CMRA portal alongside metrics about the more extreme hazards we face.
In each of these examples, climate action is benefiting from a growing amount of geographical data available at our fingertips like never before, and GIS is helping make sense of it.
Or as Hayhoe so succinctly put it, “The more we know, the more decisions we can make that are informed by what’s already happening and by what we expect to happen in the future.”
Listen to this podcast in which Katharine Hayhoe discusses how science is refining communication methods to better explain climatic data.