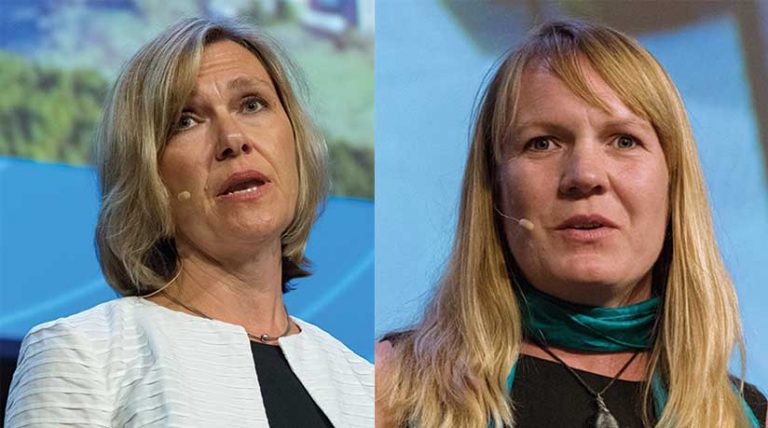
The subject of the Keynote Address by Olga Wilhelmi and Jennifer Boehnert to the 2019 Esri Science Symposium was especially topical, as some of the highest temperatures ever recorded occurred during the previous month. In their July 9 speech, the pair discussed their work on heat waves just weeks after Europe experienced its hottest June on record and India had been scorched by blistering temperatures.
In temperate San Diego, California, nearly 700 people attended the fourth annual Science Symposium, held in conjunction with the Esri User Conference (Esri UC) and the Esri Education Summit. The event brings together scientists from domains beyond geography and GIScience and promotes networking and cross-disciplinary work. The symposium also highlights Esri’s dual commitment to science: in supporting scientists who are expanding fundamental understanding in many fields of scientific study by developing geospatial tools and in doing good science itself because science underpins the company’s work.
Each attendee of this year’s event was presented with a copy of a new Esri Press book, GIS for Science: Applying Mapping and Spatial Analytics, a collection of articles contributed by scientists who use GIS. The book, edited by Dawn Wright, Esri’s chief scientist, and Christian Harder, Esri writer and editor, highlights how scientists use GIS to understand how the Earth works, how the Earth’s appearance and function have been changed by humans, and how measurement and analysis of the Earth and its processes are used to gain understanding. A companion website, Gisforscience.com, makes resources available for each chapter in the book that include links to presentations, blog posts, tutorials, story maps, Learn ArcGIS lessons, articles, and data.
Keynote speakers Wilhelmi and Boehnert, authors of a chapter in GIS for Science entitled “Extreme Heat Event in a Changing Climate,” work at the National Center for Atmospheric Research (NCAR). NCAR’s GIS program promotes the use of GIS for both analysis and the creation of an infrastructure that facilitates atmospheric research and interdisciplinary scientific work. To this end, the NCAR GIS program has formed strategic partnerships with Esri and the Open Geospatial Consortium (OGC), Inc.
Although both Wilhelmi and Boehnert are geographers and both use GIS, they bring diverse perspectives to their work on heat waves. Wilhelmi, who heads the GIS program and has been leading projects at NCAR since 1999, researches the interactions of weather, climate, and society to understand the risks extreme weather events and climate change pose to society, particularly vulnerable populations, and explores potential adaptive strategies to these conditions.
Boehnert, the GIS coordinator at NCAR, supports the work of scientists and engineers and uses GIS to integrate atmospheric data with socioeconomic and geographic data. When she started working at NCAR 16 years ago, using GIS in atmospheric science research was relatively new. In the intervening years, she has been involved in research on integrating atmospheric data and science with the tools, data, and analysis methods of GIS.
An important part of this integrative work has been developing the capability of ArcGIS to directly read Network Common Data Form (netCDF) data. The netCDF file format is widely used in the scientific community for storing multidimensional scientific data, such as temperature, humidity, and pressure, and is typically used in atmospheric and ocean research. Because it is self-describing, a netCDF file includes information about the data it contains such as when data was captured and what measurement units were used. Nawajish Noman, who leads software development teams at Esri, worked on developing the netCDF direct read capabilities in ArcGIS. He noted that Wilhelmi and Boehnert were critical to the successful implementation of this functionality because they provided data and use cases and were a direct link to the broader scientific community.
In introducing their keynote, Wilhelmi and Boehnert surveyed the effects of climate change, including an increase of extreme weather conditions that have led to disasters ranging from coastal flooding caused by storm surge to crop-killing droughts that create ideal conditions for deadly fires. However, excessive heat events are the focus of their research.
The deadly nature of extreme heat is unappreciated. The Centers for Disease Control and Prevention attributes 600 deaths annually to excessive heat. GIS has been valuable in Wilhelmi and Boehnert’s study of excessive heat events or heat waves. Heat waves are defined as being prolonged periods of temperatures higher than normal for a place.
In an analysis of future climate scenarios, they used NCAR’s Community Land Model Urban (CLMU), which simulates the climate of urban environments. They averaged hourly data in netCDF format for 20-year periods for the United States to smooth out single-year extreme events and uncover longtime climate trends. The period 1986–2005 was designated as present day, and model simulation projections for 2046–2065 designated as mid-century.
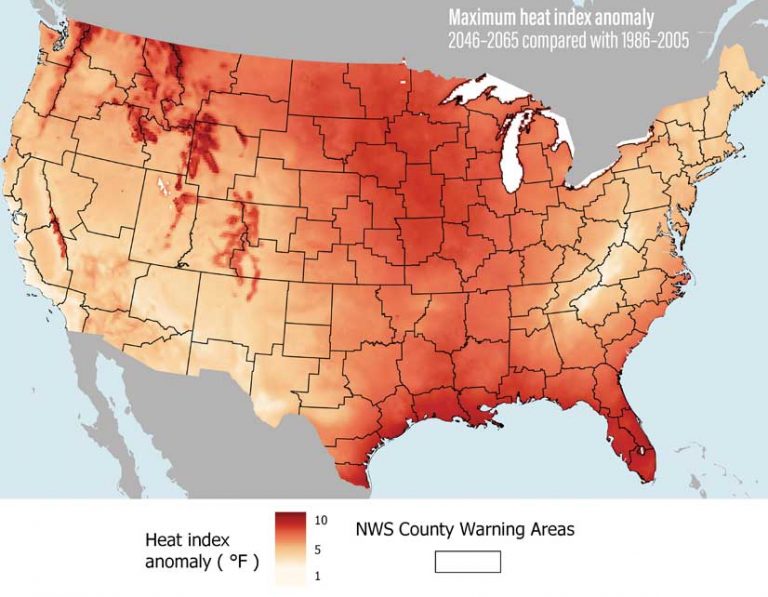
By using the ArcGIS raster calculator to subtract averages from the current period (used as the norm) from the averages projected by model simulation for the future period, they determined an anomaly (i.e., deviation of a meteorological variable from the mean value). This anomaly—when mapped—was most pronounced in the southern and southeastern portions of the country. Mountainous areas of the West and some portions of the Midwest also have projected higher temperatures.
The increase in world population, with a greater percentage of that population dwelling in cities has an adverse affect on local conditions. Greater population density, more human activities causing more emissions from cars, factories, buildings, and the surface characteristics of the built environment in cities, (use of concrete and other impervious surfaces), geographic location, and regional climate can all amplify heat conditions. They can cause urban heat island (UHI) effects, which are characterized by temperature differences between cities and the surrounding nonurban area.
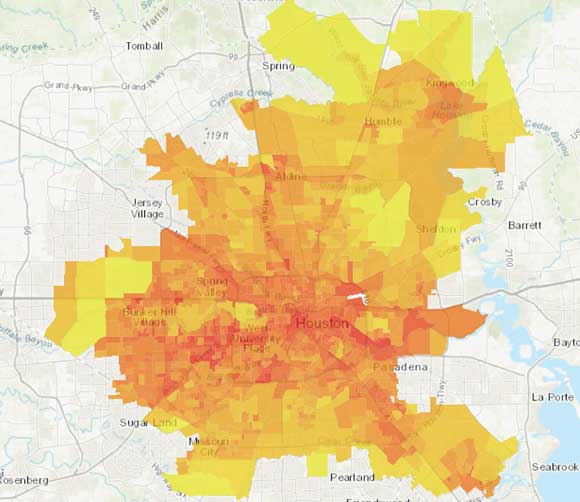
Beyond assessing trends on a national scale, Wilhelmi and Boehnert developed a methodology for analyzing climate data on conditions that could influence actions locally. They modeled data for the Houston-Galveston area of Texas to understand the variability of heat events from year to year and the potential effects on area residents.
They performed spatiotemporal analysis of multidimensional data in netCDF format using ArcGIS Pro and ModelBuilder. They found the data clock chart, available in ArcGIS Pro, to be a most effective method for portraying changes in average daily maximum heat index (HI) findings. They used data clock charts to compare current and future periods as to the number of days, intensity, and season.
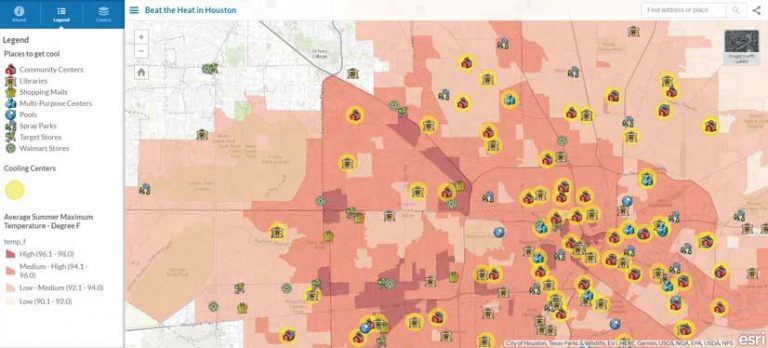
From a policy standpoint, an example of how to deal with an increase in extreme heat events could be providing access to cooling centers (air-conditioned public buildings) to mitigate the potentially lethal effect to at-risk populations, such as seniors or the disabled, as well as modifying regulations regarding utility shutoffs, evictions, and outside work. As a practical output of this work, Boehnert created a map on ArcGIS Online that identified the cooling centers in Houston.
The work by Wilhelmi and Boehnert highlights a new reality for planning, public health, and other organizations given trends in both climate change and land use that amplify UHI effects. Projections show that just a change of one degree leads to drastic changes in the effects of heat waves on populations.
In concluding their address, they expressed the hope that their research will help governments and other organizations respond to heat events that will likely be more frequent, intense, and sustained by revising warning systems, implementing policies to mitigate adverse effects, and making efforts to identify and protect vulnerable populations. They urged taking an integrative approach to dealing with these conditions that incorporates society, science, and technology.
In the question and answer period following the address, members of the audience suggested ways to broaden the impact of this work by using citizen science groups to capture more types of data; making high-resolution, gridded climate data more widely available; and enlisting other segments of the scientific community.
As Wilhelmi and Boehnert’s work demonstrated, GIS supports the analysis and visualization that advances understanding of the Earth and how it is affected by human activities and helps communicate that knowledge.
About the author