Have you played around with the new Map Viewer in ArcGIS Online yet? It offers a highly interactive mapping experience for creating impactful visualizations of your data.
The good news for developers is that the powerful data exploration tools, mapping styles, interactive filtering, and pop-ups—even the ability to save web maps—in the new Map Viewer were built with the ArcGIS API for JavaScript. That means that you can create the same experiences for users of your own custom apps.
Let’s look “under the hood” of the new Map Viewer to learn how the ArcGIS API for JavaScript was used so you can use new pop-ups, labels, widgets, data exploration, vector tile styling, and web map saving capabilities in your next web mapping app.
Pop-Ups
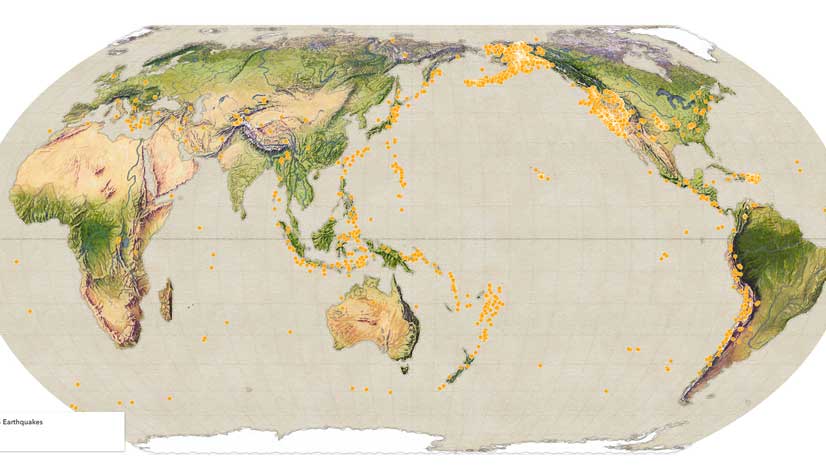
In the Map Viewer, pop-ups play a key role in how end users explore data in a map. The new Map Viewer offers a better pop-up experience. Pop-ups are responsive and dockable. Attachments accessed from pop-ups automatically rotate and display thumbnails for document types.
In the ArcGIS API for JavaScript, pop-ups are defined in the API using a pop-up template. You can organize content any way that you want, including multiple blocks of text, fields, attachments, and media such as charts. In addition, pop-up actions are a handy innovation in the API. Pop-up actions are a very simple way of adding a button to the pop-up to execute custom code when clicked. For example, you might add an action that performs a buffer around the selected feature and locates and highlights all the points of interest within that buffer.
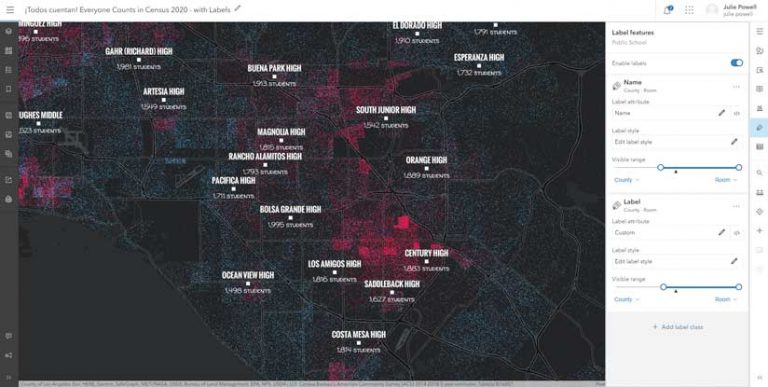
Labels
In the Map Viewer, there is a lot of flexibility when it comes to labels. You can use multiple label styles for different configurations. For example, labels for sales numbers for specific stores can be shown as black if increasing and red if decreasing. You can customize labels with specific fonts and colors that match symbology elsewhere in the map, display labels stacked in multiple lines, or specify vertical and horizontal offsets for labels. Map rotation is supported so when the map is rotated, client-side labeling does not rotate and is properly displayed and easily read.
In the ArcGIS API for JavaScript, the added labeling flexibility in the Map Viewer is due to the labeling enhancements in the API. Developers can define where a new line is placed by using either an ArcGIS Arcade expression, TextFormatting.NewLine, or by specifying the maximum width for individual lines. Labeling styles are defined as label classes in the API and can be conditionally displayed based on criteria that include aspects such as attribute values or scale.
Widgets
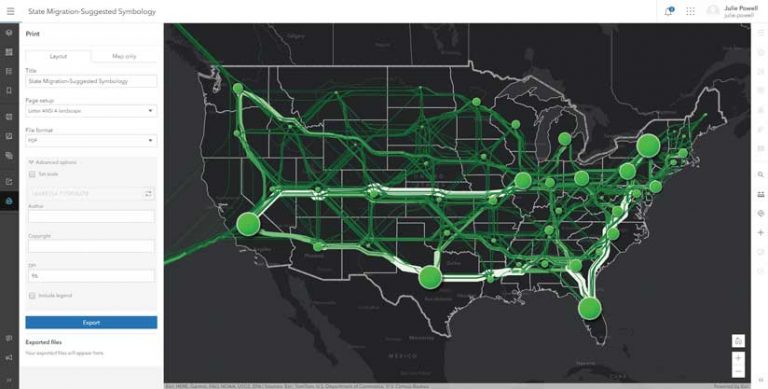
In the Map Viewer, the user experience depends heavily on widgets in the API. If you’ve been developing with the API, you might recognize many of these widgets, which have been part of the API for several releases. However, some widgets are being developed concurrently with the Map Viewer to create tools and workflows that improve the mapping experience. In these cases, the Map Viewer is updated first. The new widget is available in the API in a subsequent release so developers can take advantage of the same widgets in their apps. The measure, coordinate, print, smart mapping sliders, time animation, editing, pop-up, search, and directions are some of the widgets that debuted in the Map Viewer.
In the ArcGIS API for JavaScript, widgets are designed with the user and the developer experience in mind. An API developer works with a product engineer who really understands user needs and use cases. The API developer also teams up with a UI/UX expert, so the new widget will provide an elegant and responsive user experience. API widgets are created and positioned in apps with a few lines of code, which helps developers be productive when building UIs.
The old Map Viewer used widgets from the 3.x version of the API. The design of these widgets was refreshed when the new Map Viewer was built. For example, the print widget in the new Map Viewer offers more formats, sizes, and other options.
Developers can style a widget or use a theme to style all the widgets in an app. More advanced developers can choose to fully customize the UI of an API widget (referred to as the widget view) using the source code Esri has shared on GitHub.
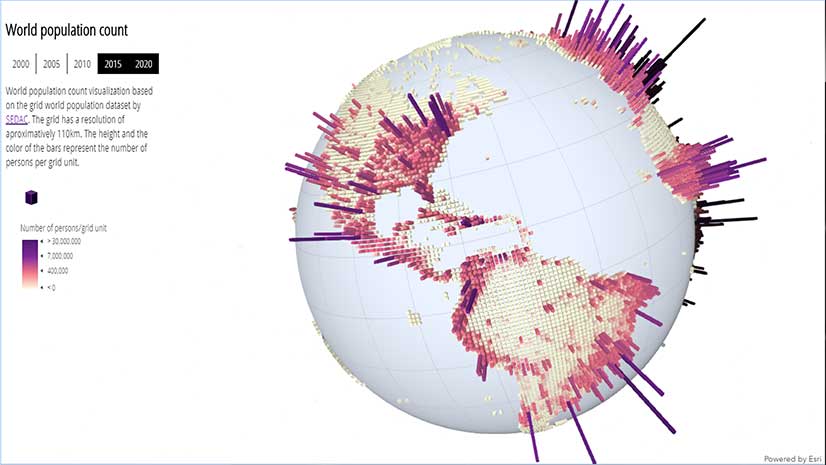
Data Exploration
In the Map Viewer, tools let you explore and better understand data. Making the map used to be the goal. However, new map exploration tools and fast map display let you use the mapping process itself to better understand your data and turn it into a more meaningful information product.
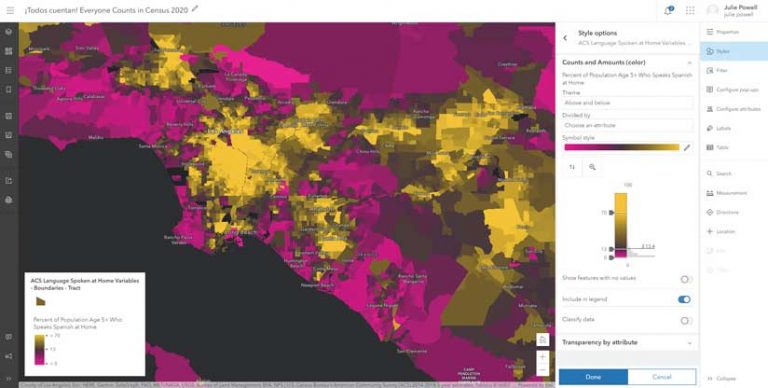
The new Map Viewer maps more data and can display that data faster. In the old Map Viewer, changing color themes used to take 10 seconds. In the new Map Viewer, changing color themes is instantaneous. The user can get creative without being penalized in terms of productivity. Seemingly immediate map updates let the user play around with various smart mapping styles and experiment with the attributes that drive the visualization.
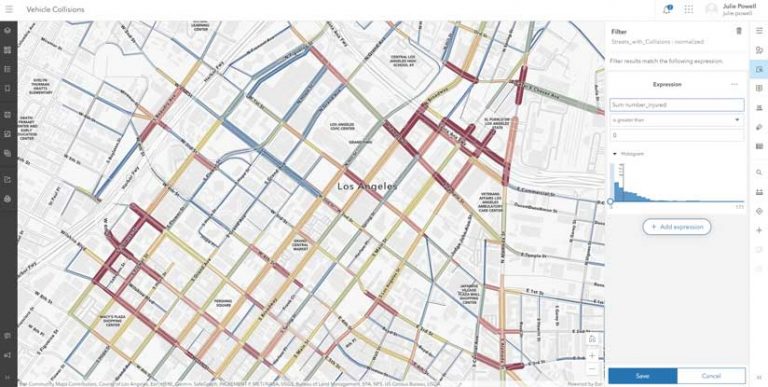
The immediate feedback from interactive filtering helps users explore data on the map and find data of interest. Filtering provides statistics such as the count of the records, sum, minimum, maximum, and average. As a filter is created, it is applied to the map display, emphasizing matching data and de-emphasizing nonmatching data.
Smart Mapping capabilities in the Map Viewer create a quality visualization by default by automatically picking a color scheme that matches the basemap used, whether it is a raster or vector basemap. The user can accept that styling or modify the color ramp or other aspect in any way.
In the ArcGIS API for JavaScript, hardware acceleration is leveraged via WebGL to rapidly render datasets of any size, from small to very large. WebGL also allows the attribute values used to render each feature to be updated quickly without reprocessing the geometries, eliminating noticeable artifacts or flashing. Build a great user experience using this capability. Provide tools that let end users dynamically switch between the attributes and rendering styles used for thematically mapping an area of interest.
The API contains an in-memory database so client-side filtering, querying, and statistical calculations can be performed. The in-memory database can process any SQL WHERE clause and spatial relationship operation that can be done in a server-side query. Everything is performed client side, which allows a user experience with immediate feedback.
The ArcGIS API for JavaScript exposes the Smart Mapping API so the developer can create map exploration tools. For example, you might want to let end users select from a list of attributes to thematically map data and use Smart Mapping tools to automatically select a style that works well with the data and matches the basemap.
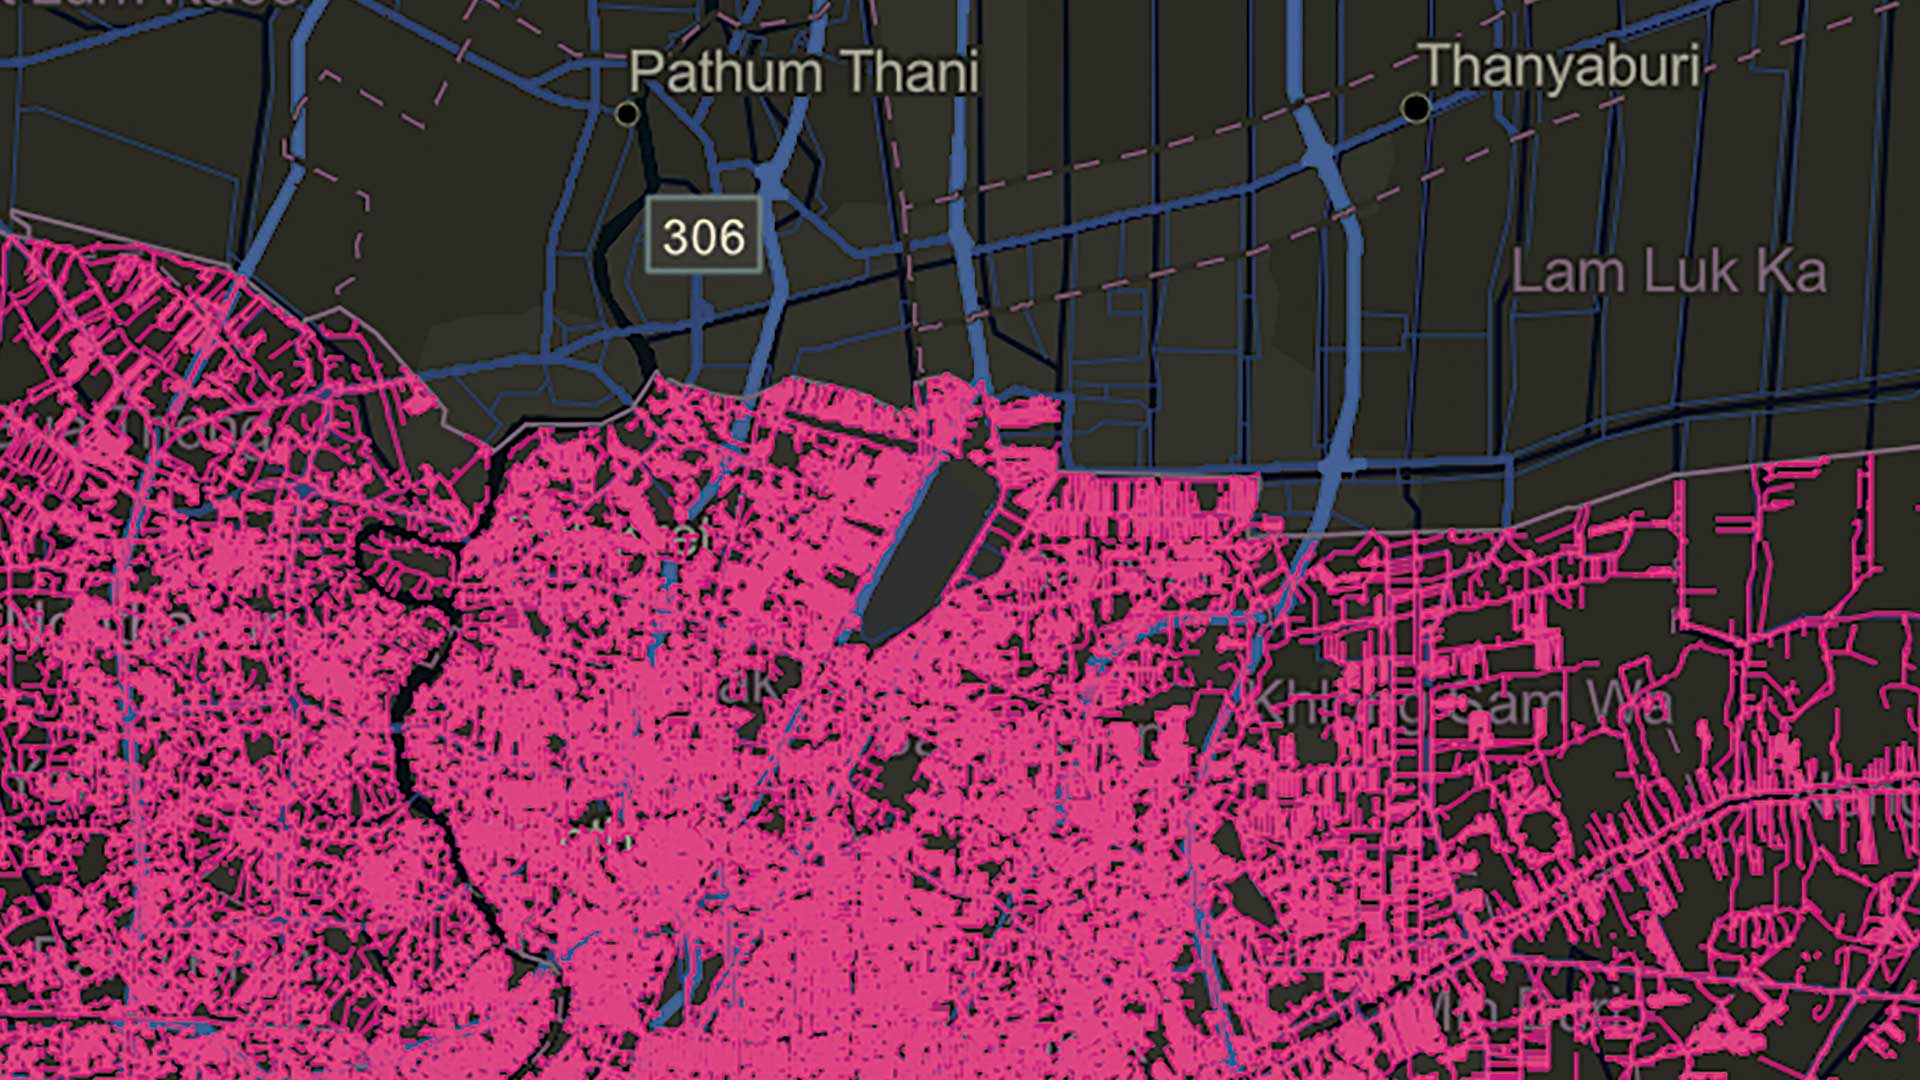
Vector Basemaps
ArcGIS Online provides a variety of vector tile basemaps. Although screen resolution varies across devices, vector tile basemaps will always display crisply. Vector data and the visual style are separate, so vector tiled layers can be customized to the map, which drives dynamic, interactive cartography. Because the process of creating and updating is a lot faster for vector tile layers than it is for raster tile layers, Esri makes more frequent updates to vector tile basemaps.
In the Map Viewer, the default basemaps are vector, rather than raster. This means a basemap can be copied and styled in any way using the Vector Tile Style Editor, which is accessible from within the Map Viewer.
In the ArcGIS API for JavaScript, you can bring in any vector tiled layer with its default style or with a custom style that you’ve created. The API lets you dynamically change the style via code.
Creating and Updating Web Maps
In the Map Viewer, the configuration of layers, style information, pop-ups, and view state (e.g., initial extent) is saved as a web map. The power of the web map is that once it is defined using a simple authoring experience, it will be consistently displayed in all ArcGIS clients with little effort.
In the ArcGIS API for JavaScript, the same web map saving capabilities in the new Map Viewer are available. When a map is saved, the new Map Viewer calls the API method webmap.save() and webmap.saveAs(). While this might seem trivial, this gives you the power to create simplified or more focused workflows for web map authoring from within your own app that can range from adding or removing a layer to updating the rendering to simply saving the view state.
Play and Get Inspired!
The new Map Viewer is growing and evolving with each release. As new features are added, they also become part of the ArcGIS API for JavaScript, if they weren’t already available. Play around with the new Map Viewer and see what you like. Then look at the JavaScript API samples to learn how you can build those same capabilities in your app.
About the authors

Julie Powell