According to the World Health Organization (WHO), roughly 16 percent of people will—at some point—experience significant challenges or disabilities that impede navigating the world or accessing online content. This article shares examples of how to structure alternative text for complex media used to create stories so that the experience is not just accessible but also an equitable and inclusive one.
Accessibility as a Standard
When we think of accessibility, we may think of the ramps accompanying stairways or the sidewalk curb cuts that are standard in most public spaces. In terms of the internet, accessibility means providing a product or service that can be used by everyone—ideally with a similar level of ease. Like well-designed stairway ramps, easily accessible content can benefit everyone.
The ArcGIS StoryMaps builder includes integrated accessibility tools that allow you to create stories that meet the Web Content Accessibility Guidelines (WCAG), which are technical standards developed by the World Wide Web Consortium (W3C). ArcGIS StoryMaps has an in-app contrast checker that will help ensure your text is visible against the background of a story. This makes creating an attractive and accessible custom theme for your story much easier.
ArcGIS StoryMaps is fully compliant with Section 508 of the Rehabilitation Act of 1973, which ensures people with disabilities have equal access to government information. Esri’s development team maintains standards that integrate the latest design options that allow audiences who use assistive devices such as screen readers to have an accessible experience. To learn more, see Esri’s accessibility resources.
Alternative Text as a Standard
Alternative text, also called alt text, is a standard feature of many websites. It is useful when media is not displayed because of bandwidth limitations, slow internet speeds, or broken links. Screen readers and other assistive technologies also look for alt text to describe media.
Within the ArcGIS StoryMaps builder, you can add alt text to all media by entering it via the options panel (the gear icon) for media such as images, embedded web content, videos, maps, and scenes. (See this video https://tinyurl.com/2wedvz42 to learn how to add alt text in a story.)
Tip: Write and edit alt text in a text program first, and then paste it into the ArcGIS StoryMaps builder.
The goal is to write alt text for media, maps, or graphics as succinctly as possible. A rule of thumb is to keep alt text to 125 characters or less and skip ending punctuation. While that usually works for simple photos, a 125-character limit may not provide a fully equitable experience when it comes to maps or complex graphics. When brevity conflicts with providing your audience with a more equitable experience, you may want to consider other options.
Options for Creating Equitable Experiences
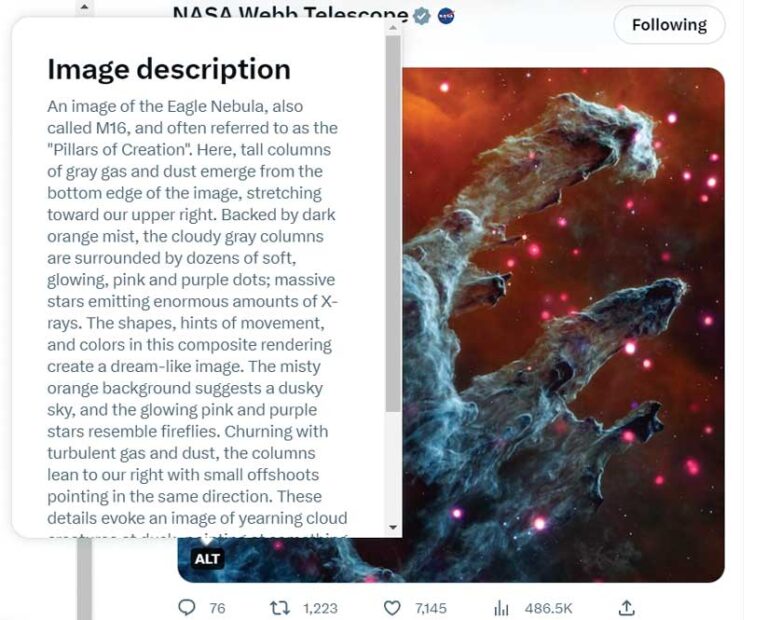
The first possibility is simply to break that 125-character barrier. One example of this is the fantastic alt text for NASA’s Webb telescope photos posted on Twitter that made headlines over the summer of 2022. The positive reaction these descriptions received confirmed that many audience members appreciate an equitable experience, even if it’s a little wordier.
Another option is to explain your media more within the story’s running text. However, it might not be possible to efficiently provide ample information in the copy to say what a graphic or map communicates. Sometimes adding extra text can be the antithesis of why you created a map or graphic in the first place—to illustrate, simplify, or efficiently explain a concept.
For complex maps and graphics, one more possible solution is to narrate those parts of your story with audio files that explain your maps and ensure that your story will be understood by your entire audience.
Some organizations encourage providing a spreadsheet of data along with a map when it’s practical for the map context (e.g., locations of medical facility addresses). However, a spreadsheet is not always an ideal solution, especially when working with large datasets.
An Animated Example
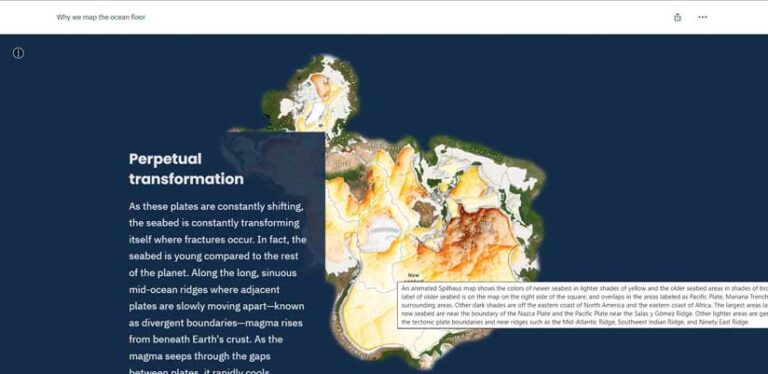
In “Why we map the ocean floor” , ArcGIS StoryMaps team cartographer Cooper Thomas created several animated maps—some of the most visually striking maps I’ve ever seen.
These maps—as complex as they are beautiful—use the Spilhaus projection. This projection shows the ocean as one continuous body of water with the land areas occupying the edges of the map. It was the perfect projection for the story content. The Spilhaus projection is atypical for even the biggest map fan. It comes across as abstract when compared with more familiar projections such as a Mercator or Winkel Tripel projection.
After the story’s introduction, the first Spilhaus map acts as a base for several maps that follow. When adding new layers of human-made infrastructure, the details made the animations even more complex. Content developers on the ArcGIS StoryMaps team had to pause and ask, How do we create an equitable experience for those who are unable to actually see these maps?
The solution was to establish patterns in the structure of the alt text so the audience would know what to expect and could more easily process the description.
The steps in the process used to establish these patterns were
- Plan the alt text by building on the map legend information, such as values or color, and the order that they are shown in the legend to help structure the descriptions.
- Start the description by stating an overview sentence of the map’s purpose.
- Establish the pattern for describing the map, such as a grid system or a clockwise pattern and include other major points of reference to create context and reduce the length of descriptions.
- Share a description of the content noting if patterns exist, but not necessarily stating a conclusion.
The first map in the Spilhaus series—without the other layers—is used as a base. It includes major physical features that are used as points of reference for other layers. For the alt text, we started by explaining that the map was a world map and that it was a nonstandard map projection. We continued by describing the shape and appearance of the projection, and then used a grid system to describe the map’s features, going counterclockwise from the top. We also noted in the alt text that the following layers were based on the initial description, and we would not include the full description of the basemap after that.
After establishing this pattern in the first map, the team decided to describe only the patterns and pertinent information for the following layers. This allowed alt text descriptions that were shorter for ensuing layers in the series.
Establishing a predictable pattern, much like other broader storytelling strategies, helps create context and a setting that helps your audience understand and process the information more efficiently. Similar alt text strategies have been used for other stories such as “Justice deferred” (https://tinyurl.com/437b9p38) and “(Farm) Animal Planet” (https://tinyurl.com/4t4tf8mh). All stories in ArcGIS StoryMaps produced by the editorial team include alt text.
What Do You Think?
The ArcGIS StoryMaps team encourages all content creators and storytellers to share their thoughts on strategies for making complex graphics and maps accessible to members of the GIS community who use assistive devices. Share your solutions or suggestions for accessible story creation in ArcGIS StoryMaps Community.
The team members who devised these strategies for alt text want to hear your feature suggestions for the ArcGIS StoryMaps builder. You can add your feedback to the form available in the ArcGIS StoryMaps builder under the help menu.
About the author