The Esri User Conference (Esri UC) has always been all about the work of organizations that use GIS to improve the world, whether it is providing residents with better government services, more effectively responding to disasters, or preserving the environment.
Celebrating and sharing the outstanding work of users was a central part of the Plenary Session held on July 10 at the 2023 conference. Presentations of special awards were made to those organizations receiving the Making a Difference Award, the Enterprise GIS Award, and the President’s Award.
This year, there were two recipients of the two Making a Difference Awards, and both helped people see the world more clearly and completely. The Netherlands’ Cadastre, Land Registry and Mapping Agency—known as Kadaster—was honored for its work producing tactile maps that let people with impaired vision gain a greater understanding of the world around them. Kadaster was aided in this work by Esri Nederland, local accessibility organizations, and academics from around the world.
The second Making a Difference Award was presented to Dr. Paulette Brown-Hinds, founder of Voice Media Ventures and Mapping Black California, for her leadership in advancing the use of mapping, visualization, and spatial analysis to work collaboratively to address systemic inequities affecting Black communities in California. She leads the Mapping Black California project, and her team developed the Racism as Public Health Crisis dashboard.
Pacific Gas and Electric Company (PG&E) was recognized with the Enterprise GIS Award for its transformational implementation of GIS across one of the largest combined natural gas and electric energy companies in the United States. PG&E has an ongoing commitment to evolving its GIS to meet both business and customer needs and ensure the safety of its operations.

The NYPD—Information Technology Bureau (NYPD-ITB) received the President’s Award for implementing an enterprise GIS that has digitally transformed its operations and streamlined and modernized its workflows to better serve the city’s 7.9 million residents and 50 million annual visitors. NYPD-ITB’s GIS includes systems of engagement and insight as well as systems of record and analysis.
Organizations whose outstanding work was recognized this year with a Special Achievement in GIS (SAG) Award were acknowledged during the Plenary Session. At a separate ceremony during Esri UC, 230 organizations from around the world—representing just 1/120 of a percent of Esri users—received this award. Following the awards ceremony, the exemplary work of special guest organizations was shared in a series of presentations. Summaries of these presentations are listed below.
3D Mapping Builds Resilience and Engagement
The GIS team for the City of Cambridge, Massachusetts, has been a leader in using 3D GIS for more than a decade to manage this densely populated, heavily built-out city. Cambridge GIS manager Jeff Amero; Cambridge GIS web technology specialist Katie Grillo; and William (Bill) P. Witts Jr., manager, facility information systems at the Massachusetts Institute of Technology (MIT), shared their work, which leverages reality mapping, digital submissions, and advanced spatial analytics.
The city uses GIS tools to build engagement with the community and manage the city’s urban forest of 30,000 trees as part of its climate resiliency efforts. The city has collaborated with Harvard University and MIT to build the city’s 3D system of record and use it for spatial analysis. Buildings cover about 28 percent of Cambridge, so the GIS team uses 3D to analyze roof types and locations to find the optimum buildings to convert to cool roofs. MIT uses 3D modeling of the area surrounding the campus to provide context for its campus projects.
Intelligently Building the EV Charging Infrastructure
Brandy Mathie, director of site acquisition and portfolio management, and Julie Wagner, location strategy manager, described the holistic approach Electrify America uses to build out its network of ultrafast electric vehicle (EV) chargers. GIS plays a significant role in the selection of sites for the company’s more than 3,500 EV chargers, which are backed by 100 percent renewable energy. Electrify America is spending $2 billion to build its EV charging infrastructure and educate people so they can confidently adopt an EV lifestyle, which will actively contribute to carbon emissions reduction.
With the largest open, ultra-fast charging network in the United States, Electrify America considers economic, social, and environmental factors to find the best location for its charging stations. Site Selection Explorer, an application the company uses to site chargers, runs what-if scenarios that identify alternative locations in an area based on strategic, financial, and real estate factors and supports collaboration with power providers.
Shaping Cities and Minds with Urban Design
Creating resilient cities requires learning from the past and adapting to the future. Bruno Moser, the head of urban design at the global multidisciplinary design and architecture studio Foster + Partners (F+P), described how the firm is using GIS to design an entirely new 24-square-mile city in Kuwait. South Sabah Al-Ahmad will have 280,000 residents, feature an extensive open space network, and have a multilayered public transport system that promotes sustainability. “At Foster’s, we build geography right into our design process. We need to understand the patterns and relationships, the forces that shape our cities, so that we can take informed decisions when we design new projects,” said Moser.
Mateo Neira, an associate data scientist at F+P, demonstrated how ArcGIS CityEngine was used to optimize street network connectivity, reduce the total amount of road space by 10 percent, and provide more public space for residents. This design helps create a more livable and sustainable city that considers the region’s climate and responds to the unique challenges of the site. This design was exported and enhanced with the Unreal Engine tool to produce an immersive, photorealistic, and animated model of the city.

Proactive Threat Management
With more than 120,000 employees, in more than 350 facilities, located in more than 40 countries, Lockheed Martin has a
pressing “duty of care,” according to Amanda Haas, the company’s security systems senior manager. To meet this responsibility, the American aerospace, arms, defense, information security, and technology corporation developed its Global Emergency Operations Center (GEOC) as a 24/7/365 solution to monitor threats. Hundreds of thousands of events each year can threaten Lockheed Martin’s employees and assets. Using ArcGIS, watch officers monitor global incidents, detect threats, analyze the impacts of incidents and threats, and prioritize immediate action if required. GEOC lets Lockheed Martin ensure the safety and security of its employees anywhere, anytime. Wellness checks are quickly conducted on employees who may be affected, even outside of work hours. GEOC lets the company stay ahead of these events and ensure the safety of its employees.
The Explorer Mindset and the Geographic Approach
Using the geographic approach is central to driving a change in the world, according to Dr. Deborah R. Grayson, chief education officer at the National Geographic Society. That is why the National Geographic Society and Esri developed the next iteration of National Geographic MapMaker to promote geographic inquiry, exploration, and storytelling. National Geographic Society collaborates with Esri on several educational initiatives that inspire learners to think like an explorer so they can advance real-world change.
Transforming and Expanding Operations Safely
The evolution of geospatial, mission-critical enterprise systems has transformed how PG&E operates and helps meet its commitment that “everyone and everything is always safe.” PG&E, one of the oldest and largest utilities in the United States, provides electric and gas service to 16 million people across 70,000 square miles in California. Since completing the transition from paper-based processes to fully digital spatial-based workflows about a decade ago, PG&E has continued modernizing its systems, workflows, and data processes by taking advantage of the company’s foundational GIS investments and deploying an enterprise GIS.
The company uses GIS for mobile applications, visualizations, analytics, and sharing tools that have improved safety, situational awareness, data integrity, access to information, and staff productivity and collaboration. PG&E developed an innovative system of record. This remote sensing data platform provides access to more than 50 million images, point clouds, and videos that can now be viewed in 3D locational context. This has allowed PG&E to increase the efficiency of substation inspections by 150 percent using its Substation Inspection tool. Automated and accurate field data collection in ArcGIS Field Maps helps the gas operations team collect multiple features in a single process and plays a critical role in responding to real-time events. PG&E’s Hazard Awareness and Warning Center (HAWC) web application provides situational awareness by pulling together real-time feeds from weather, live cameras, current outages, and PG&E truck locations to respond to critical events.
PG&E keeps partner agencies informed of power shutoffs through the Public Safety Power Shutoff (PSPS) portal and the public-facing Outage Center that provides outage information to customers. “We are very proud of our work on behalf of the GIS department and everyone at PG&E; we’ll continue to maintain our stand: Everyone and everything is always safe,” said Hamilton Erridge, PG&E principal remote sensing data platform program manager.
New Medical Facility Built with a Sustainable Future in Mind
PCL Construction is pushing the boundaries of traditional construction approaches, elevating efficiency, precision, and accuracy of construction as it works with Providence Health to design and build a new C$1.7 billion, state-of-the-art, two-million square foot medical facility in Vancouver, British Columbia, Canada. PCL uses GIS to deliver this project on time and on budget. Providence Health’s goal is to build a sustainable, 100-year facility. The construction of the new St. Paul’s Hospital uses drones as part of its site mapping and GIS to coordinate construction activities and make data-driven decisions. Forward-thinking requirements and processes for the digital handoff of project design, construction, and commissioning information allow PCL Construction and Providence Health to incorporate requirements for indoor GIS before the floors are built and provide the foundation for a digital twin by including digital project handover requirements at the outset of the project.
Responding to Crises Around the World
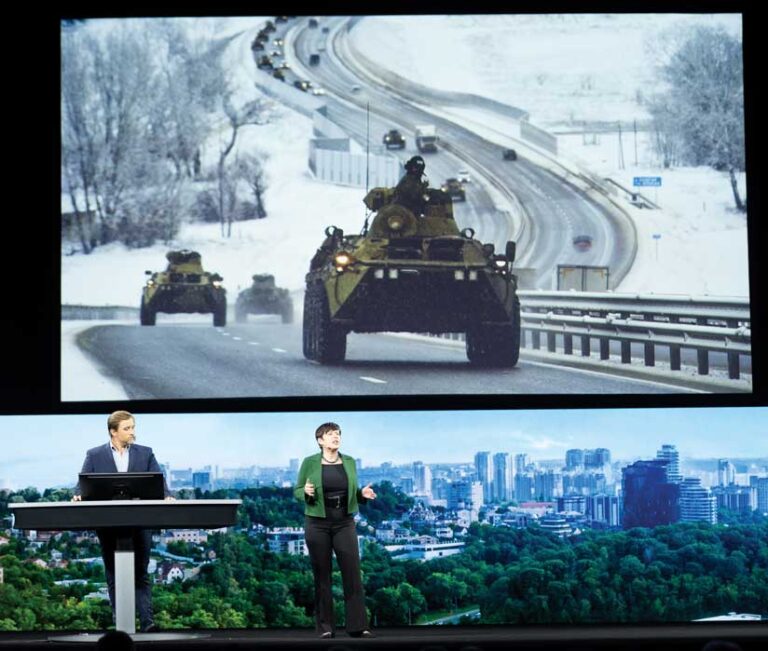
The Conflict Observatory, created by the US Department of State Bureau of Conflict and Stabilization Operations (CSO), uses the latest scientific methodologies and brings together government officials, private industry, and academia to ensure technology works for democracy. As a team of teams, the Conflict Observatory program includes nearly 70 subject matter and technical experts across organizations and research institutions including the Yale Humanitarian Research Lab, the Smithsonian Cultural Rescue Initiative, PlanetScape Ai, Esri Partner Quiet Professionals, and Esri.
These teams document war crimes and other atrocities using commercial satellite imagery and other sources. Begun in the early days of the Russian invasion of Ukraine in 2022, the program leverages satellite imagery, social media, and other commercially and publicly available data collection technologies to document possible atrocities. The Conflict Observatory can be deployed anywhere in the world. In February 2023, the team released a report on the forced relocation of thousands of Ukrainian children to at least 43 sites across Russia, which resulted in the issuance of arrest warrants by the International Criminal Court. The same platform and geospatial data feeds have been expanded to document conflict activities impacting civilians in Sudan and assist ongoing humanitarian operations.
Local Government on the Move
Orange County, California, manages one of the most modern and innovative GIS implementations in the United States. GIS has become a vital component of mapping and data management for the county, which has experienced significant growth in the last 25 years. Orange County uses ArcGIS as a foundation for its parcel fabric, imagery, lidar, and digital infrastructure, which are all built on the county’s accurate survey control. The OC Survey GIS team developed a self-service map submission application using ArcGIS API for JavaScript and Autodesk Platform Services that surveyors can use to complete a digital check of their maps.
This application streamlines the county review process, provides real-time validation, and reduces costs. In addition to robust survey control and parcel fabric, GIS applications manage both outdoor and indoor facilities at John Wayne Airport and provide a wealth of services that support sustainable and resilient workflows across nine departments. (See also an accompanying article in this issue, “Decades of Innovation by Orange County.”)
The More I Click, the More I Learn
Three sixth grade students from Foulks Ranch Elementary School in Elk Grove demonstrated how they are using the National Geographic MapMaker to interactively explore the world around them. Liam Moen, Cadence Calvillo, and Gavin Sutherland used GIS 2D and 3D visualization tools and data from ArcGIS Living Atlas of the World to better understand the demographics of communities and where and when extreme weather events, such as hurricanes and cyclones, have occurred.

The Source of Life: Exploring the Okavango Delta’s Watersheds
Dr. Steve Boyes, one of the 2023 Esri UC keynote speakers, has dedicated his life to preserving Africa’s wilderness areas and the species that depend on them. The South African native, who is a conservationist, National Geographic Explorer, and TED Senior Fellow, has been founding and running conservation organizations for more than a decade. In 2015, Boyes launched what has become the National Geographic Okavango Wilderness Project to help establish community-based systems to protect this area based on detailed, repeatable ecological surveys and long-term environmental monitoring systems.
To help local governments preserve long-term resilience to climate change impacts, Boyes and his research team are working on establishing detailed early 21st century hydrologic and ecological baselines. The current work protecting the Angolan Highlands Water Tower (AHWT) was the subject of Boyes’s keynote address. AHWT is a highland area that stores large quantities of freshwater that flows downhill and is the water source for the world’s largest transboundary conservation area and two-thirds of Africa’s remaining elephants. Boyes’s team has undertaken arduous large-scale ground truth surveys and expeditions, and in the process, they have discovered new species; taken environmental DNA (eDNA) samples; deployed permanent hydrologic and meteorologic monitoring stations; monitored wildlife populations using camera traps; and mapped birds, wildlife, and human activity observed along the team’s multimonth river transects.
The team employs ArcGIS Survey123 for expert data capture and shares its findings via EarthViews, a custom GIS solution that generates 360-degree virtual maps. The goal of the Okavango Wilderness Project is to demonstrate the interconnectedness of the entire region through integrating data collected via sensor and field apps and visualizing that data using GIS. Project research has identified more than 143 new species and gained a better understanding of the region’s physical geography. To create a sustainable future for the region requires understanding the unique culture of its people. Boyes and his team are working with area communities to rebuild a sense of pride and ownership of the landscape that has been made dangerous by conflict.