The topic of zoning reform has gained momentum exponentially over the last few years. As more communities find that their ability to deal with the housing shortage is hindered (or all but blocked) by their existing policies and dated zoning ordinances, demands from the public, developers, and elected and appointed officials to change this situation continue to grow.
Reforming a zoning ordinance is neither quick nor inexpensive. To address this, US Department of Housing and Urban Development (HUD) has received $85 million in funding for the Yes In My Backyard competitive grant program as part of the $1.7 trillion spending bill approved by Congress in 2022. This program will likely begin by April of this year.
At its core, zoning reform is about modernizing an organization’s development strategy (particularly housing) to meet the modern needs of its residents and to correct previous failed policies. Many people want more choices than half-acre single-family lots or very high-density apartment complexes. A lack of housing supply only serves to hinder the availability of affordable housing, which in turn limits the economic mobility of its residents, particularly those of disadvantaged communities and young professionals.
There will be inherent pushback from this because…well, it’s change. That’s not a political statement. People on the left and the right (and in the middle) are resistant to change. But this isn’t a political issue. It’s about enabling a community to create the housing and other developments its residents want and need that a legacy ordinance simply cannot provide.
Yes, some residents will still want a traditional single family residence (SFR) home. Some will be happy living in loft apartments downtown. I do not think it’s wise to outlaw either of those types of development for a myriad of reasons I won’t go into here. Zoning reform can open the door to more diverse types of housing, such as cottage courts, townhomes, duplexes, and flex houses.
The American Planning Association (APA) recently released its Equity in Zoning Policy Guide, which helps planners and government leaders identify the ways zoning regulations can be changed to meet the needs of historically disadvantaged and vulnerable communities. I was naturally drawn to the section of this guide that deals specifically with the zoning map.
I’ve spoken many times in this space about the necessity of taking a geographic approach to planning, and creating equity in zoning policy is an example of this. Let’s look at how GIS is a mission-critical tool for the zoning map policies recommended in the Zoning Map Policy sections of the APA guide.
Zoning Map Policy 1 states, “Those recommending neighborhood-wide or area-wide changes to the zoning map should reflect the demographic composition of the community and should include representatives of historically disadvantaged and vulnerable communities.” This is the first step in applying the geographic approach to planning—understanding neighborhood characteristics.
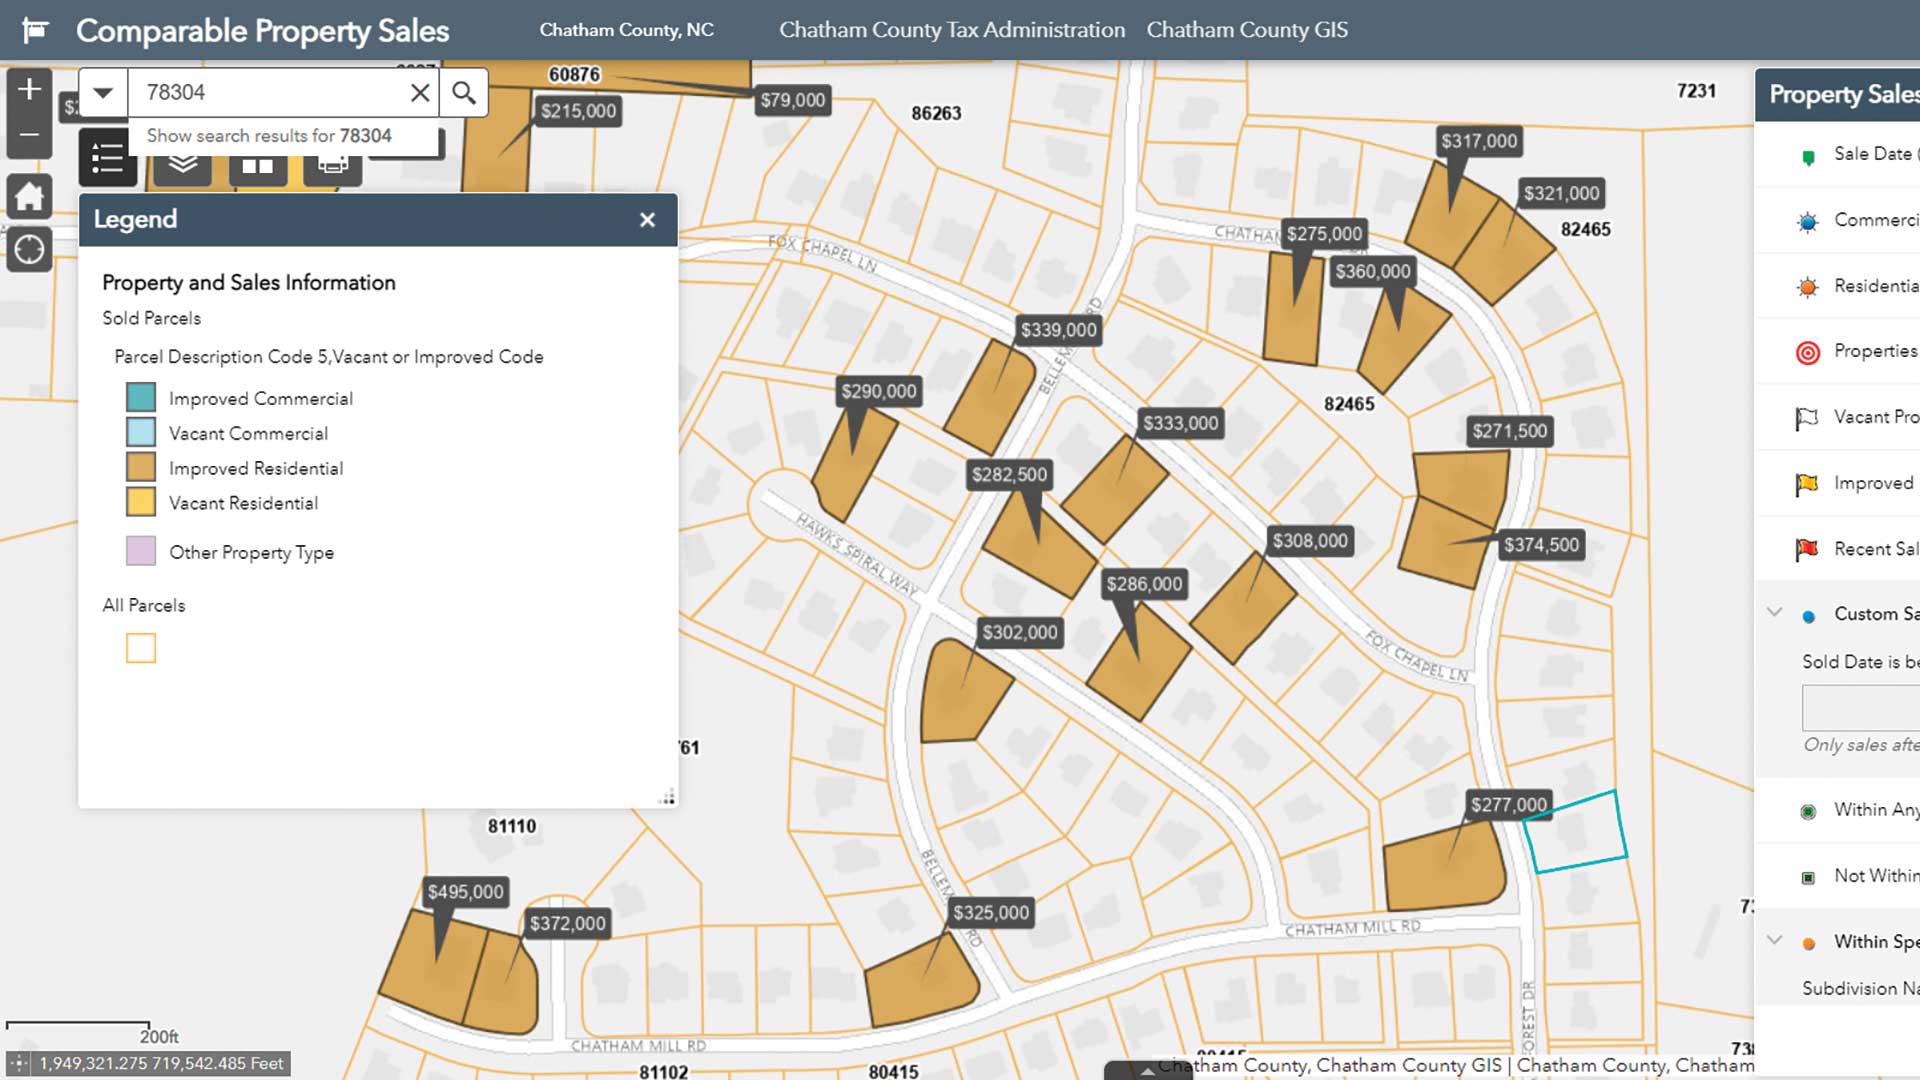
Because understanding precedes action, planners must have access to updated demographic, socioeconomic, and business data before they can start making changes to zoning policy. Within the ArcGIS system, this is done through ArcGIS Community Analyst or ArcGIS Business Analyst Web App. These web-based applications provide access to more than 2,000 variables to help optimize zoning and resource allocation decisions, giving planners a place to start implementing a data-driven approach to zoning policy.
Zoning Map Policies 2 and 3 in the APA guide focus on the necessity of civic inclusion. Simply put, zoning policy changes do not exist in a vacuum and cannot be successfully amended behind closed doors. They require input from all residents, regardless of their ability to be at an in-person meeting. Today’s public requires multiple ways to engage with government. In GIS, this is done through ArcGIS Hub, which provides easy access to planning initiatives.
This means that planners are not only communicating proposed changes but getting regular feedback from residents in a way they can effectively map and analyze. Civic inclusion is a must if a planning department wants to create a genuine partnership between itself and the residents it serves. Zoning Map Policies 4 through 9 deal with addressing redlining, health risks, and access to services in disadvantaged neighborhoods. Again, GIS provides the level of analysis and understanding that is required for a data-driven and geographic approach.
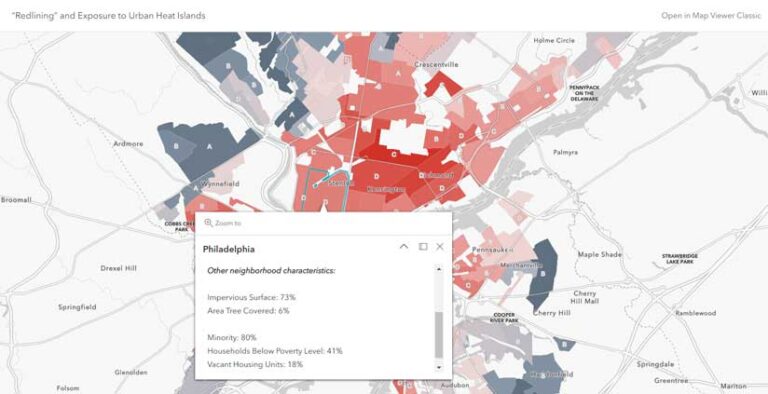
Esri Maps for Public Policy is a free resource available to planners and government leaders to address these issues using a geographic approach. This site provides curated content that can be viewed separately or added to an existing zoning map. Planners can view maps showing historical redlining policies, exposure to urban heat islands, Justice40 tracts, air quality, access to broadband, and data on many other issues.
In addition, the Social Equity Analysis solution can be used to understand community characteristics, analyze community conditions and actions, and generate an equity analysis index. Like other ArcGIS Solutions, it comes with an ArcGIS Online subscription and is fully supported.
Zoning Map Policies 10 and 11 deal with revising maps to remove barriers to equity. GIS provides the tools for conducting scenario planning to identify and remove those barriers. Specifically, ArcGIS Urban allows planners to play out different zoning reforms and measure the impacts of these changes. These scenarios could include:
- How would increasing housing density improve access to housing and consequently, improve affordability?
- What impact would reducing minimum lot sizes in a neighborhood make?
- Where could we focus allowing accessory dwelling units (ADUs) and what would that do to the housing supply?
- What will the impact be on housing, jobs, tax revenue, and overall economic mobility if we altered zones to accommodate transit-oriented development?
- What if we eliminate parking requirements for certain types of zoning?
GIS can answer all these questions in minutes or hours instead of weeks or months and do so in a more cost-effective way. This geographic approach to planning is a proven process that can provide the framework for your organization’s zoning reform efforts. If you have questions, please feel free to reach out to your Esri account team, email at planningteam@esri.com, or visit esri.com/planning.