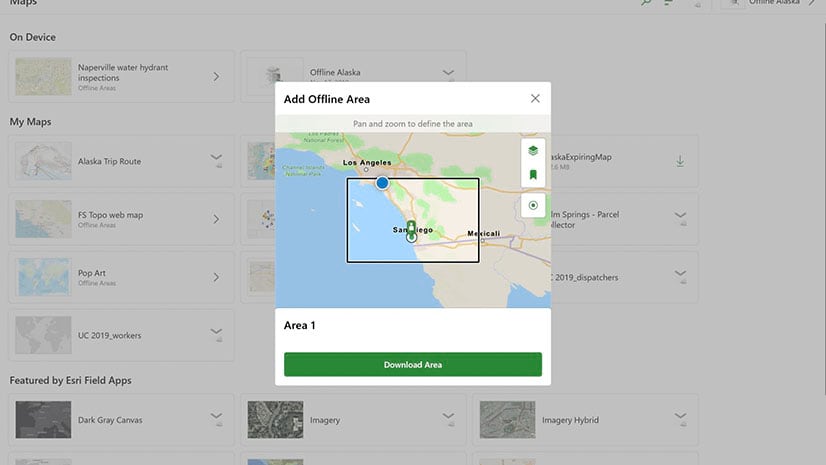
Take Web Maps Offline in Explorer for ArcGIS
Carry digital maps anywhere by taking your web maps offline in Explorer for ArcGIS on Android, iOS, or Windows 10 devices.
Carry digital maps anywhere by taking your web maps offline in Explorer for ArcGIS on Android, iOS, or Windows 10 devices.
Learn to use the erase geoprocessing tool in ArcGIS Pro and data from ArcGIS Living Atlas of the World to make a map of your area of interest.
Robert D. Sharp, director of the NGA, speaks about his agency's roles, goals, and challenges with Esri' president Jack Dangermond.
ArcGIS Data Appliance 7.1 includes Esri Vector Basemaps plus the preloaded imagery, basemaps, and reference layers, all behind your firewall.
Esri technology evangelist Bern Szukalski shows you how to build your first web experience with ArcGIS Experience Builder.
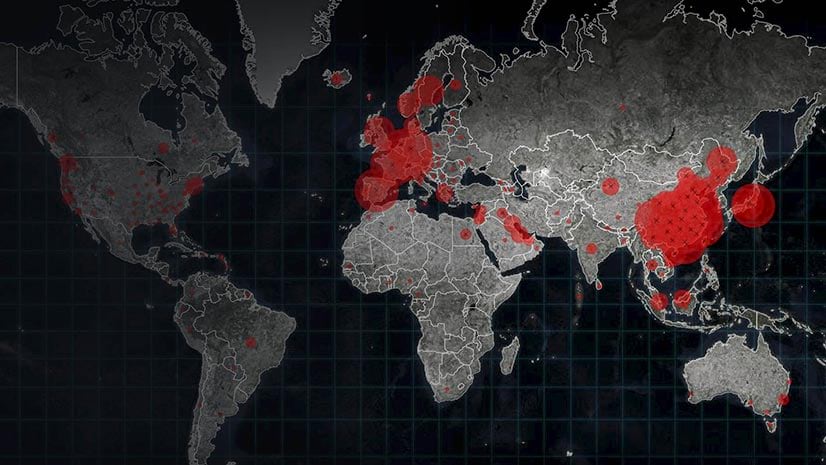
Esri cartographer Kenneth Field has some cartographic advice for people authoring maps that show the spread of COVID-19,
GIS departments throughout the United States can provide their organization valuable information about the spread of COVID-19 as cases rise.
Esri cartographer Mark Harrower showcases interesting examples of animated maps and lists what questions to ask yourself before you make one.
Geospatial Insurance Consortium captured imagery after a hurricane and processed and converted the images into usable maps using Esri technology.
Lee Bock from Esri used Esri Leaflet to create an interactive map of where the yummy ingredients for his salad came from.
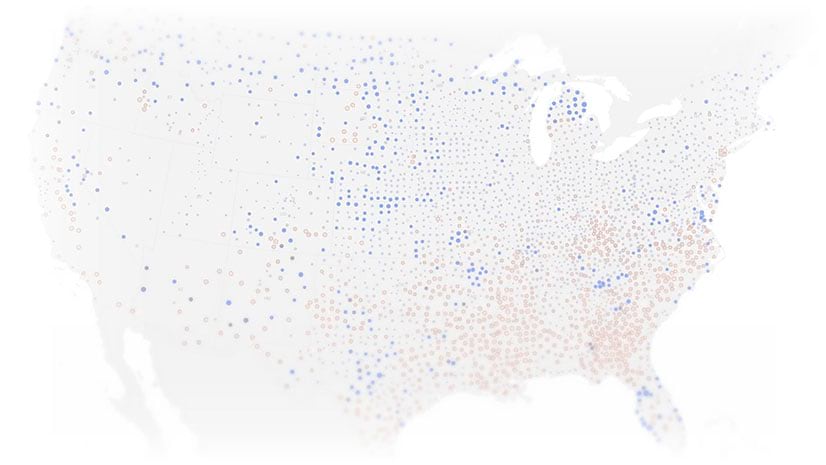
Esri cartographer John Nelson walks through how to use ArcGIS Pro to map the population in the United States who are vulnerable to COVID-19.
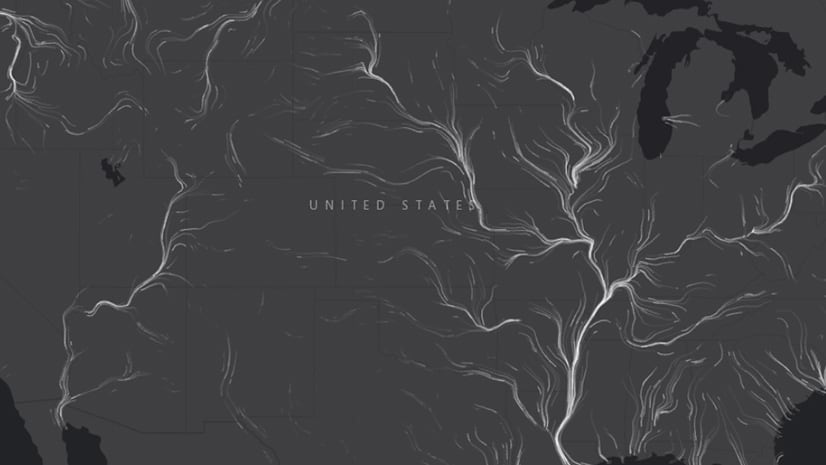
In this short video, cartographer John Nelson from Esri demonstrates how to add charming vintage coastal ripple lines to your ArcGIS Pro map.