A Land of Equity
Equity in land records is crucial for accurate land assessments. Learn how GIS technology helps advance equity in this industry.
Equity in land records is crucial for accurate land assessments. Learn how GIS technology helps advance equity in this industry.
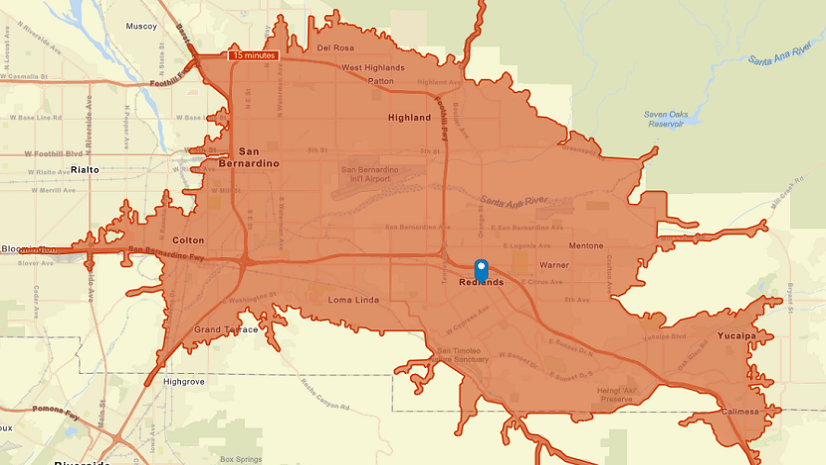
In this story created with ArcGIS StoryMaps, learn how the Chamber of Commerce in Redlands, California, used GIS to modernize its development.
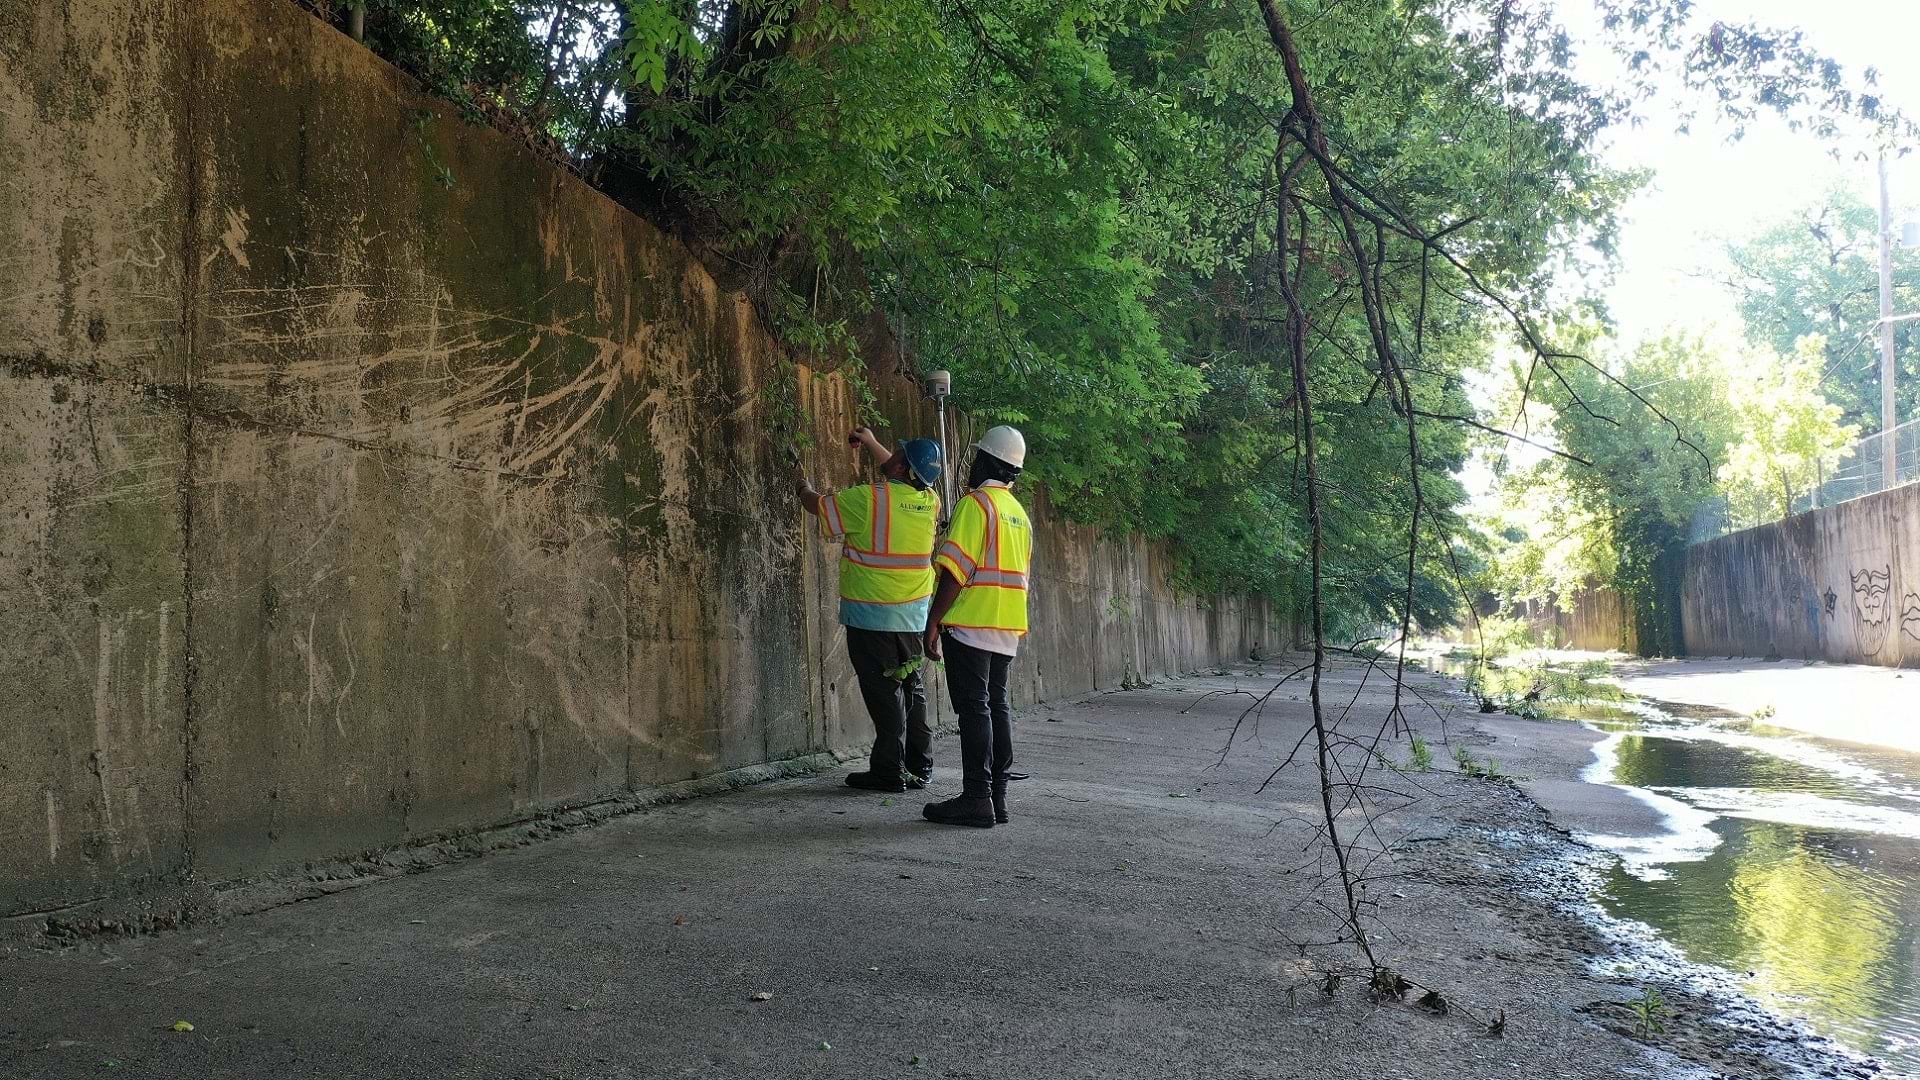
In the City of Memphis, GIS data is critical to the maintenance of vital infrastructure that prevents flooding and keeps the city flowing.
Sophia Garcia, Equity and Civic Nonprofits Industry Lead at Esri, discusses how mapping and technology give social equity work momentum.
Jamal Watkins from the NAACP discusses the role of mapping technology in ending policies that create racial inequity.
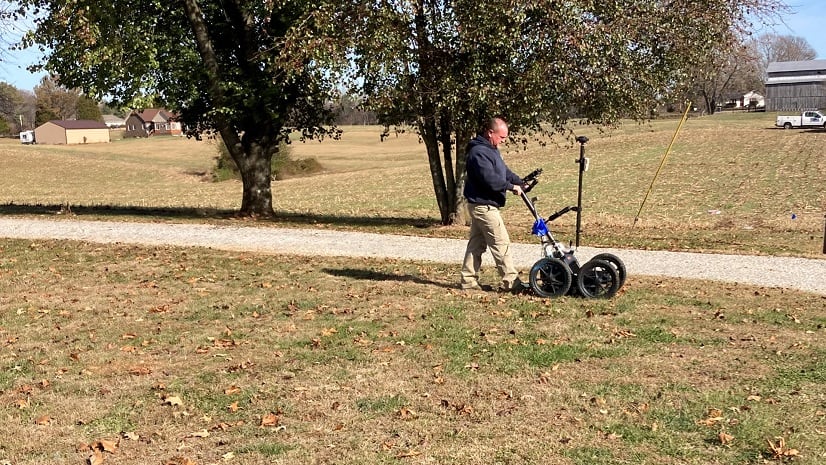
Learn how Warren Water implemented GIS, accurately mapped system assets, and improved efficiency with digital workflows.
Learn how the city of Newport News, Virginia, uses GIS resources to build public facing applications to engage citizens in new ways.
Water management in Montana has a new look—a publicly accessible web app that provides detailed streamflow data with ArcGIS technology.
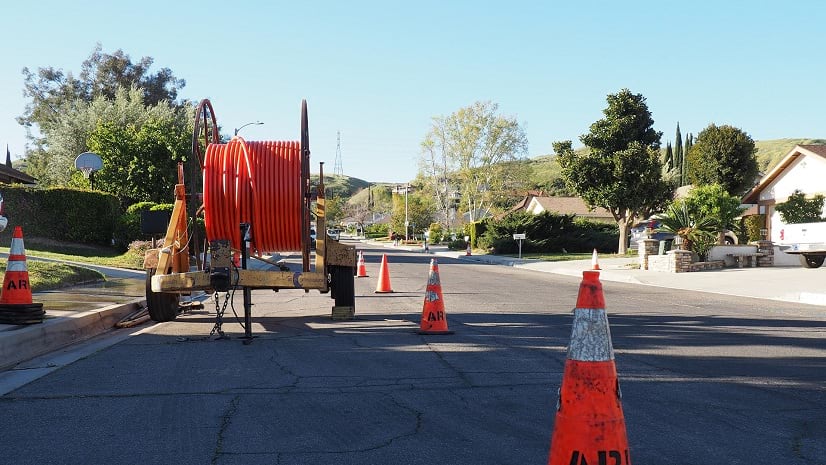
Discover the four repeatable patterns governments are following to address broadband expansion and close the digital divide with GIS.
With ArcGIS Hub, the Nevada Department of Transportation has built a new, public-facing website to make its geospatial data accessible for all.
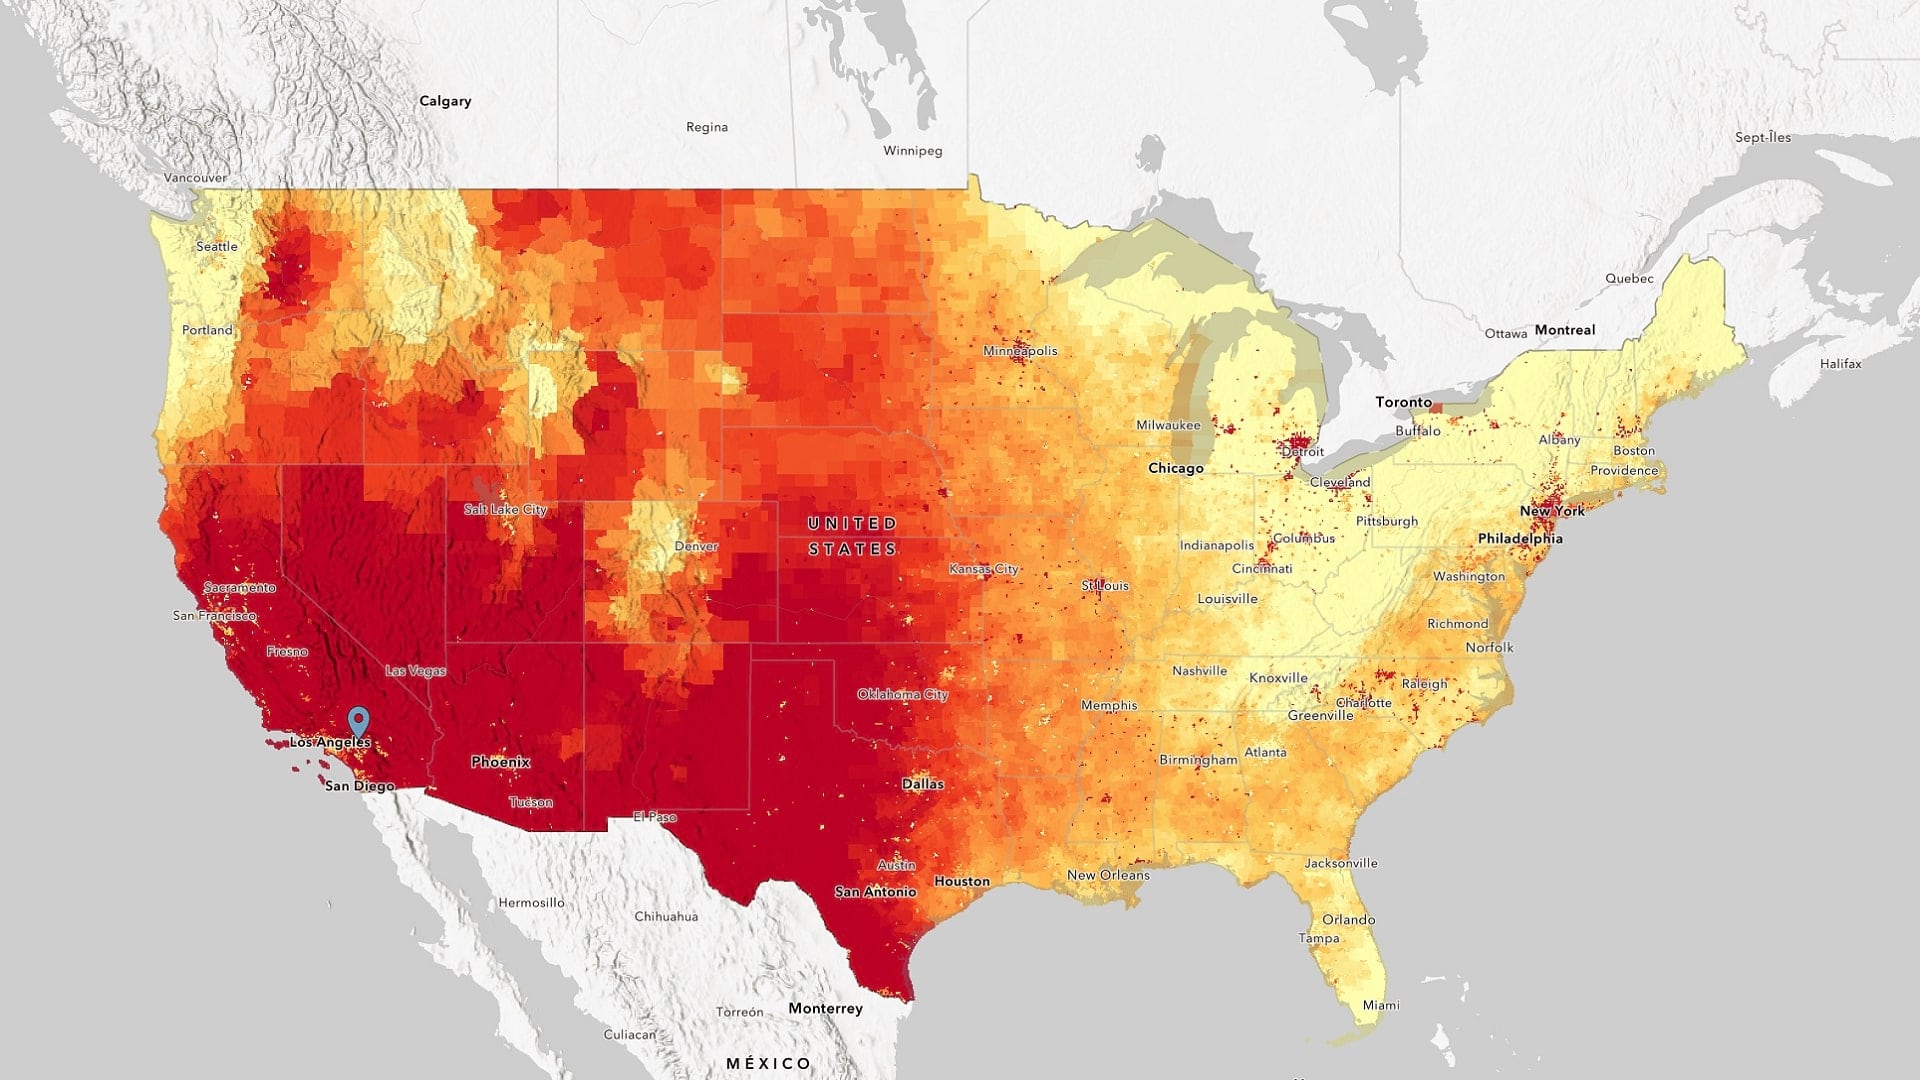
The new Climate Mapping for Resilience and Adaptation portal brings together critical geospatial climate data in one place.
Read about how the State Property Office in North Carolina overhauled their inventory with ArcGIS Experience Builder.