There are new ways to bring your GIS data to life on a map, thanks to an enhancement in the new Map Viewer in ArcGIS Online called feature-specific effects. With just a few clicks, you can emphasize a particular part of your data and visually bring it to the forefront of the map.
The feature-specific effects capability acts like a filter on your data, but instead of removing the other features from the map, it makes them look more subtle or subdued. This is beneficial because while you can still see the other features on the map for context, they no longer distract the reader. With these preconfigured effects, your map audience can quickly and easily see the most important parts of your data.
For example, if you are using a layer that contains all the US census tracts within your state but you are only interested in focusing on the tracts within your county—Los Angeles County in the example below—you can highlight those features using feature-specific effects.
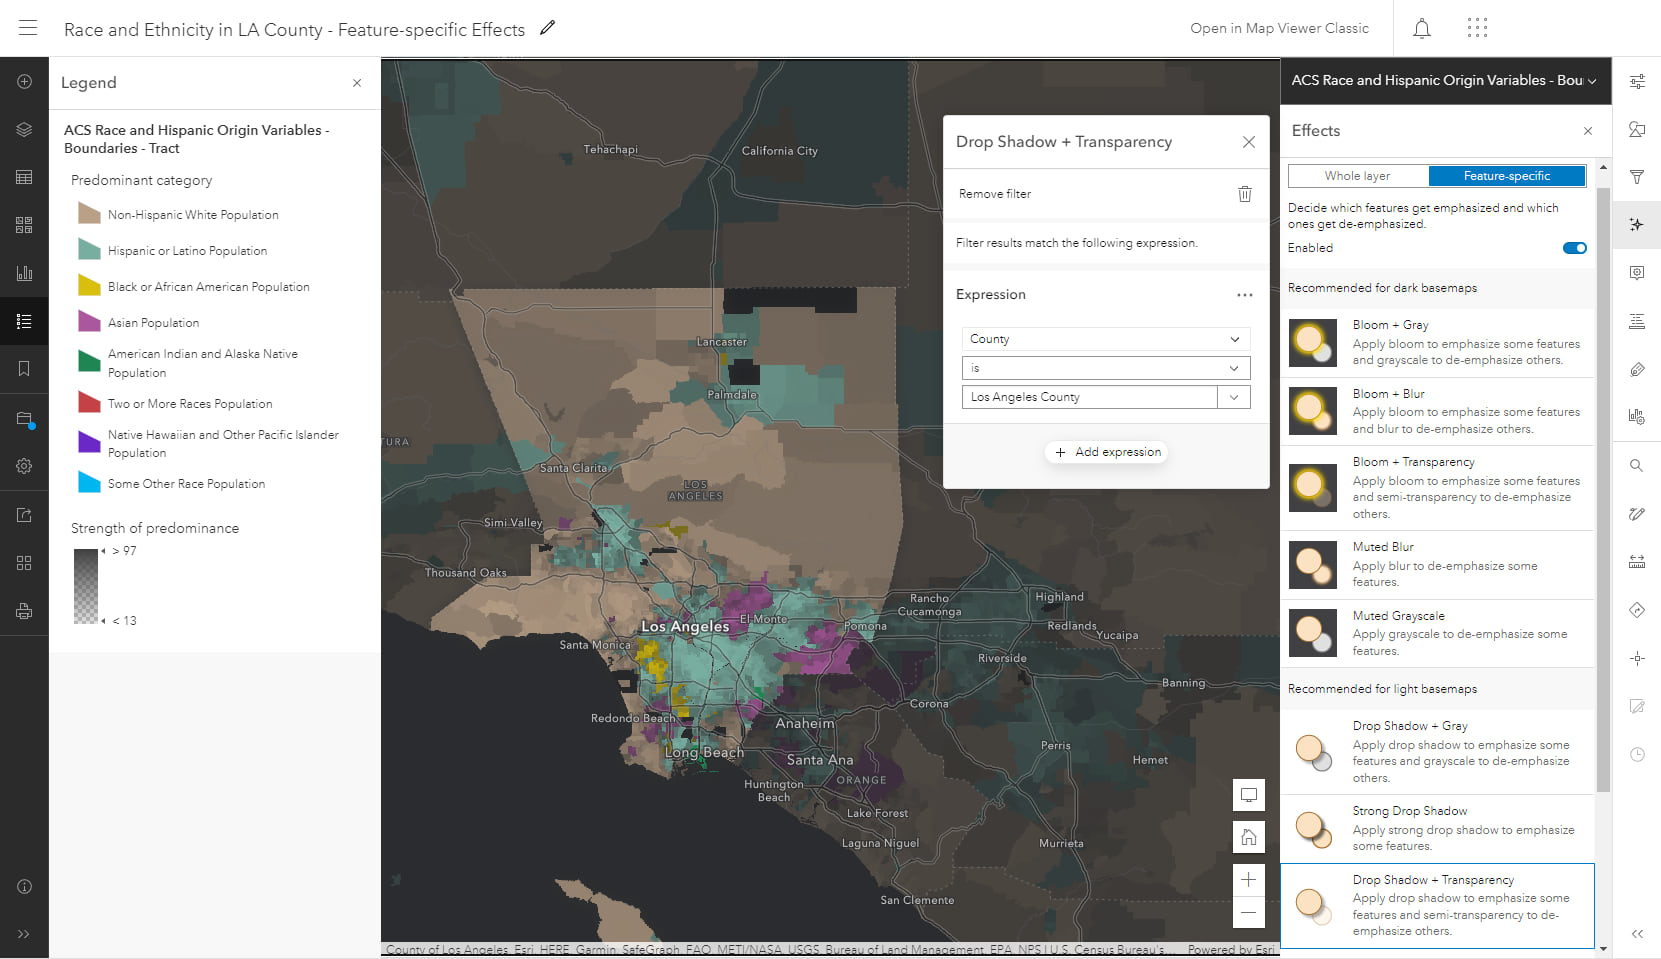
You can still see the areas that surround Los Angeles County, but notice how the map now focuses on the data within the county? Feature-specific effects subdue the features that aren’t important, using techniques like transparency and blurring so that they become less prominent on the map. This is a valuable way to more clearly tell narratives about the features on your map that are important to your map’s purpose and audience.
Strengthen Your Narratives with Feature-Specific Effects
In the tip that follows, you will learn how to use the feature-specific effects capability to emphasize a specific part of a dataset to draw attention to an important pattern.
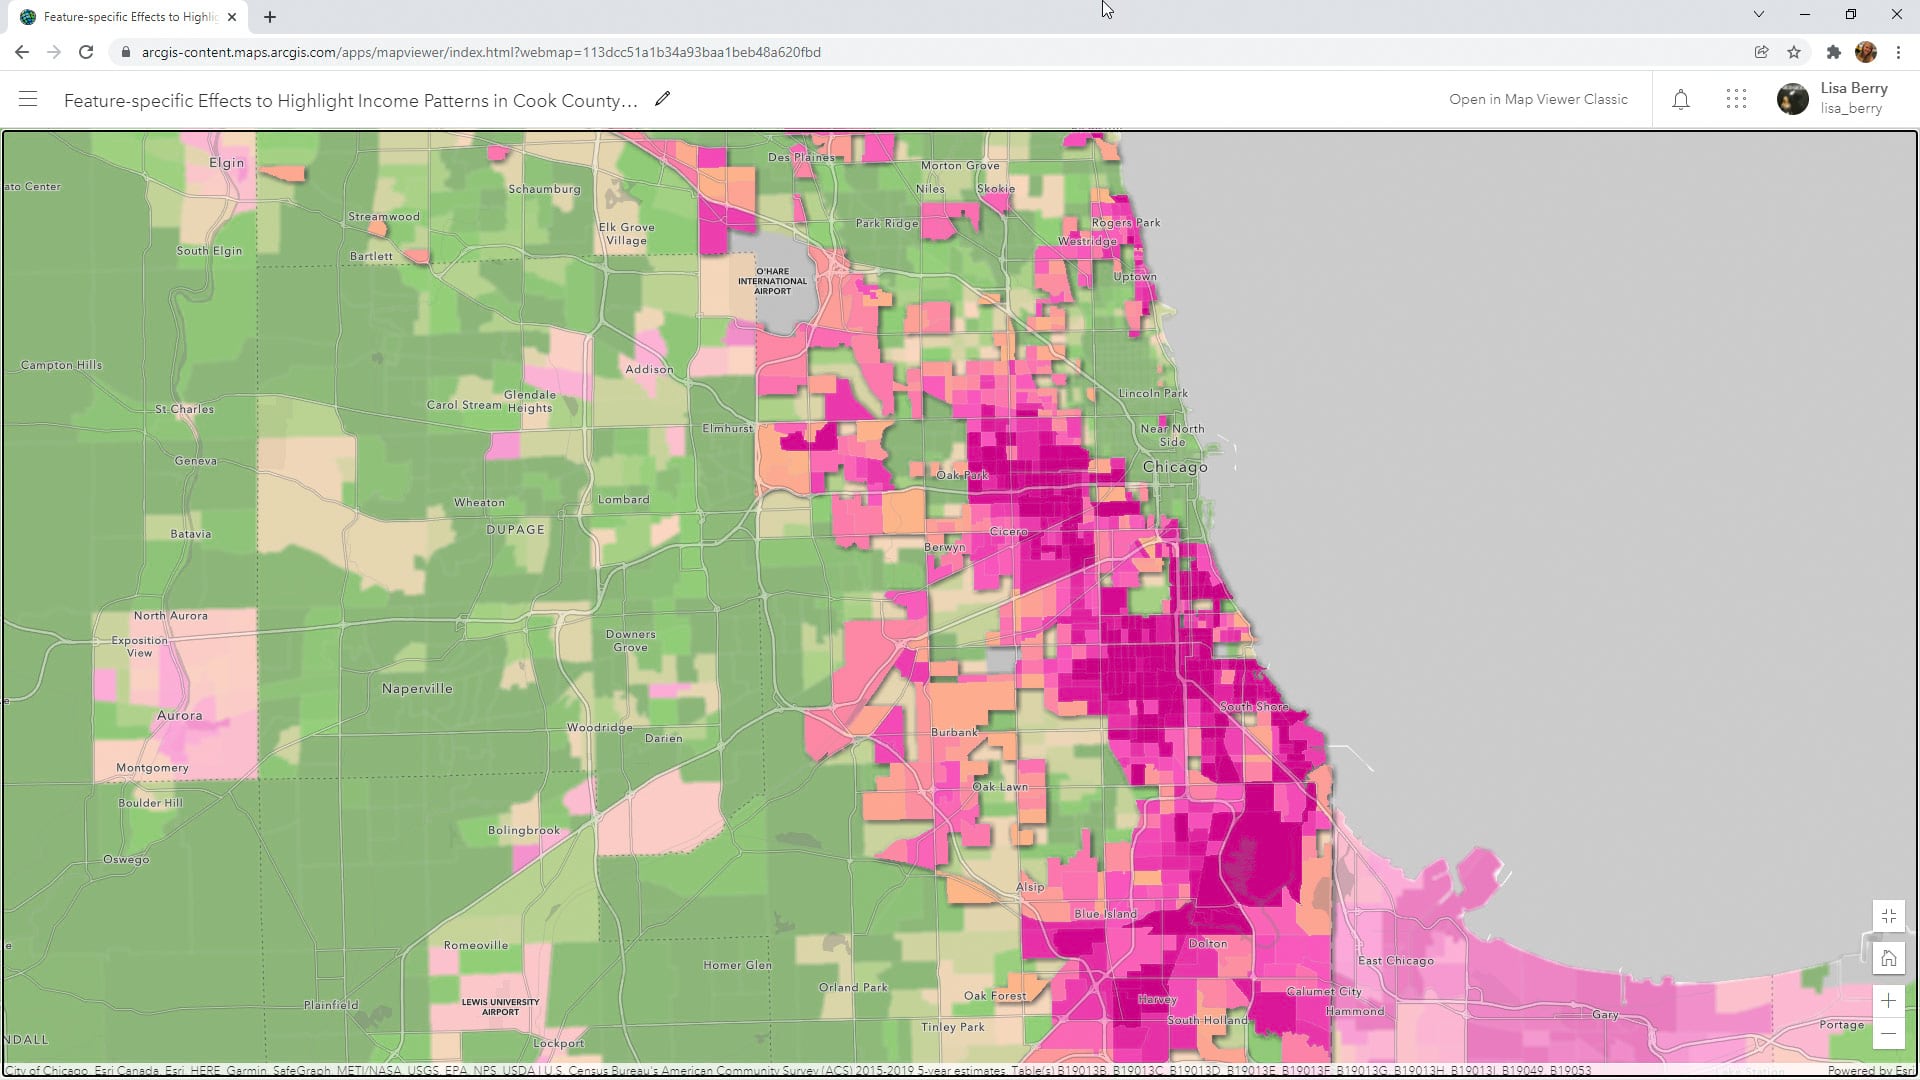
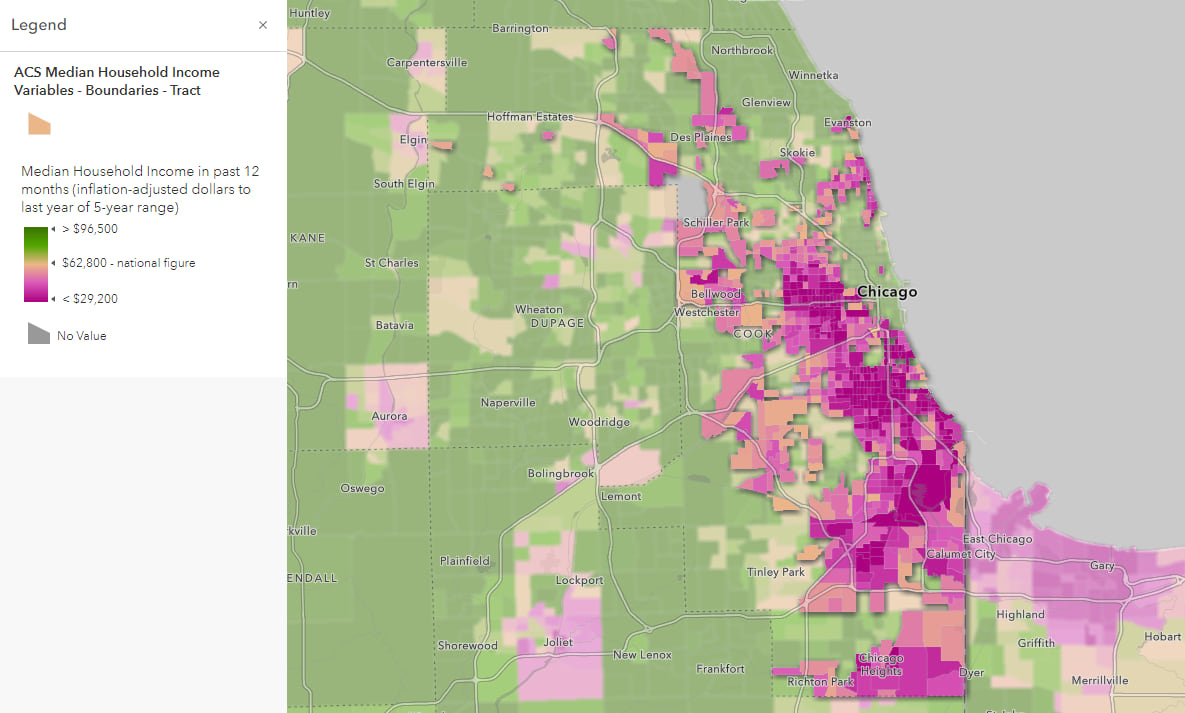
Step 1: Open this web map of the Chicago metropolitan area, which contains a layer from ArcGIS Living Atlas of the World depicting the US Census Bureau’s median household income values for all US census tracts. The census data in this map is sourced by the American Community Survey (ACS), and the map uses the human geography basemap, which is ideal when mapping thematic data such as demographics within tract polygons.
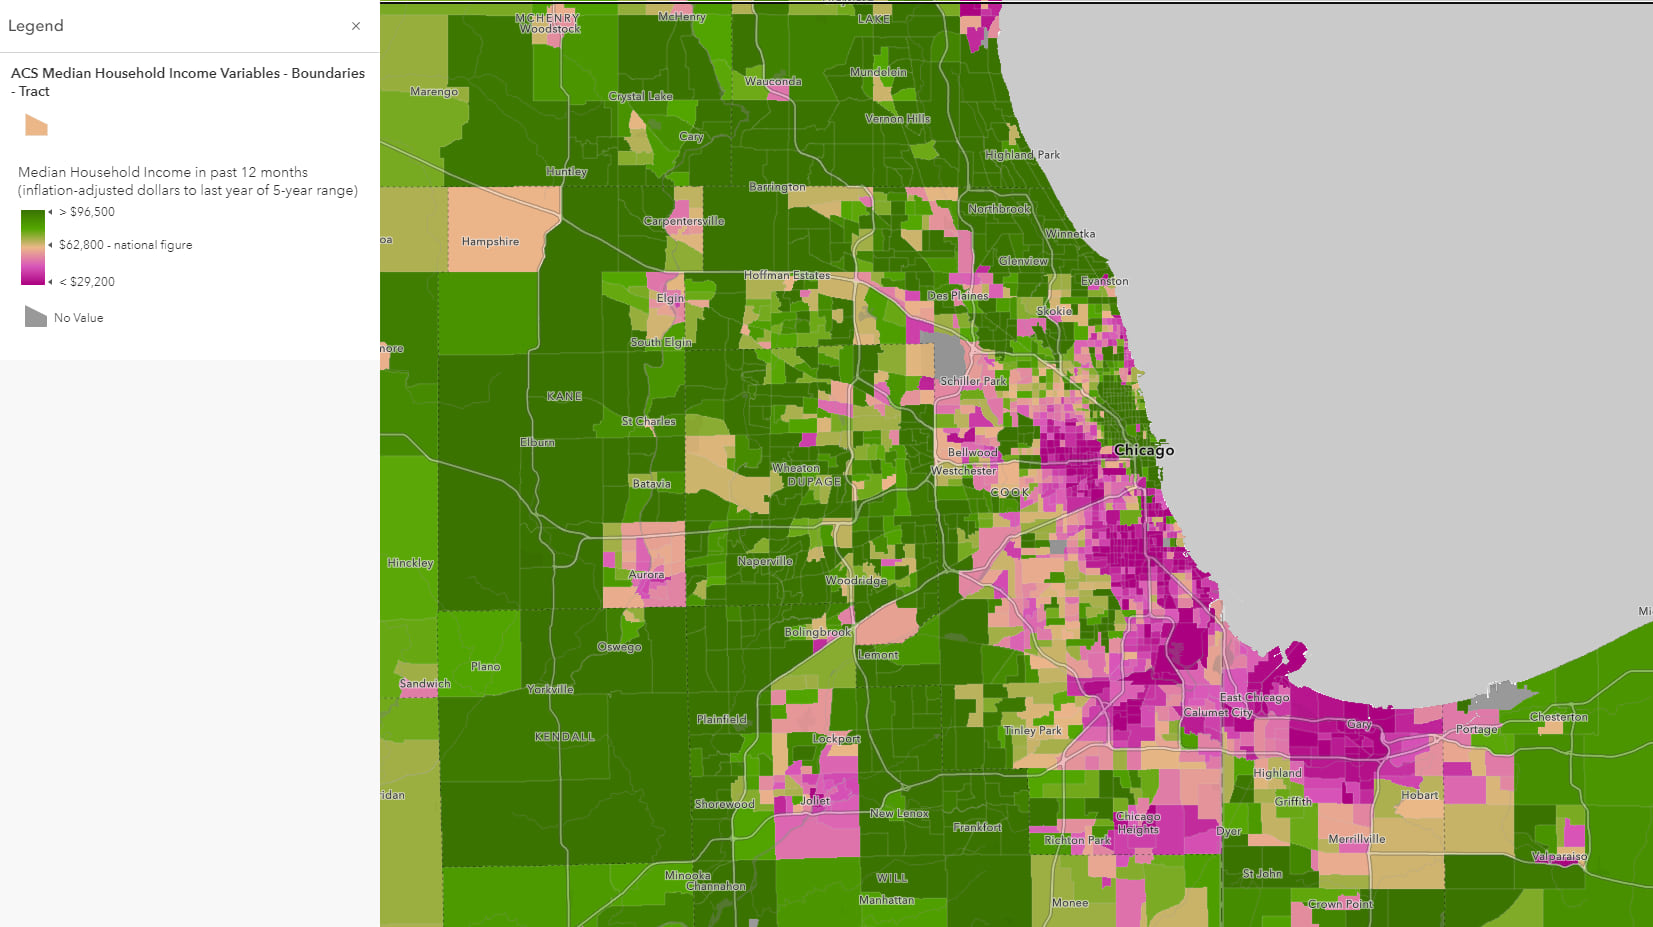
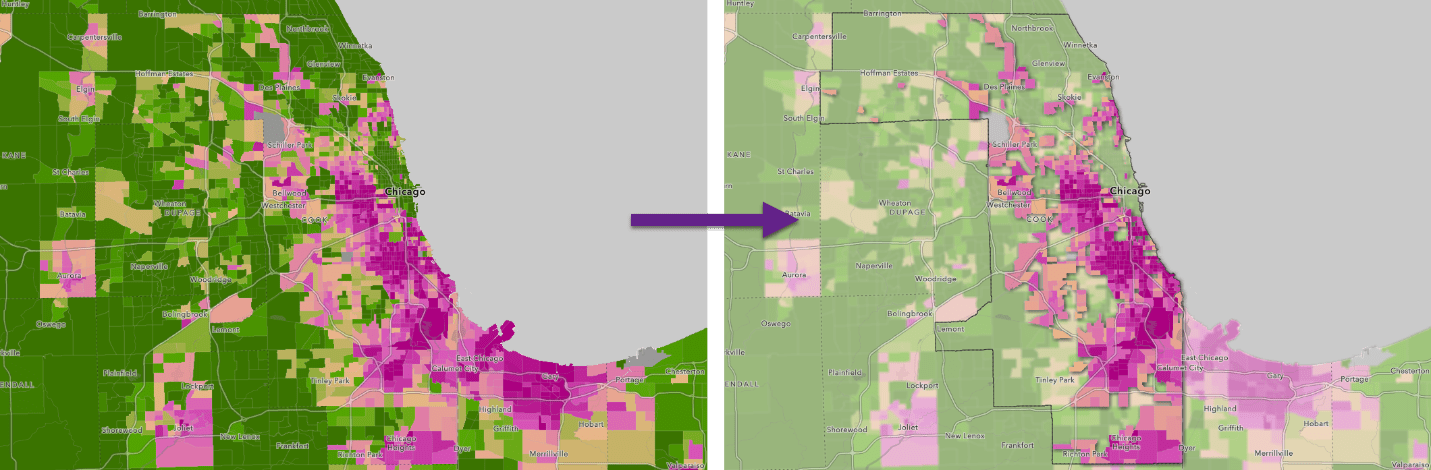
The map shows annual median household income. This map’s color ramp diverges from a yellowish value in the middle to green and pink. Green represents areas with higher-than-average incomes while dark pink represents areas with lower-than-average incomes. The color ramp gives readers the ability to see which areas are above or below the 2019 national median income of $62,800, according to American Community Survey five-year estimates for 2015–2019.
While this map is informative and useful, it’s important to consider your audience when creating any map. In the scenario for this tip, Cook County, Illinois, needs an assessment of income for at-risk populations so that officials can distribute funding within the county. For this scenario, the county officials are the audience, and they need a quick way to understand which areas require funding. You can use feature-specific effects to emphasize the pink (below-average income) areas within the county and make the dark green (high income) values more subtle. This technique will draw the map reader’s eye toward the lowest-income areas so that they will understand the spatial patterns more easily.
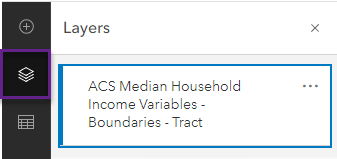
Step 2: Click Layers on the Contents toolbar (on the left) and select the layer called ACS Median Household Income Variables—Boundaries—Tract.
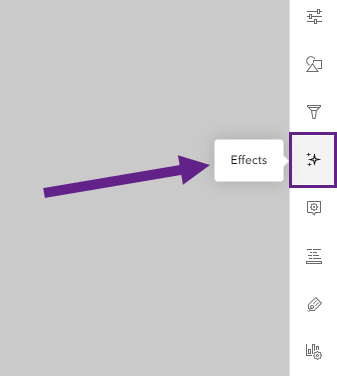
Step 3: Point to the Settings toolbar on the right and click Effects.
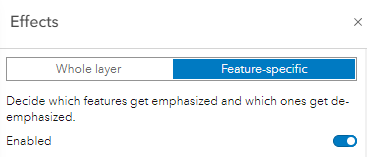
By default, the Effects options apply to the whole layer, but you want to apply effects on a subset of the data. Click the Feature-specific option to enable this capability.
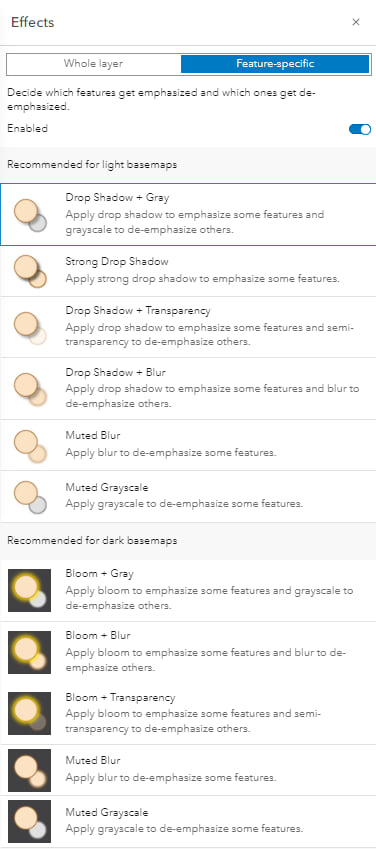
Once you select the feature-specific effects, recommendations appear based on whether the basemap is light or dark, and one will be selected automatically. In this scenario, the Drop Shadow + Gray option is chosen by default since our map has a light basemap. The preconfigured options let you quickly choose suitable effects based on the styling of the map.
Step 4: Set an expression to choose which parts of the data you want at the forefront of your map. By default, it will use the attribute being mapped, so in this case, you only need to change the expression slightly. The statistical average (x bar) of the data is highlighted on the histogram for reference. You want to highlight areas with an annual median household income below $62,800, so adjust the expression to use is less than. Next, type in “62800”.
Note: You can also slide the bar on the histogram to the value you need.
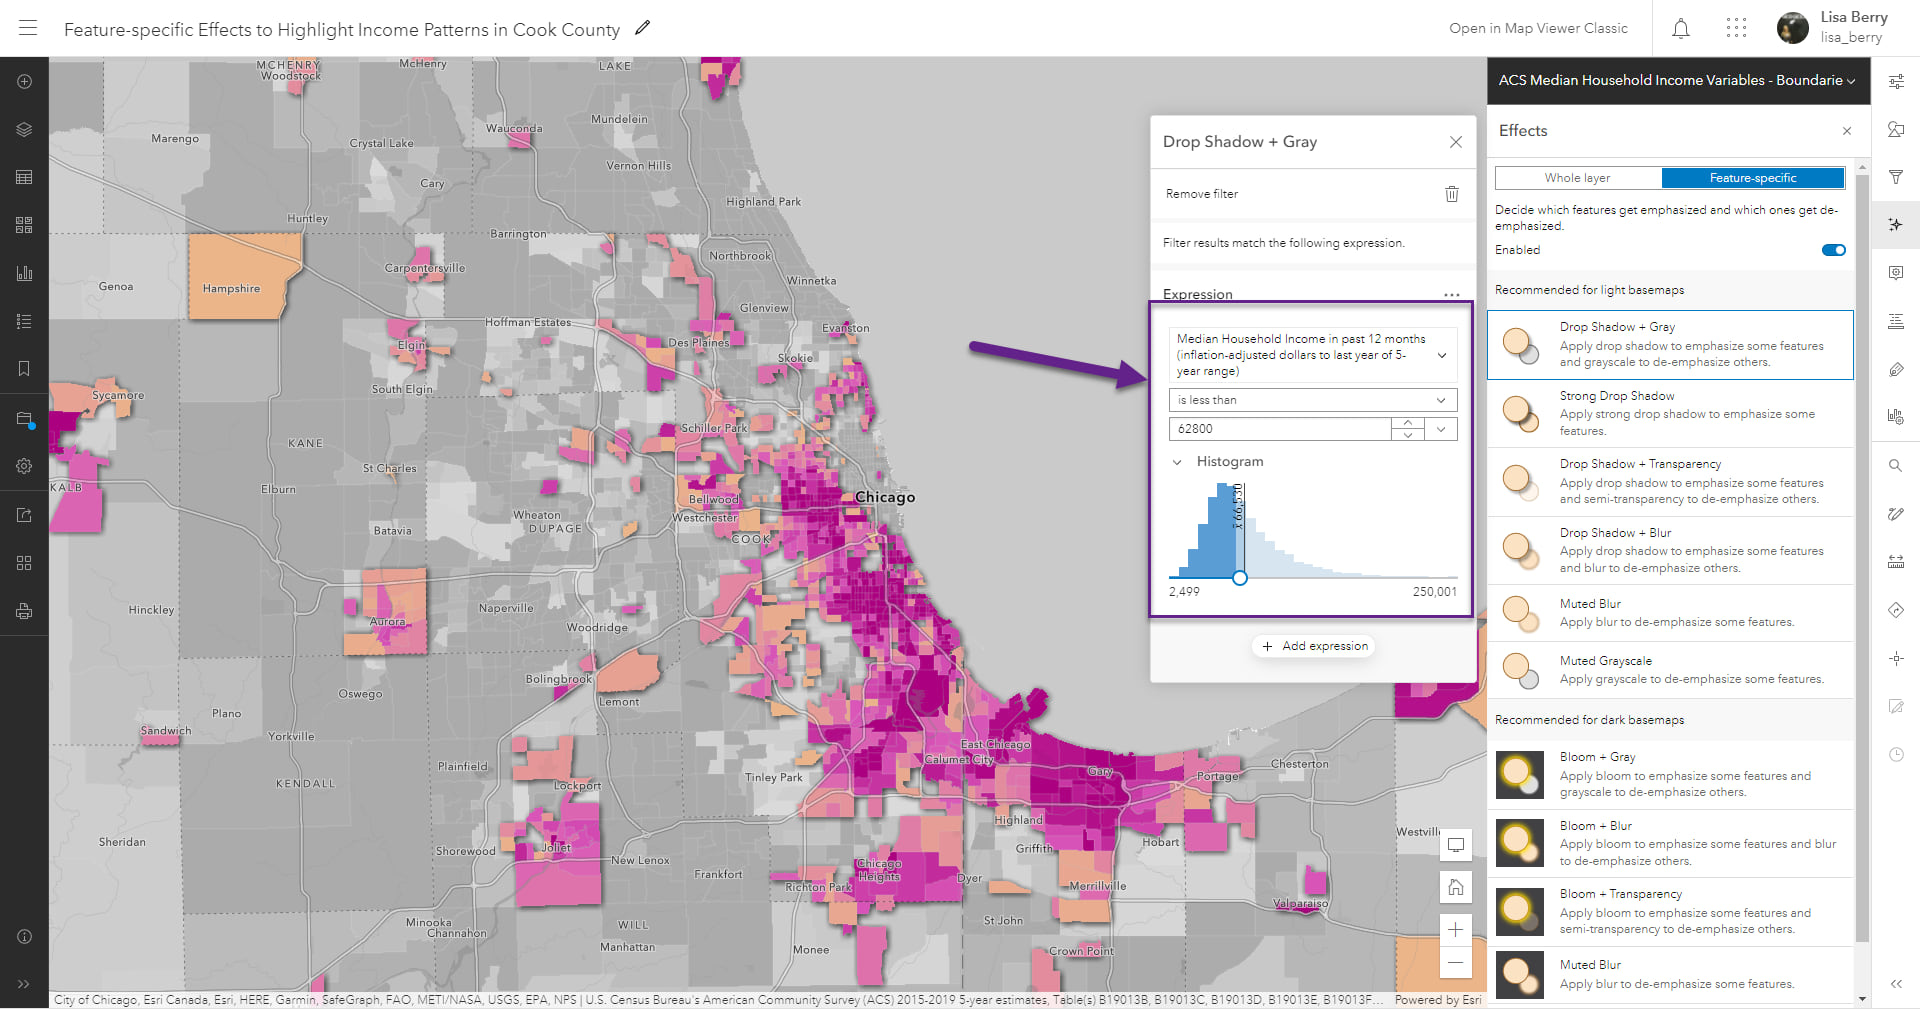
Notice how the map dynamically responds to any changes you make within the expression.
Now, click through the other options—such as Drop Shadow + Transparency, or Muted Blur—to see which one works best for your map’s purpose: to emphasize the areas of need. The example below shows all the options recommended for light basemaps, since they are suitable for your map.
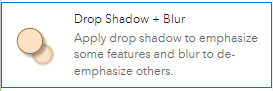
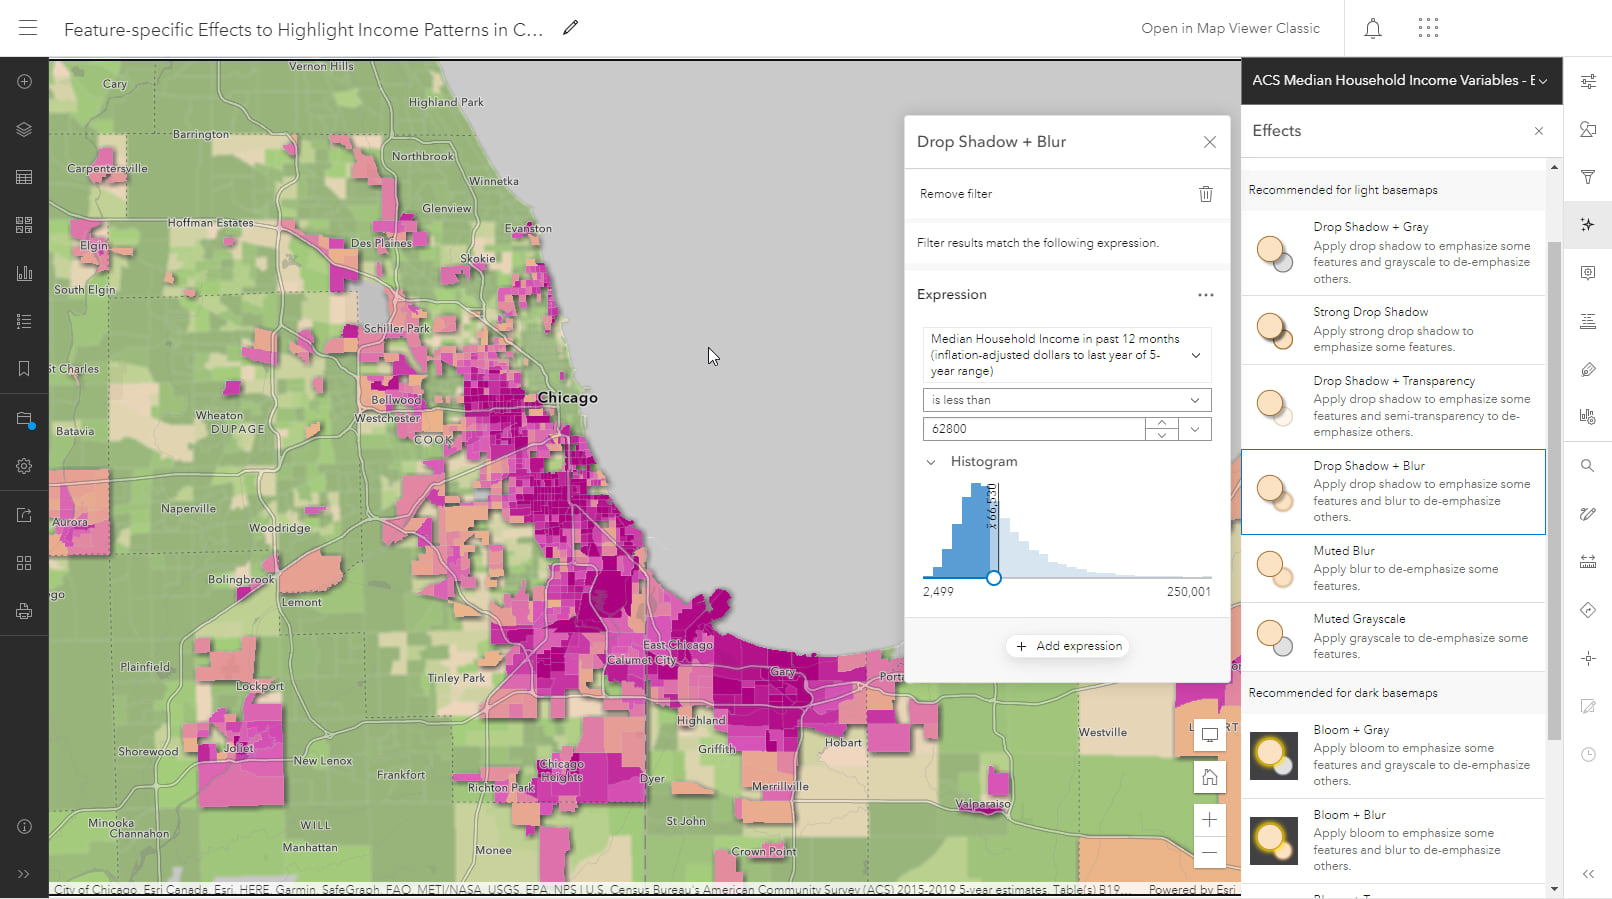
Step 5: Click the Drop Shadow + Blur option. This will make the green and yellow colors visible (but subdued) for the nonhighlighted features so that the overall pattern is still visible. This will help provide context about the other tracts and their income levels.
Step 6: Provide greater focus to your map by adding an expression to narrow down the highlighted features to the ones that fall within Cook County, Illinois. To do this, click Add expression.

This expression will use the same settings as the previous expression you created, so you will need to make some adjustments. Within the expression, click on the existing field Median Household Income in past 12 months (inflation-adjusted dollars to last year of 5-year range) to replace it with the County field. Find the County field within the fields list or type “county” in the search box.
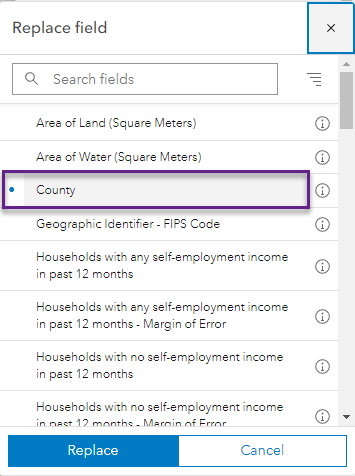
Find Cook County or type in “Cook County” within the unique values list. The expression should look like this:
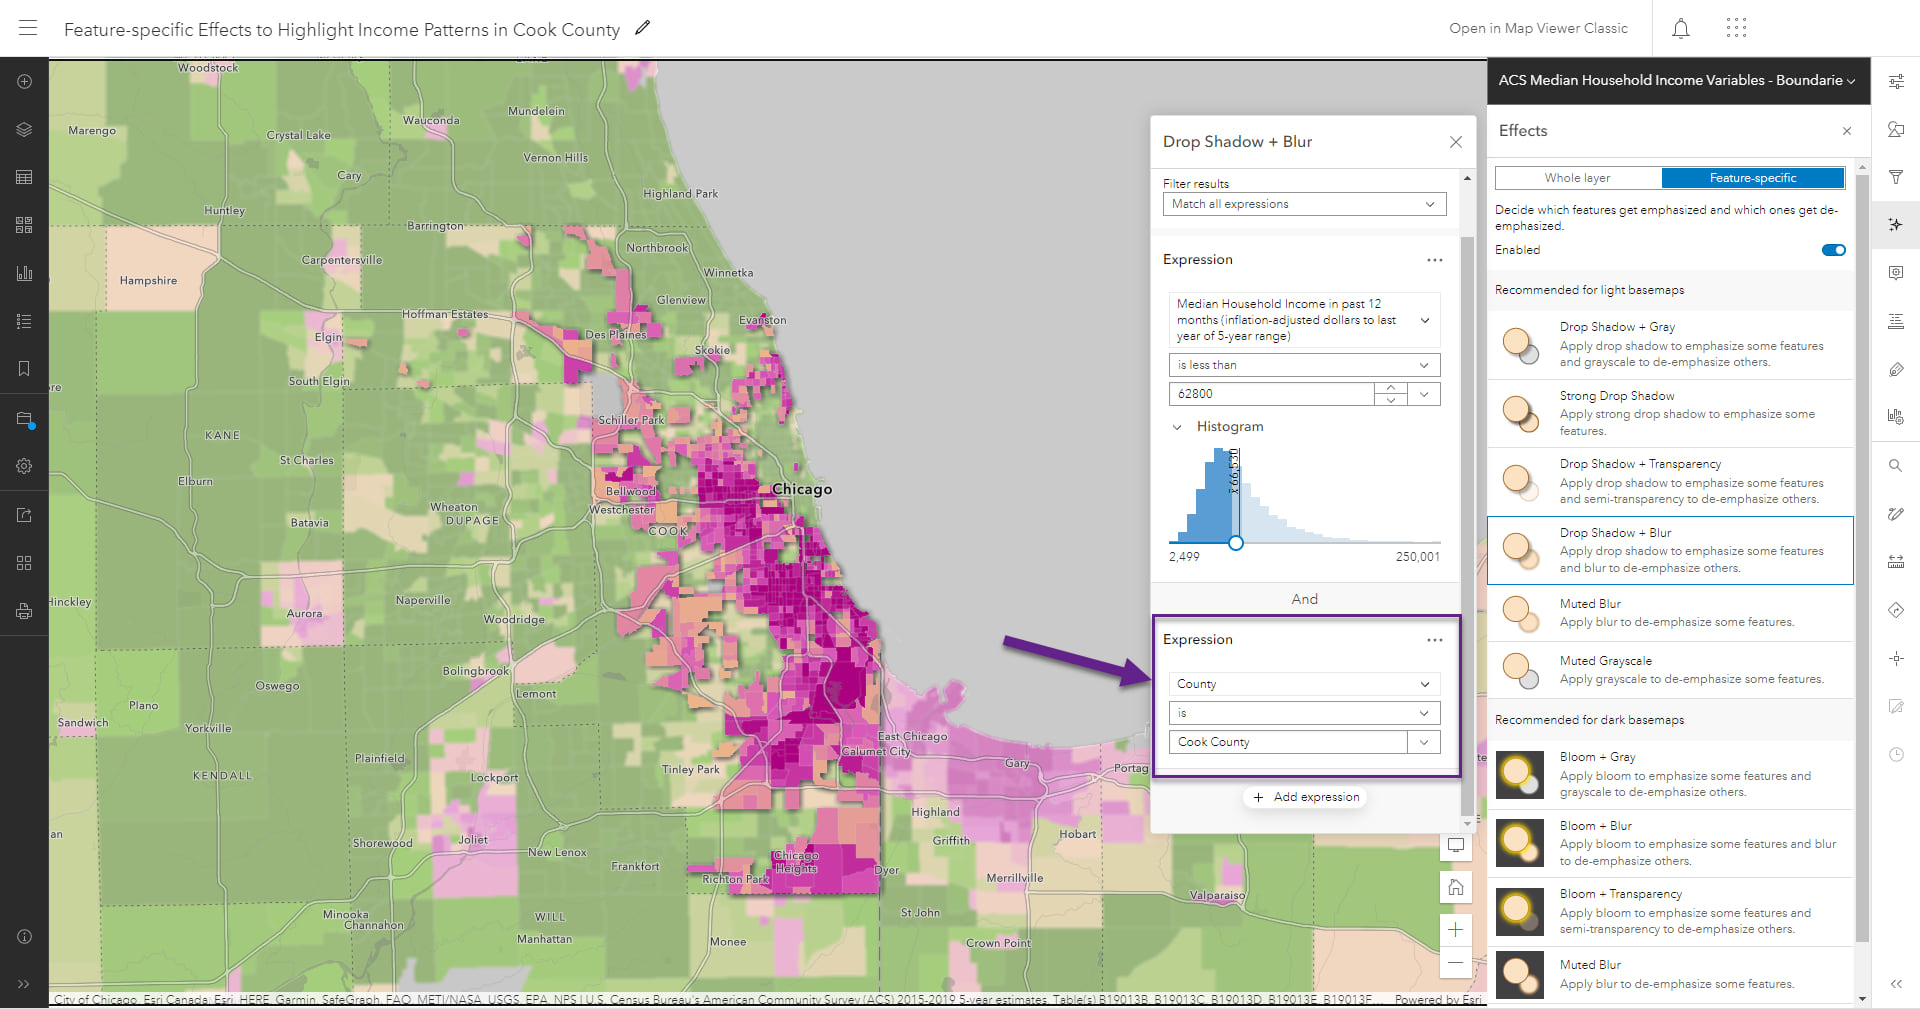
Now, the map showcases the census tracts within Cook County that have a median income below the national average. This map provides a focused view of the original map and allows you to see the areas of need more clearly.
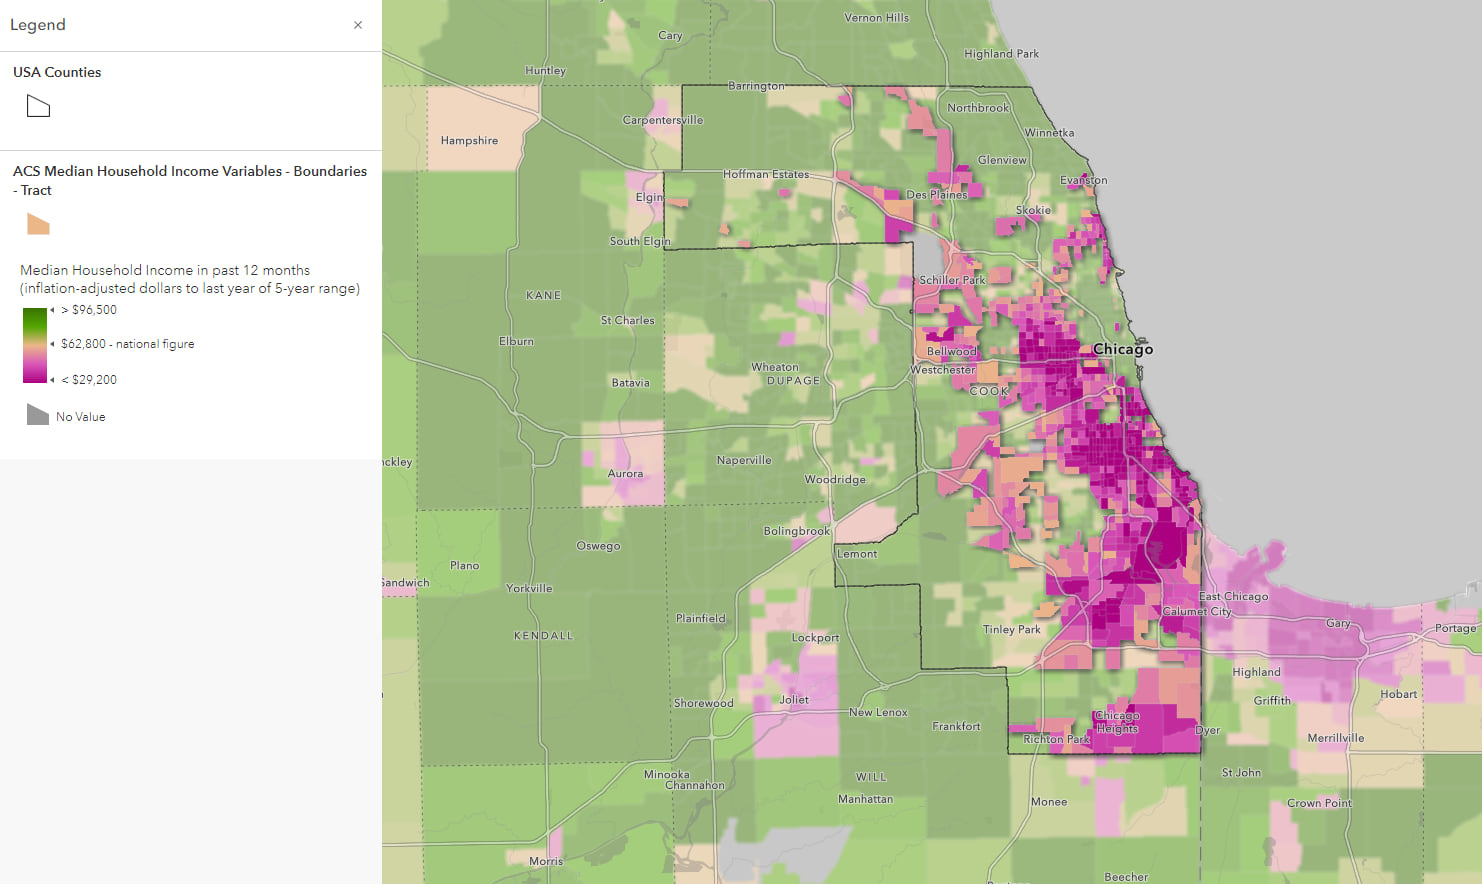
Optionally, you can add the boundary for Cook County to further emphasize the area of interest. US county boundaries are available from ArcGIS Living Atlas, and the final map would look like this:
Tip Takeaways
With just a few clicks, you were able to emphasize an important part of your data. Feature-specific effects make it easy to select a portion of your data and quickly choose a method to highlight those features. The ready-to-apply configuration options mean you are only a few clicks away from turning a good map into a stronger, more informative map. Click to see the final web map.
Additional Resources
- Feature-Specific Effects: The Next Enhancement for Map Effects
- Learn More about Map Effects
- Three Things to Try in the New Map Viewer
Note: Feature-specific Effects are currently only supported with ArcGIS API 4 for JavaScript and later, so they will not appear in Map Viewer Classic or applications based on the 3.x API. To see which apps are based on 4.x, visit this blog.
