Map effects apply graphics software-like effects to features in a map layer. New for the December 2021 release of Map Viewer, feature-specific effects take the next step by allowing map authors to emphasize some features in a layer with one kind of effect and de-emphasize the rest using a different effect. We offer 11 paired effect combinations to choose from so this is one-click-simple to do.
Unlike a traditional GIS filter which just removes features, feature-specific effects keep everything on-screen so we don’t lose the larger data context.
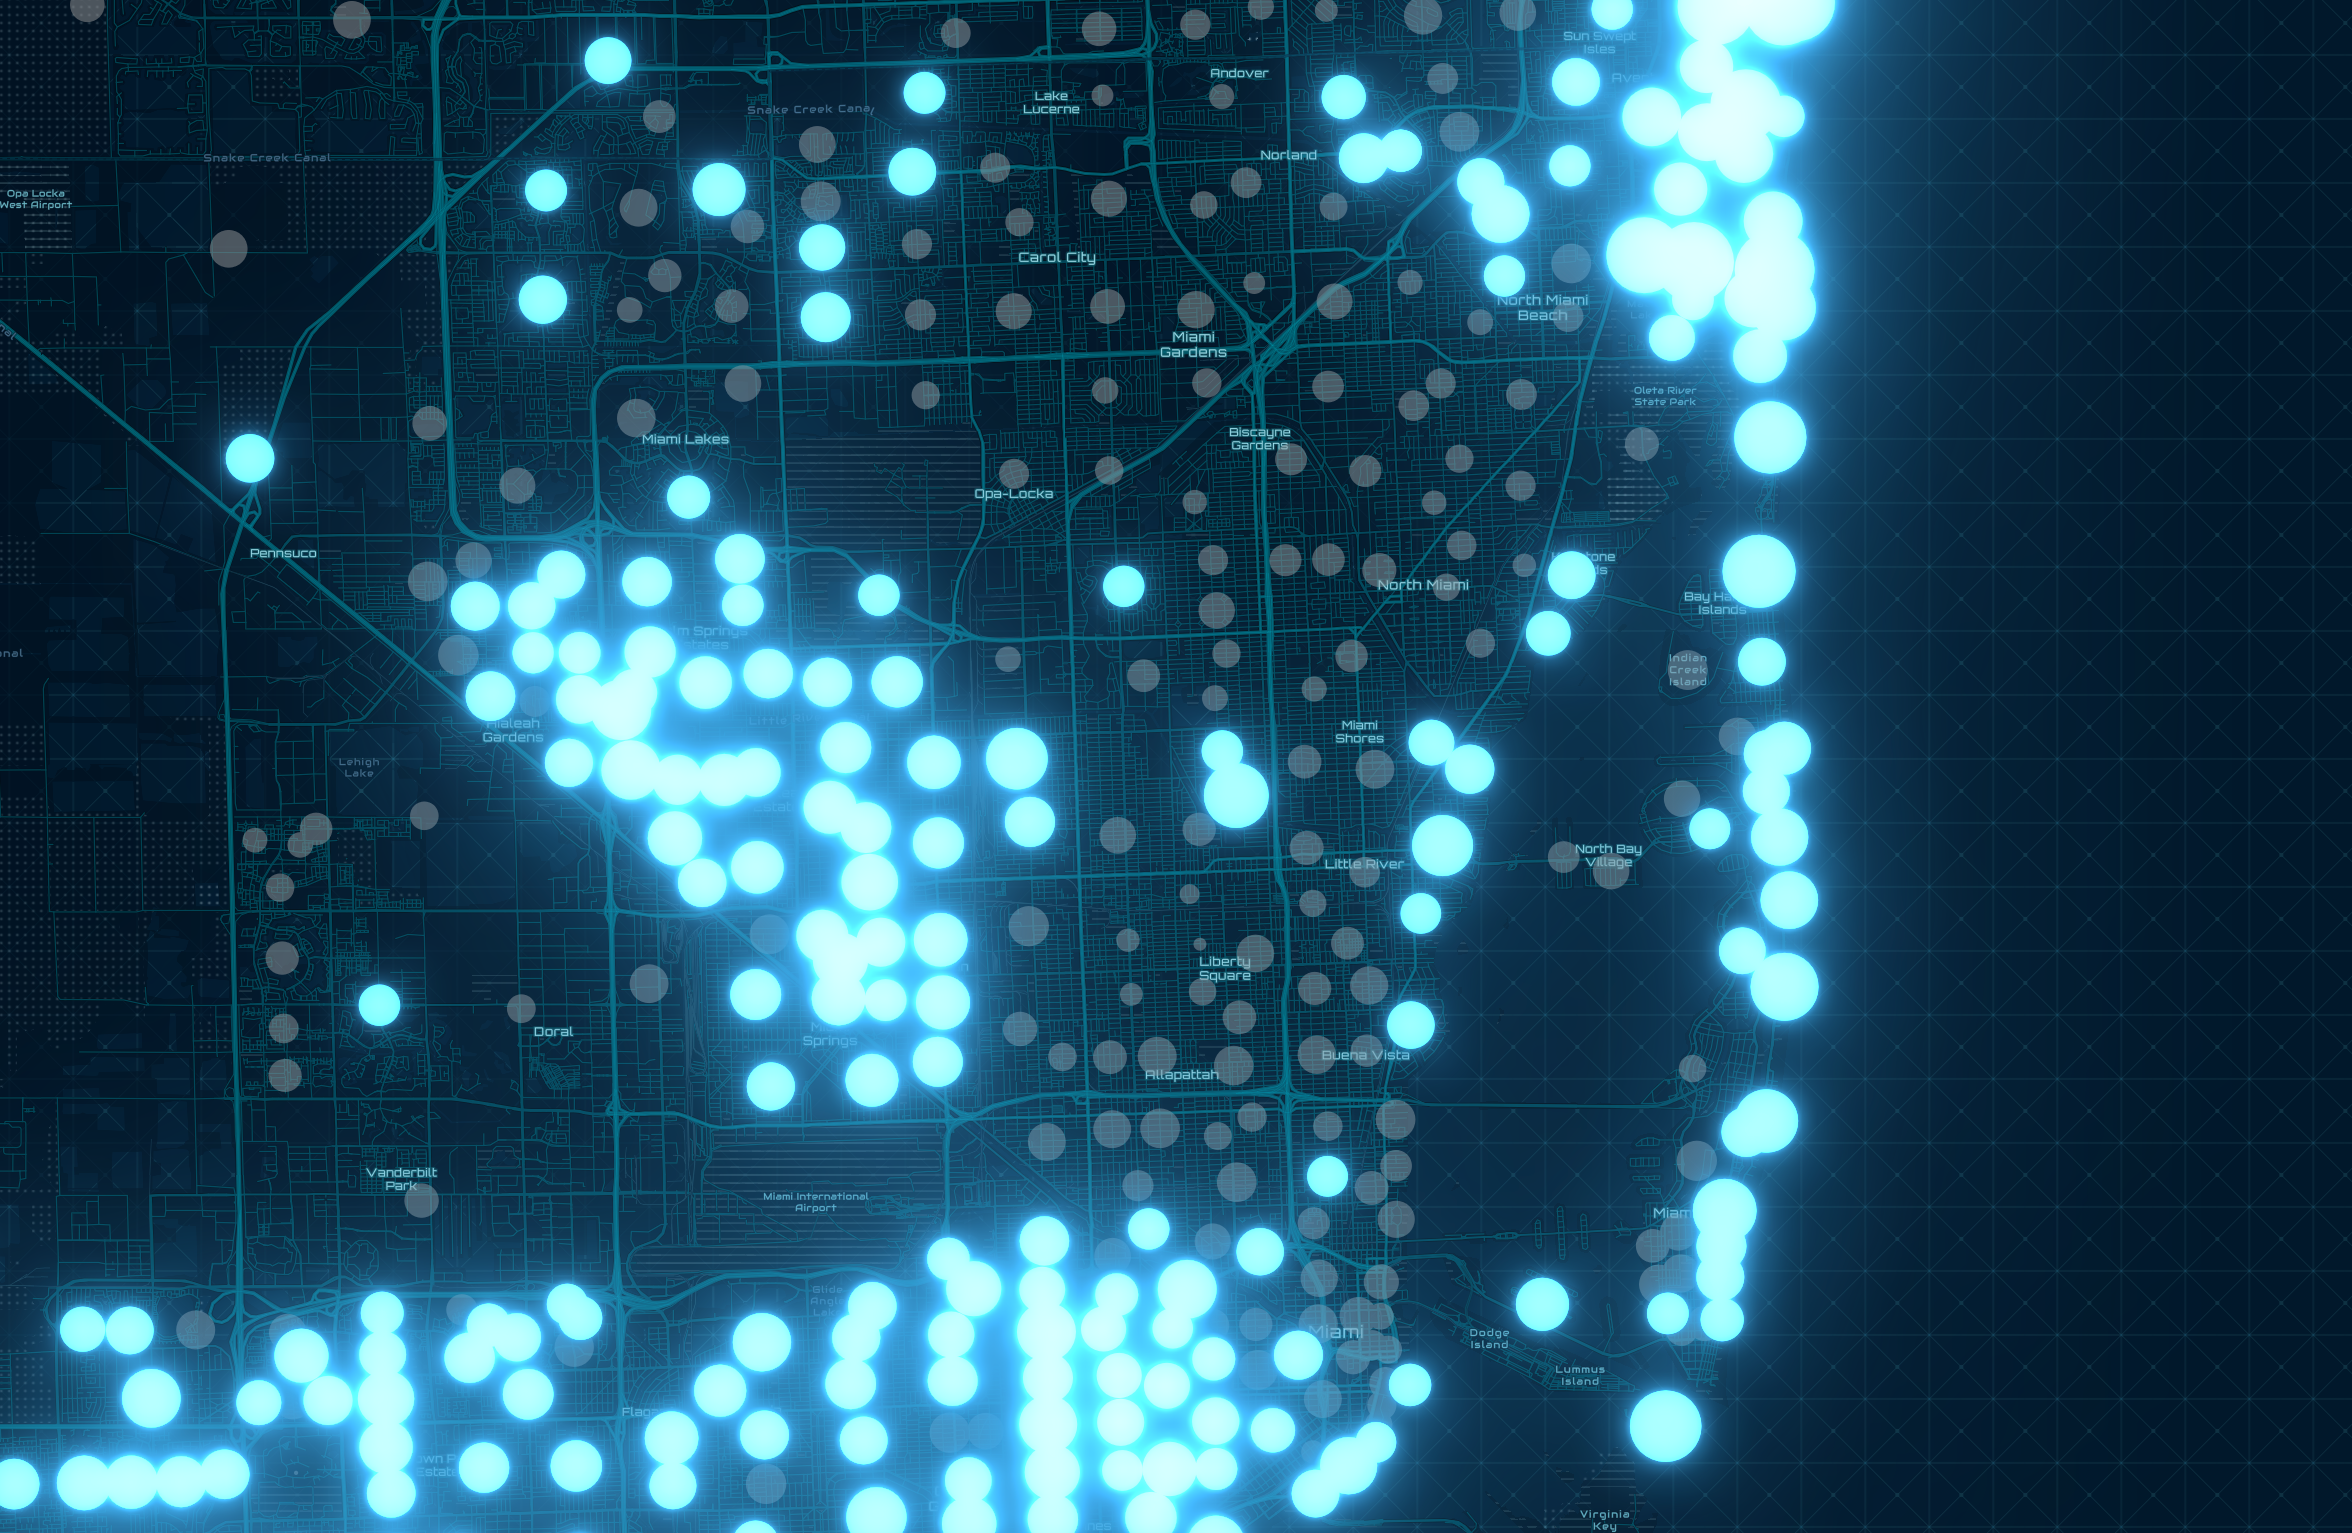
This proportional symbol map of median age (source ACS data) uses the “Bloom + Gray” combination to highlight areas with a median population over 40 years old (Bloom effect) and de-emphasize the rest (Grayscale effect).

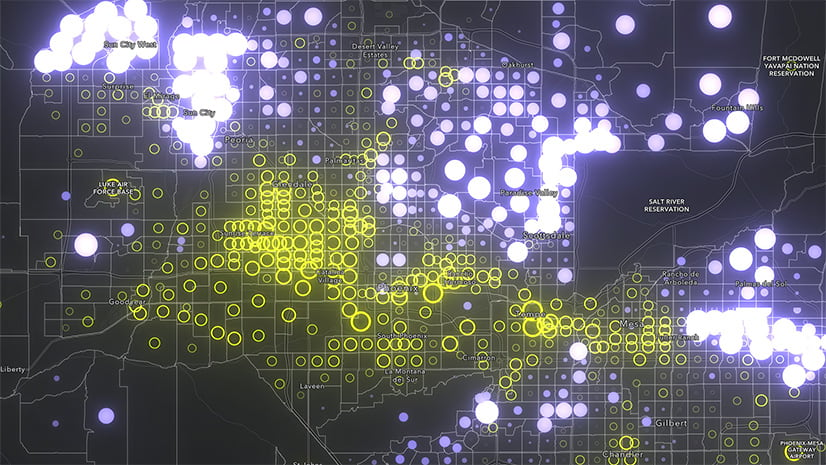
Drop Shadow + Blur is the effects combo used here to call-out places in the Denver Colorado metro area with a median age of under 35. The Filter Expression UI should be familiar to anyone who has done filtering in Map Viewer before.
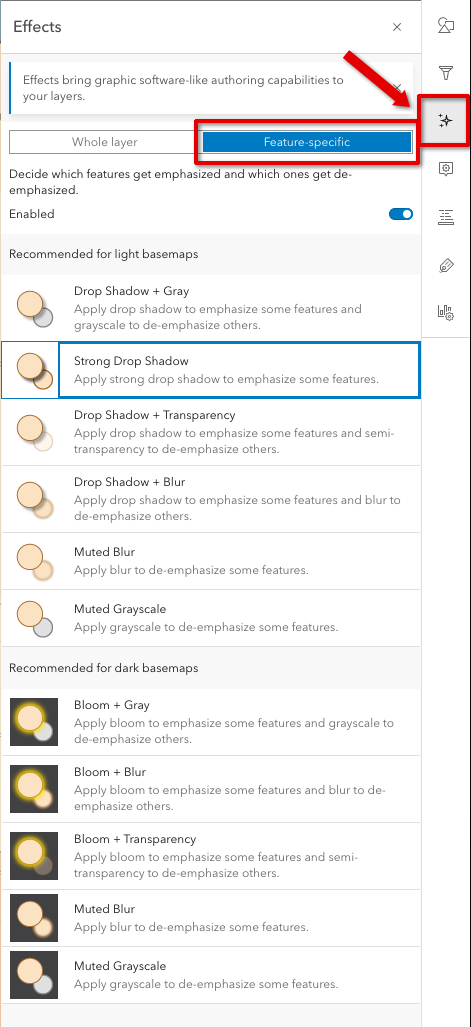
Find the new feature effects in the Effects Pane under the Feature-specific tab. To make things easier, we’ve optimized and organized this for light or dark basemaps, though of course you’re free to use any of these.
Pro Tip: You can add more than one filter expression, such as “show me places with an average age under 35 AND employment over 10%” as a way to filter on a map of voting patterns.
Use the interactive histogram
I highly recommend interacting with the histogram. Use the handles to drag the breakpoints, or set the values manually. One of my favorites is to use “is between” and drag the filter window through the data range. Seeing the map light-up in real time is a delight (and kudos to the team for delivering this kind of performance).
Our goal in all of Smart Mapping has been to bring the best ideas from Data Visualization to web-based GIS. Namely, that allowing people to work at the speed of thought, using highly interactive and intuitive tools such as histogram sliders (used throughout our UI) will help us to uncover details and insights. It’s not about producing one map, or one analysis. Data exploration is as much as art as a science and it is primarily visual: You don’t have to know what numbers to type into sterile input fields before seeing a map, you can “visually move through the data” finding things you didn’t even think to ask for.
Highlighting a Region
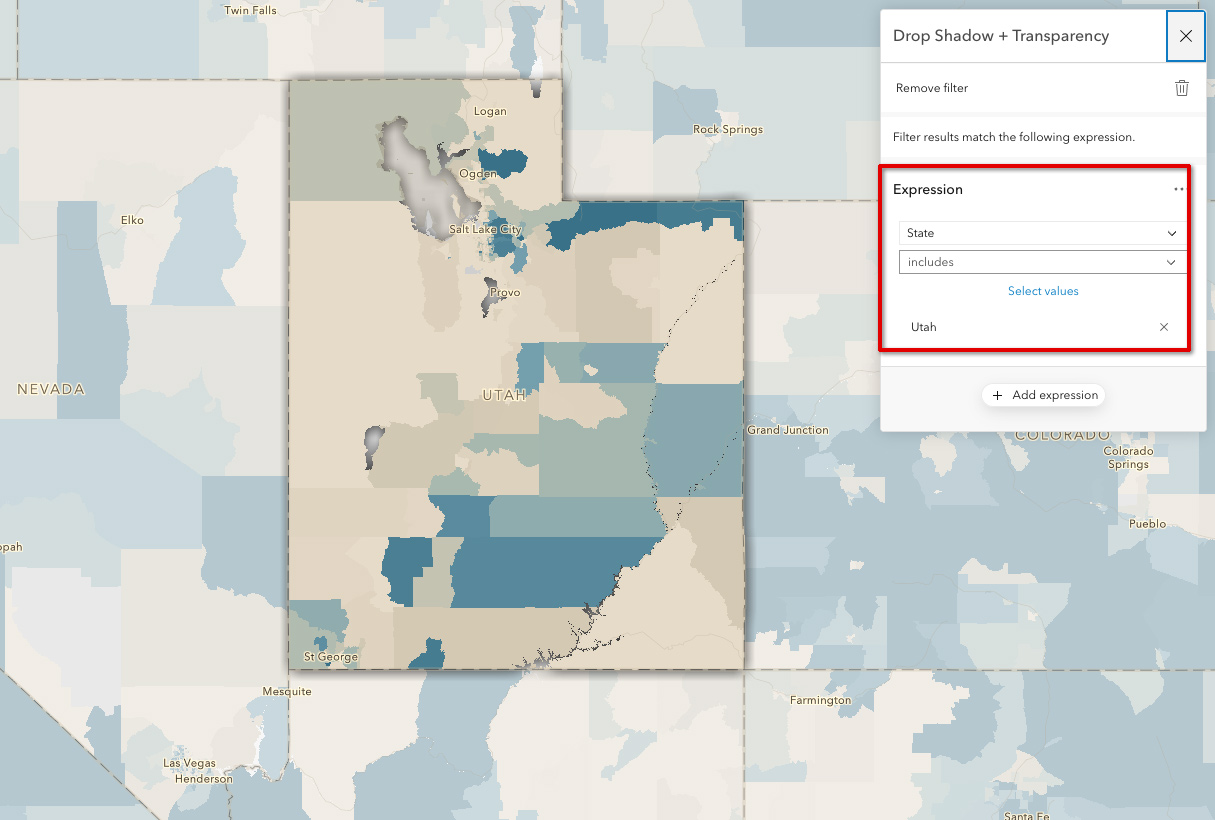
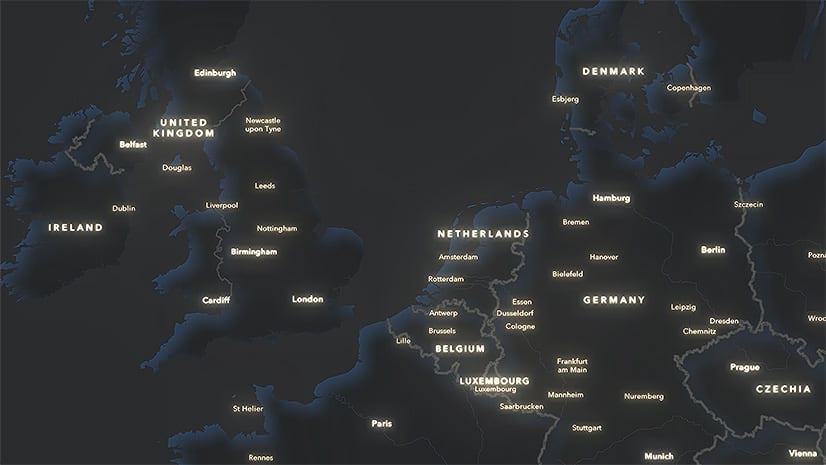
The filter expression doesn’t need to be numeric; it works great with strings too. Here I’ve used “Name includes: Utah” to isolate the state. Add more than one state or region to create custom regions. You can also highlight places based on categorical data such as crop type or day of week for traffic accidents.
One caveat: Feature effects won’t work on layers that have clustering turned-on, so just turn clustering off to use them.
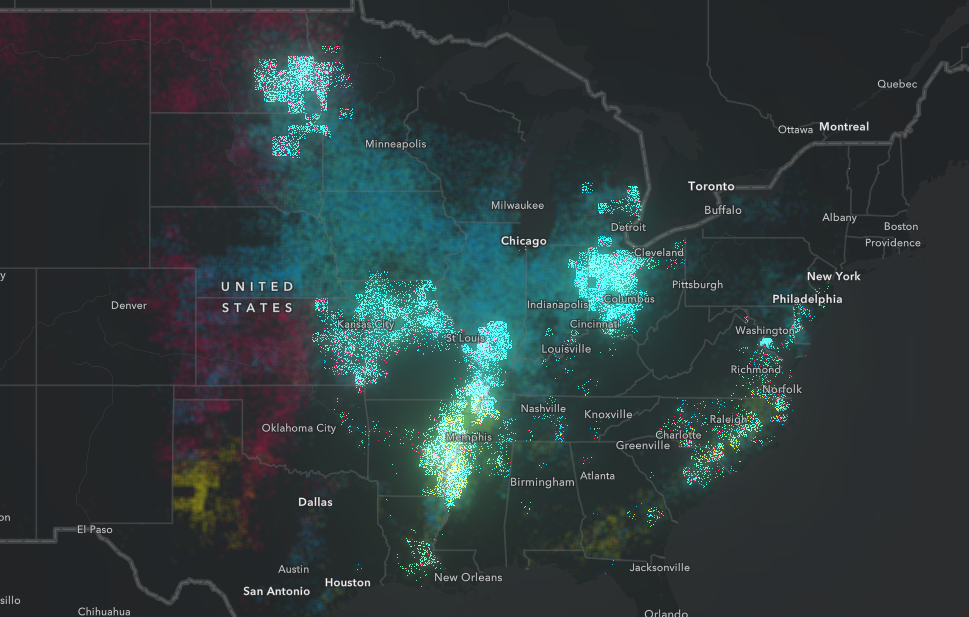
This dot density map has a feature-effect applied to show a different kind of geographic region: One defined by the predominant crop. Highlighted on this map are U.S. Counties where soy beans are the dominant crop grown. Counties in which other crops dominant (corn, cotton, wheat) are pushed back using a blur effect.
Next Steps
Anytime you want to call-out certain features on a map, consider using Feature-specific effects. Experiment with filtering based on the variable that is mapped, or on other variables for more complex data visualizations. And work with the interactive histogram to uncover new patterns in your data.
Happy Mapping!

This is really cool! thank you for sharing how to visualize data no one has seen before. Can’t wait to start!