displaying 999 results
ArcGIS AllSource is used to track opioid diversion, allowing auditors to spot irregularities between doctors, patients and treatment centers.
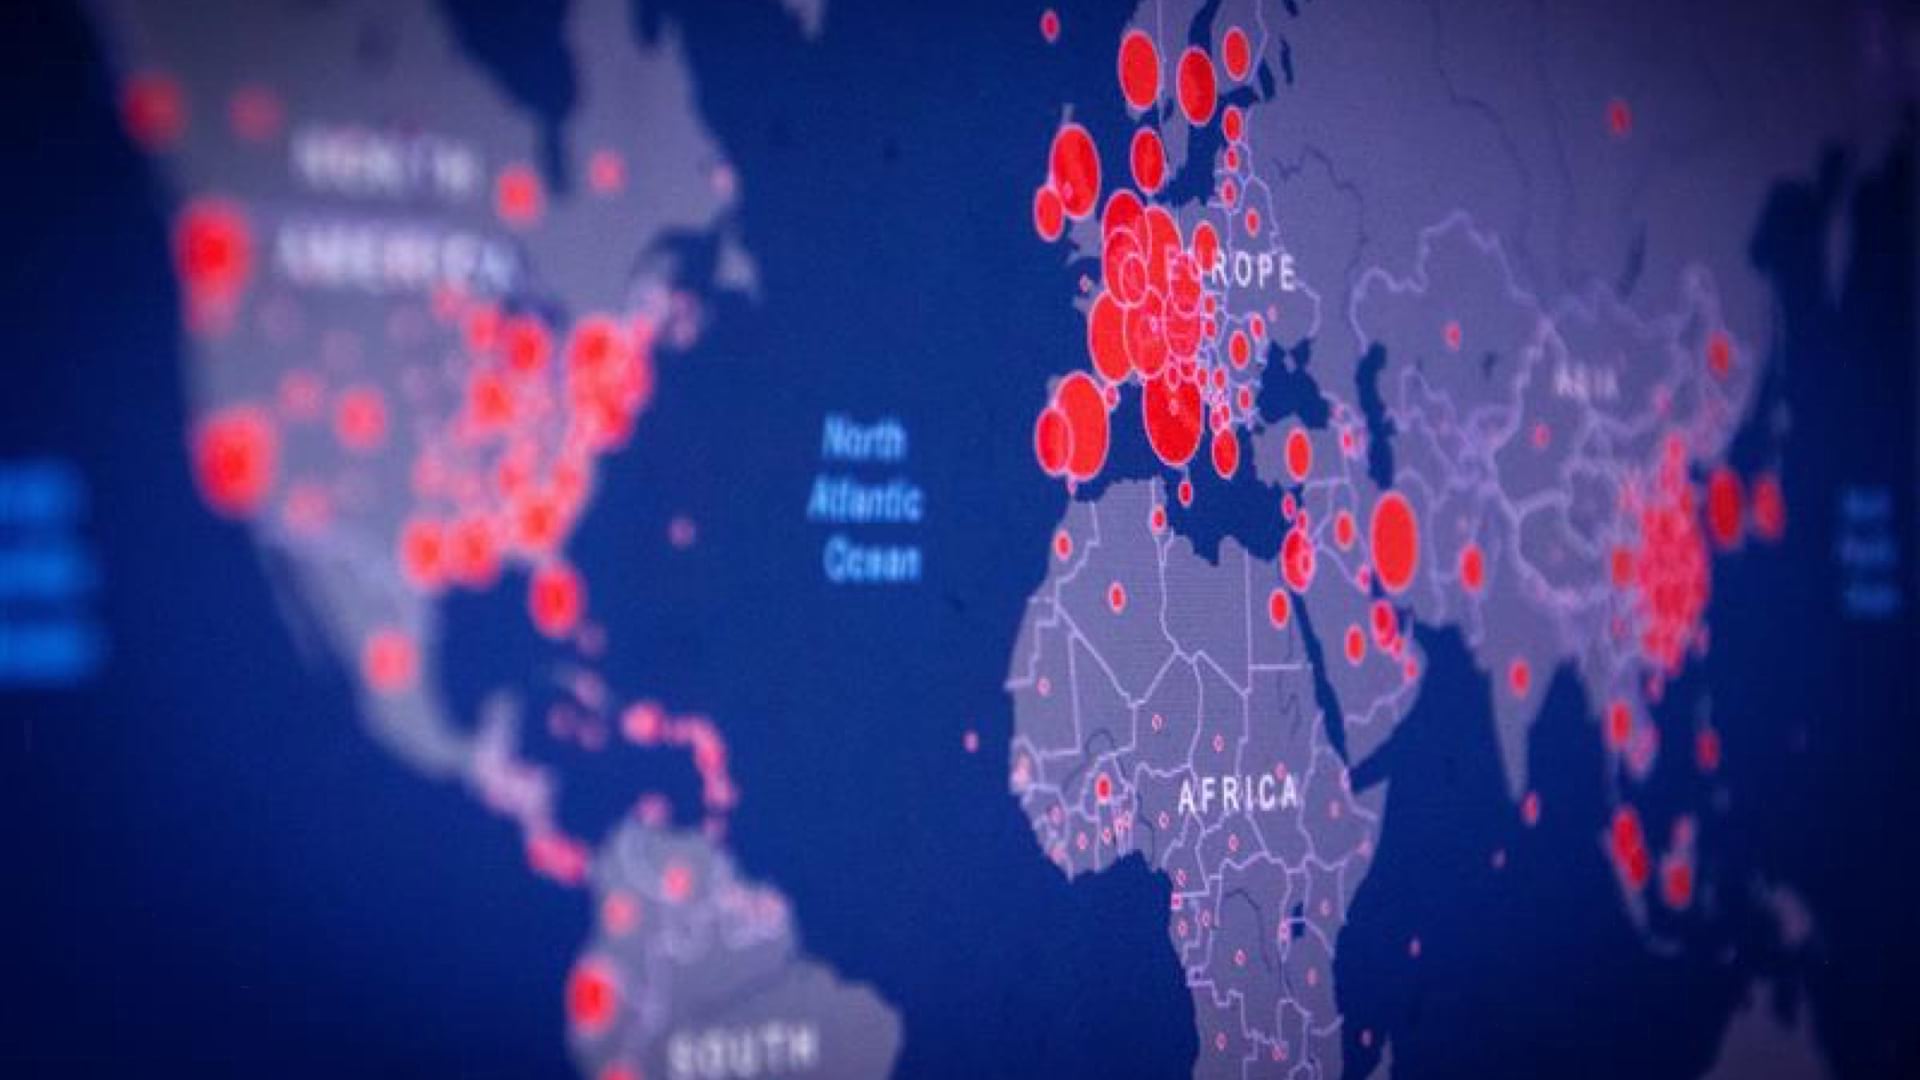
GIS departments throughout the United States can provide their organization valuable information about the spread of COVID-19 as cases rise.

In the old town district of Bratislava, Slovakia, a live map reduced wait times in the country’s push to test every adult over two weekends.

During the baby formula shortage, Mothers’ Milk Bank used ArcGIS Business Analyst to engage with parents in need and find more donations.

The Past Pandemic World, by Thomas Fisher, examines how previous pandemics have changed cities and how COVID-19 is altering various spaces.


The latest from Esri Press is an expanded edition of Cartographies of Disease: Maps, Mapping, and Medicine, a comprehensive survey of mapping...

For Menghestab Haile, using GIS for food and nutrition security is only the first step in getting information into the hands of decision-makers.
Dr. Lauren Gardner from Johns Hopkins talks about the origin and evolution of the Johns Hopkins COVID-19 dashboard.
Esri's ArcGIS for Server adds geographic data and analysis to web applications that serve organizations and communities in a variety of ways.

New rules have sped up efforts to replace every lead pipe in the US to protect drinking water.