Rumbles of discontent over certain forms of commercial development are beginning to change the nature of business planning in cities, towns, and rural communities across the country and the world.
This spring, lawmakers in Maine passed a bill containing the nation’s first statewide moratorium on data centers (though it was ultimately vetoed by the governor). At least 10 more states are considering bans. In Texas, Van Zandt County passed a temporary moratorium on all green energy projects, including wind, solar, and battery storage.
Even the facilities that house Americans’ extra stuff have come in for scrutiny, with bans on self-storage units popping up in Rhode Island and other locales.
Amid this flurry of state and local legislation, business leaders are turning to an enterprise software—geographic information system (GIS) technology—that their teams already use for precision-guided site selection and market analysis. Through mapping and analytics, GIS provides insight into community sentiment and helps companies adjust growth strategies.
Build It Somewhere—Just Not Here
Residents in increasingly vocal communities may support clean energy and understand that data centers are part of the critical infrastructure enabling American innovation. They’d just prefer that the facilities—which could introduce the rumble of gas turbines or the blinking lights of wind turbines—be built elsewhere.
Location analysts help companies anticipate where backlash may occur by exploring psychographic data. While demographic data dissects a population by income, age, and ethnicity, psychographic analysis provides insight into values, motivations, and preferences.
Banks, for instance, have used psychographics to assess where customers will adopt self-service banking. A similar sentiment analysis could indicate whether a farming community will be open to solar projects—or view them as a nuisance.
Strategic planning that does not account for local sentiment invites business risk. Even if a state is known for lenient regulations, homeowners and businesses may be on different wavelengths. Frustrated residents have ousted officials who supported unpopular development plans.
Mapping Construction Hot Spots—and Development Deserts
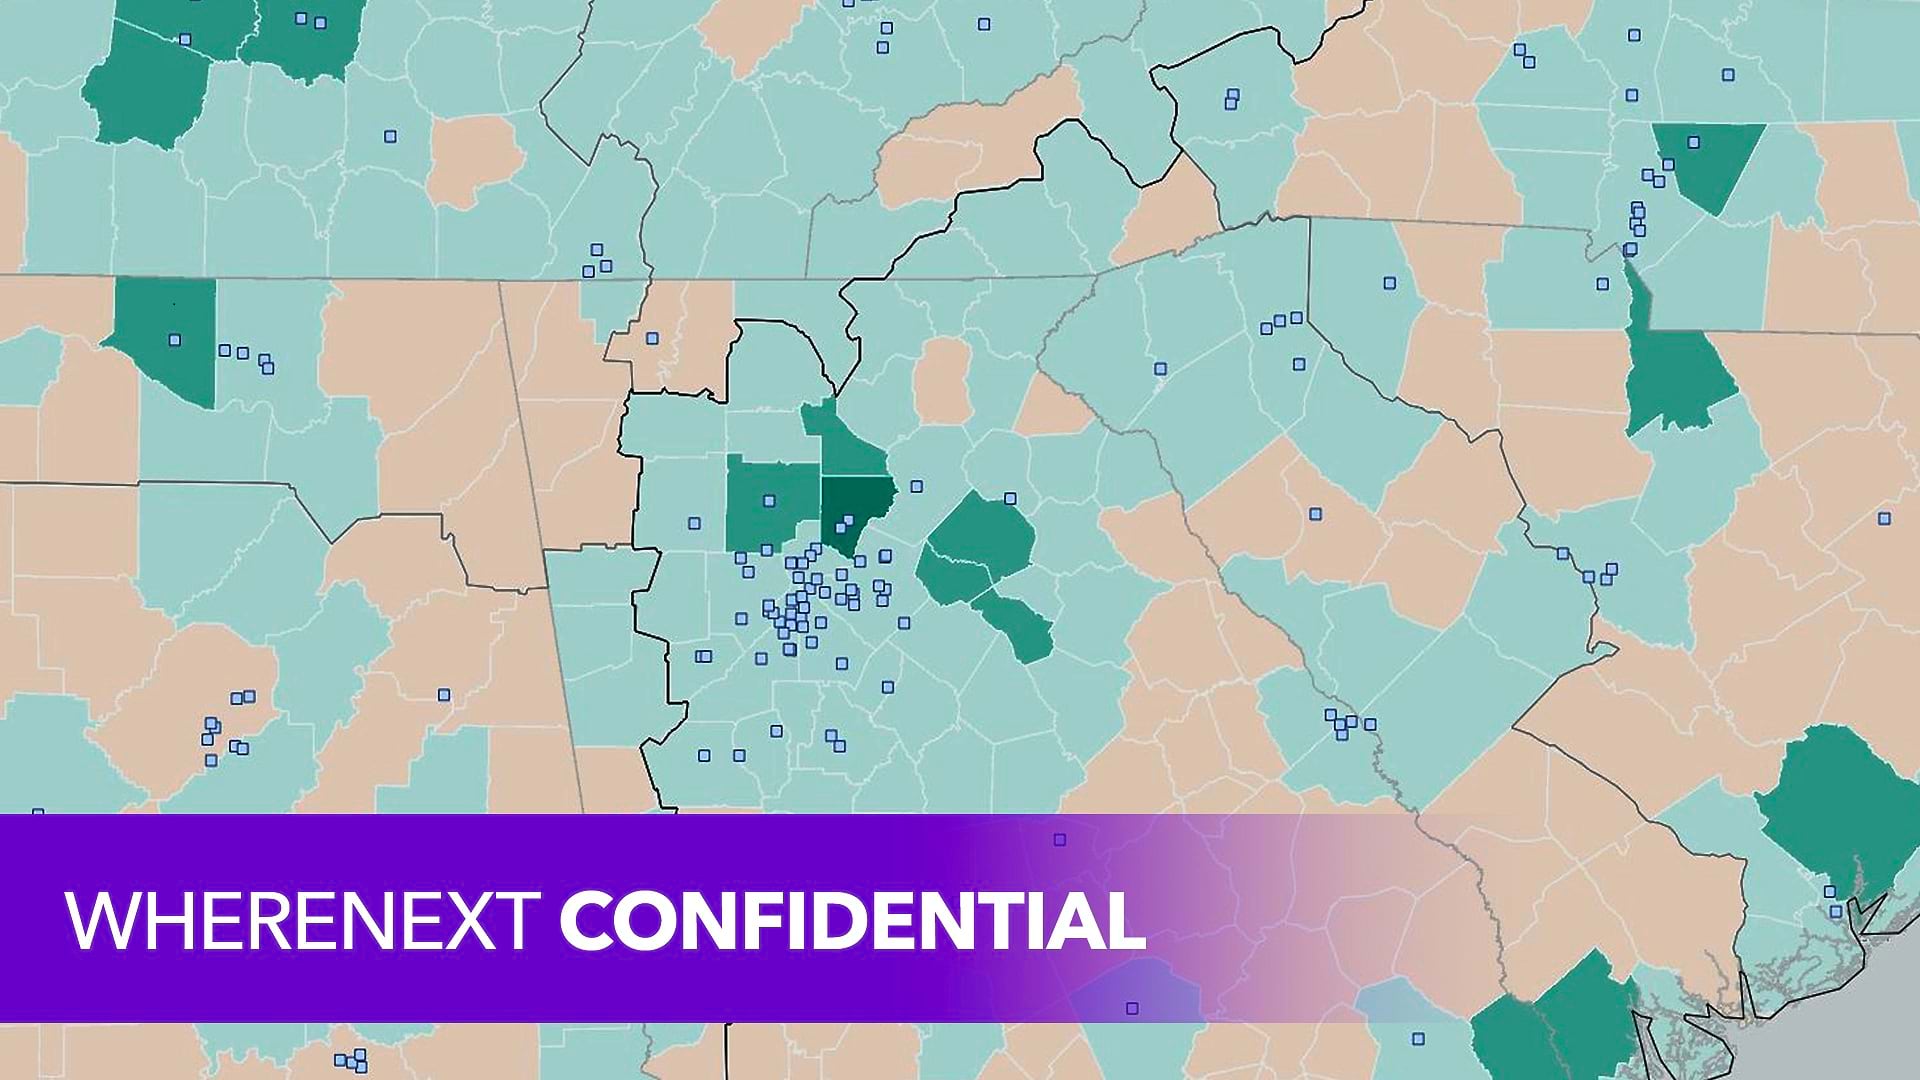
Executives routinely use GIS maps and dashboards to evaluate business environments at the national and local levels. A heat map of permitting data could indicate promising markets for certain developers. Virginia, for example, issued 1,239 permits linked to data centers between 2024 and 2025, according to a construction intelligence firm—80 percent of all related permits in the country.
Conversely, companies can identify markets that are a poor fit for construction by mapping cities and counties that have passed moratoriums or community bans on certain corporate activities. Executives used similar techniques to keep tabs on business locations during the COVID-19 pandemic, when local lockdowns rapidly changed where and how businesses could operate.
GIS maps enriched with zoning data help businesses narrow site selection searches to the areas approved for industrial construction. For example, some cities have not banned self-storage facilities outright—but have created zoning that keeps facilities off main streets or away from residential neighborhoods.
The Art of Staying Above the Fray
Navigating the cultural and political shifts of the moment is a tricky task for business leaders who largely wish to remain neutral.
Location intelligence from maps and analysis helps companies track the trends that most impact their operations. Firms can monitor hot-button legislative issues that may prove divisive in the communities they serve.
GIS is already the go-to technology for site selection. By using maps to analyze permitting and zoning data and visualize the changing nature of community sentiment, leaders can ensure that market planning accounts for all the realities of today’s business landscape.
The Esri Brief
Trending insights from WhereNext and other leading publicationsTrending articles

December 5, 2024 |

June 23, 2026 |

March 3, 2026 |

March 17, 2026 |

April 7, 2026 |

June 2, 2026 |