Something striking has happened to consumer perceptions of the US economy in the postpandemic era: What they think now sharply diverges from how they act
A report from the US Federal Reserve Board found that consumer confidence data doesn’t capture the market’s mood the way it used to. To understand this sentiment–spending paradox, businesses must analyze new data sources.
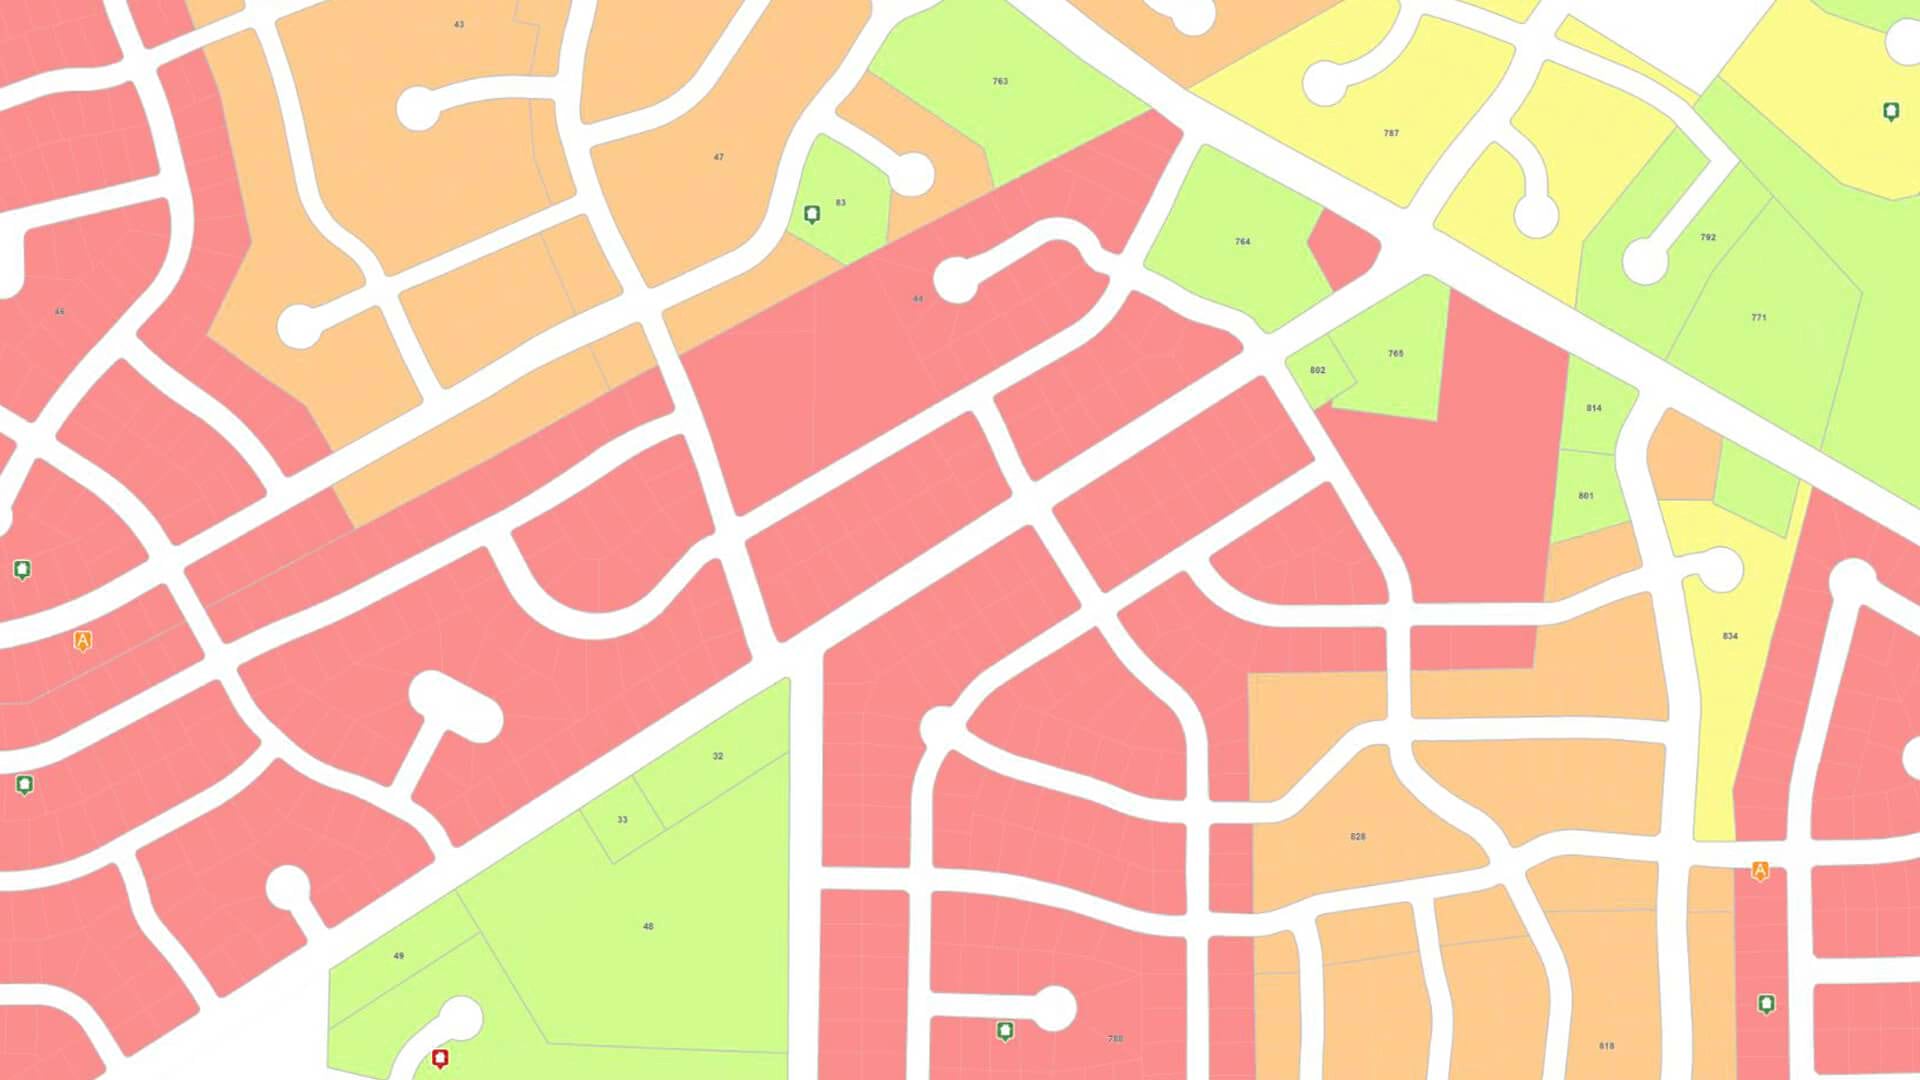
A geographic approach to that data analysis can clarify confusion. Maps created with geographic information system (GIS) technology reveal consumer patterns in a context that business planners readily understand.
Consumer Sentiment Diverges
In mid-2022, a puzzling phenomenon emerged. With the COVID-19 pandemic in full force and the price of goods unusually high, consumer sentiment stood at historic lows. In the years that followed, inflation moderated and the labor market caught fire, with wage gains soon outpacing rising prices.
Despite the improvements, consumer sentiment continued its prolonged decline. By the end of 2024, that metric was at a low not seen since the Great Recession.
A similar paradox appeared in income data. During normal economic times, when incomes rise, consumers’ outlook on the economy tends to improve. In mid-2022, that link broke and has remained severed since. Case in point: Although most households now report that their income has increased in the past several years, overall sentiment remains low.
To better understand what happened, authors of the Fed report collated five years of consumer sentiment surveys with verified purchase data.
The startling discovery was that consumer purchasing behavior belied their gloomy sentiment. They were actually buying more goods in 2024 than they had in 2019 (not just spending more, which might have been explained by inflation). This was true even for households whose income had declined since 2019.
Unlocking the Truth About Consumer Spending
Data disparities like this can have consequences for businesses and consumers.
After supply chains recovered from the shocks caused by the pandemic, many businesses saw that consumer sentiment was low and assumed spending would contract. As a result, they failed to invest in new production, effectively leaving money on the table, according to a McKinsey report.
But consumer sentiment is not the only way to take the temperature of the buying public. Demographic and psychographic data highlight the value people ascribe to certain products. Employment and disposable income levels are good predictors of consumer spending. The consumer price index indicates how inflation is affecting purchasing power, while credit card debt levels can suggest when consumers might begin curbing their spending.
In a data-rich world, one metric alone rarely tells the full story.
Mapping Consumers
Most datasets on consumer behavior include a location component, which GIS analysts can use to create maps for executives and planners.
As with consumer sentiment data, the utility of a given metric can change over time. To minimize the risk of a data anomaly compromising product launches, pricing strategies, or distribution plans, top companies analyze location-rich datasets on multilayered maps.
The experience of the GIS manager at a prominent global retailer, detailed in a recent WhereNext article, illustrates the importance of putting data in context:
Knowing the average income of a customer segment. . . leaves important questions unanswered.
“That’s where we need psychographics,” the GIS manager explains. “Ok, you have $150,000 as an income, but how much of a percentage of that are you spending on clothing?”
No single metric provides a perfect picture of consumer behavior, but with a basket of data and the location technology to see it all in context, business leaders can make key decisions with a clear view of consumers.
The Esri Brief
Trending insights from WhereNext and other leading publicationsTrending articles

December 5, 2024 |

June 23, 2026 |

March 3, 2026 |

March 17, 2026 |

April 7, 2026 |

June 2, 2026 |