A retail chain noticed competitors opening stores in its markets. The head of sales asked: How is this impacting our store traffic?
The answer sat in millions of data points tracking store visits by time and day. Finding it requires serious analytical power—the kind that geographic information system (GIS) technology provides, as shown in the video below.
Geospatial analysis can process hundreds of weeks of visitor data and show exactly how foot traffic changed when competitors moved in.
With generative AI, GIS puts this processing power in the hands of decision-makers. Business leaders can now ask these business performance questions themselves and get answers in seconds.
Developing a National Picture of Business Performance
This video illustrates how spatial analytics surfaces insights about retail customer trends on a national scale, with help from Placer.ai data, straight from a search bar.
In this scenario, the retail CFO prompts the system to map all the company’s locations in Florida. Clicking on a store produces charts about its performance, including average visits by time of day and the number of unique visitors each week.
Next, the executive searches for locations around the US that have at least ten competitors. A task that might have required hours of data gathering and manual analysis is resolved instantly. The dashboard maps the relevant locations along with the number of competitors and average visits per day, per store.
To analyze another variable—like the effect of partnerships with social media influencers—the CFO asks to see stores where visits increased by at least 50 percent from February to March. Analyzing commonalities across the 30 stores that meet that criterion could indicate which marketing tactics are drawing customers.
Behind the scenes, the GIS analytics engine crunches massive datasets, but executives see only a map—and answers to their questions.
Getting the Edge in Competitive Analysis
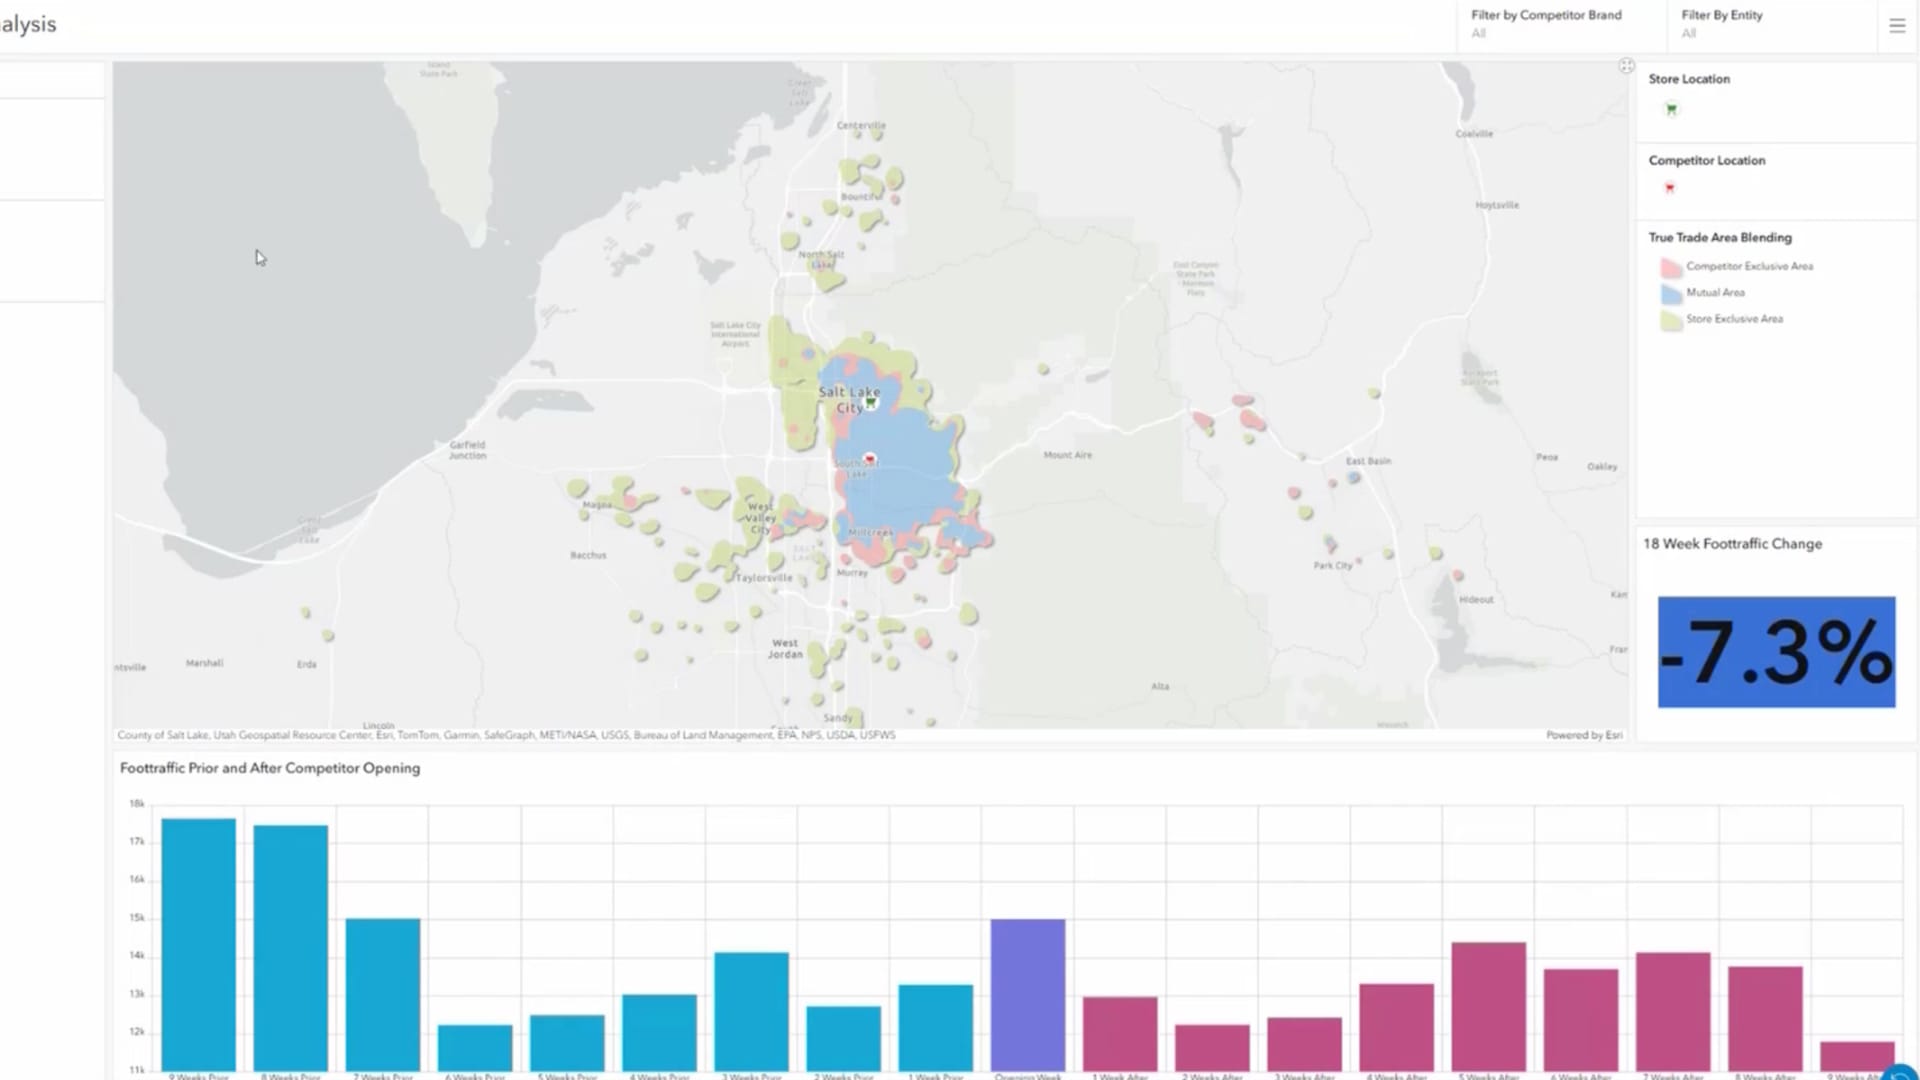
To understand how national trends are playing out on a local level, the CFO turns next to Salt Lake City, where two major competitors recently opened their doors.
A dashboard captures week-by-week data, revealing that foot traffic at the executive’s store dipped by 7.3 percent following the competitor’s launch.
An important backdrop to these findings is what the retailer’s trade area looks like and how it overlaps with those of competitors. Here, maps show the trade area for each store based on CRM data and human movement metrics—location analytics that bring clarity to strategic decisions.
For instance, the retail company may want to promote loyalty programs to strengthen ties with customers in areas where competitors aren’t yet operating. Meanwhile, in areas where multiple brands are vying for customer attention, executives may want to deploy marketing campaigns that emphasize competitive pricing and other points of differentiation.
Turning Gigabytes into Strategic Guidance
Until recently, mining high-value insights from hundreds of SKUs or millions of foot traffic records with precision and speed was the domain of a few tech giants. Today, an executive equipped with GIS enhanced by generative AI can do the same—just by pulling up a map and asking the right questions.
The Esri Brief
Trending insights from WhereNext and other leading publicationsTrending articles

December 5, 2024 |

June 23, 2026 |

March 3, 2026 |

June 2, 2026 |

March 17, 2026 |

April 7, 2026 |