It’s the beginning of Q4, and a retailer with hundreds of stores across North America is forecasting next year’s sales in the San Francisco Bay Area. The business, a first-mover in the area, has established a dominant presence with four brick-and-mortar locations. But competitors are expected to open nearby locations within the next year.
Executives recognize that the competitor stores will impact sales, and they want to factor those effects into revenue projections. The analytics team creates a model that probes the consequences of having a competititor store located in the same ZIP code as their store. They display the data on a map to show the relationships between stores.
This approach would be applauded by most executive teams. But what if it doesn’t reveal the whole story? What if the data ends up misleading executives, resulting in business decisions that hurt the company strategically and financially?
I’ve seen it happen. Digital transformation has opened new doors for companies, introducing a wealth of information and big data. In this new terrain where data abounds and analysis guides decisions, small missteps can lead an executive—and a business—astray. In this article, we’ll examine how executives can use new information and tools to drive valuable business decisions, while avoiding the pitfalls of one-dimensional analysis.
Data-Driven Leadership
Data-driven decision-making is a hallmark of executive leadership. In a recent PwC survey, 39 percent of senior executives said decision-making at their organizations is “highly data driven,” while another 53 percent characterized their decision-making as “somewhat data driven.” That means over 90 percent of business leaders are using some form of data to drive day-to-day decisions.
But the process of turning big data into data-driven decisions is laced with challenges, and some are easily overlooked. After all, data can mislead. Whether the data is flawed, analyzed incorrectly, or lacks key ingredients, it can lead executives to questionable decisions.
As George Box, an eminent statistician, said, “All models are wrong; some models are useful.”
Executive Decisions: Three Data-Driven Business Scenarios
In a world of rapid digital transformation, it is increasingly easy to confuse data with insight. By analyzing the where and even the when behind certain data, executives can add critical elements to business planning. Still, while mapping is a step in the right direction, there are pitfalls to avoid. That’s why every executive should be armed with tools and techniques to convert big data into information—and action.
What are the best techniques for converting data into useful, intelligent business decisions? To answer that question, we’ll explore three business scenarios where datasets, analyzed two ways, yield different results—and could trigger divergent business decisions. While the particulars are hypothetical, each scenario is drawn from real-world analysis.
Business Scenario 1: Adding Another Variable
Let’s examine a fairly straightforward example of data-driven decision-making.
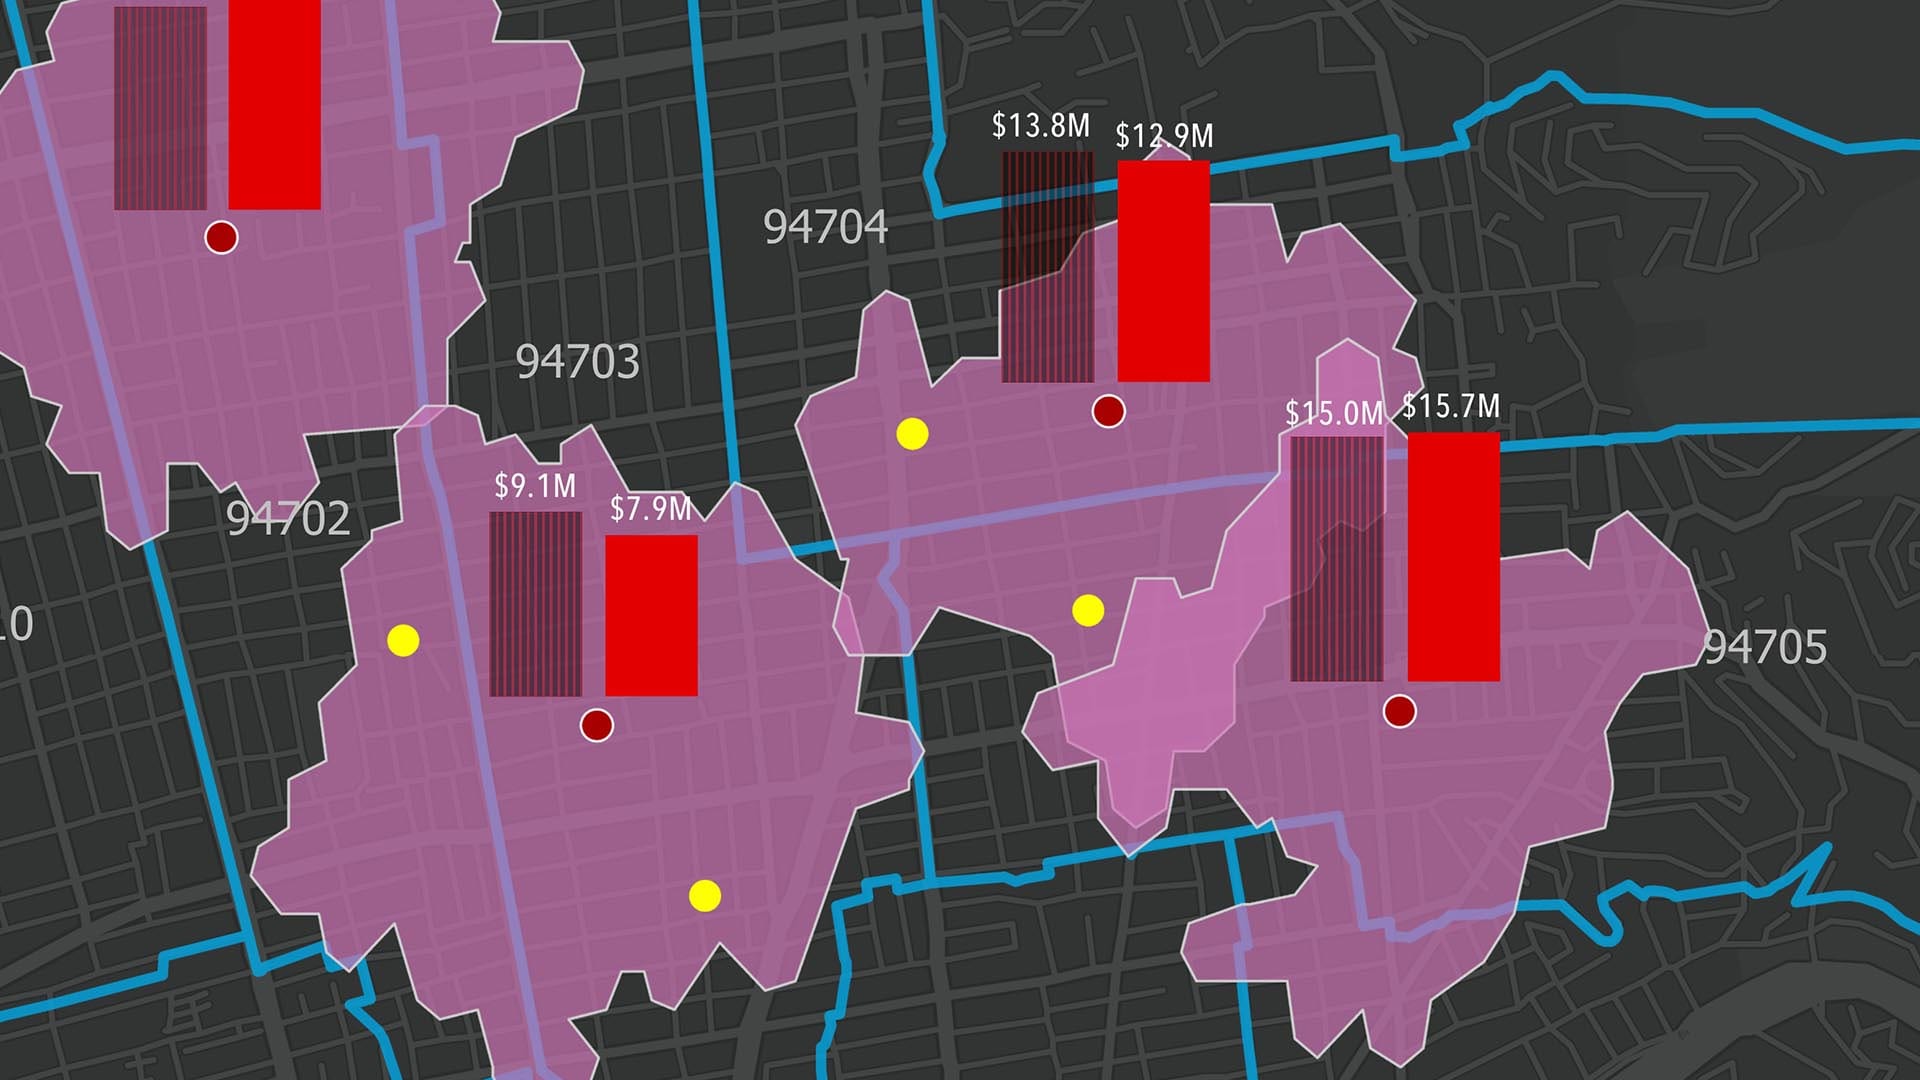
In the business scenario that opens this article, a North American retailer is projecting annual sales based on multiple datasets. Executives know that two competitors are building a total of four stores in this geographic market. The executive team wants to include the impact of these new stores in financials projections for the next fiscal year.
The company’s sales data, mapped by ZIP code, is shown here, with the yellow dots representing new competitor stores:

A member of the geographic information system (GIS) team has some reservations about the results. She suggests deepening the analysis by factoring in the physical distance between each store and its nearest competitor. To do so, the team uses GIS to analyze a new variable: a 15-minute drive time from each of the company’s stores, independent of ZIP code. The map below reveals the results.

The drive-time analysis shows that competitors will affect sales differently than first anticipated. The new map underscores that while ZIP codes are a common organizing variable, they can create artificial relationships within data. After all, customers cross ZIP codes at will—why wouldn’t the company’s data?
Neither analysis introduced here is objectively right or wrong, but each has business consequences. A less-precise sales projection will change where and how the retailer markets itself and staffs its customer service and sales teams—and even the merchandise assortment for each store.
GIS technology and other tools can uncover vital insight, but only when executives and analysts ask the right questions and think critically about how they analyze data.
(This scenario benefits from the science of network analysis. To learn about the technique, see the sidebar on the right.)
Business Scenario 2: Make New Friends, but Keep the Old
As businesses undergo rapid digital transformation, the tools, techniques, and data they can use to their strategic advantage are evolving quickly. At the forefront is a new wave of customer data that is helping drive business decisions.
Mobile apps, in particular, have remade the landscape of consumer behavior and predictive marketing. IHS Markit, a business intelligence consulting firm, predicts that consumer spending on mobile apps will reach $74 billion worldwide by 2020, up from $54 billion in 2016. The firm also expects the number of global smartphone users to eclipse six billion in 2020, up from four billion in 2016.

Clearly, mobile apps are big business. But perhaps even more intriguing than their promise of direct revenue is the treasure trove of customer data they can yield, from insight on spending habits to a window into foot-traffic patterns around retail locations. But turning digital data into business insight isn’t always as simple as it seems.
Consider a fast-casual restaurant chain that offers a make-your-own salad bar and quick counter service. The company developed a mobile app that allows customers to access special discounts and place orders before they arrive at the store. Several months after the app’s release, the company analyzed customers’ food choices and coupon use as well as their anonymized movements before and after visiting the company’s restaurants.
The data showed that a large proportion of mobile app users purchased soft serve ice cream after eating at the company’s urban locations—a finding supported by Google trend data, which showed rising North American interest in soft serve. Based on this analysis, the executive team began brainstorming ways to capitalize on the soft serve phenomenon. One solution they considered was to partner with a gourmet soft serve startup, piloting a joint marketing effort in a North Carolina city.
For a deeper understanding, the company analyzed mobile app data to show customer purchasing habits within an hour of visiting the restaurant, then mapped that data to reveal how far customers were traveling for soft serve.
This map shows that initial analysis.

In light of the findings, some executives pushed to roll out in-store soft serve kiosks across the company’s footprint. But other team members wondered if that was the right course of action. Examining the mapped data, they realized they were perhaps too eager to capitalize on the fruits of the data, and were overlooking a key fact: only a small fraction of the company’s customers were actively using the app. While the app data was easy to collect and valuable in its own way, it didn’t necessarily paint a full picture of customers’ purchasing habits.
To balance the view, the company added a more traditional dataset, conducting in-store polls of customers who didn’t use the mobile app. Those results showed the executive team that less than 5 percent of all customers were purchasing soft serve—but more than 15 percent were buying coffee nearby after their meal.
This map shows how the combined data sets alter the view in just one section of the city:

By examining the relationship between the datasets, the company gained a more nuanced view of customer behavior, empowering the executive team to make data-driven decisions based on customer preferences in certain store locations or geographic regions.
The restaurant’s experience shows how business decisions based on siloed datasets can lead to shortsighted planning—and how access to new digital datasets can exacerbate this tendency. By contrast, analyzing the full spectrum of data, integrated spatially, can reveal valuable insights and drive significant decisions on matters such as product development, partnerships and acquisitions, and personalized marketing plans.
(This analysis relies on density-based clustering, a form of artificial intelligence. To learn more, see the sidebar on the left, or listen to part 1 and part 2 of a podcast on making data smarter.)
Business Scenario 3: Presenting Data versus Analyzing Data
A sales executive at a large manufacturer in the Chicago area saw the potential of digital transformation early on and has built a team of analysts to examine product sales.
One of the analysts used GIS to create an animated spatiotemporal map—which combines where and when data—showing sales over the past several quarters. The animation, which showed how sales in each location changed over time, was an improvement on the static maps the team had been using, according to the analyst.
Below is the analysis.
Examining the animation, the sales team noticed patterns in the data and concluded that certain areas were ripe for sales expansion. These were rational inferences, but they may not serve the business well in the long run.
When looking at an animated map, we draw inferences because the human brain is programmed to find patterns, even when meaningful relationships aren’t present. The phenomenon is called “apophenia,” a term coined by Klaus Conrad, a German psychologist. Dr. Michael Sherman, a science historian and author of The Believing Brain, calls the same tendency “patternicity”—the tendency to find meaningful patterns in both meaningful and meaningless data. He has also researched what he calls “agenticity,” the tendency to infuse patterns with meaning, intention, and agency.
When working with data to make decisions, executives and analysts need to acknowledge the biases of human thinking. Data may appear to be straightforward and objective. But it is not immune to our own patternicity and beliefs. At worst, data provides dubious evidence for the decisions we believe are correct.
In the case of the sales team, the lure of an animated tool may have opened the door to those biases. The same dataset, with a hotspot analysis applied, provides much richer insight:

By viewing this spatial analysis, we can see exactly where new hot spots appeared, identify where new and persistent cold spots exist, and understand—scientifically—where sales are growing and where they are falling off. Rather than asking the sales executive to make subjective judgments, the spatial analysis powers more objective conclusions and the ability to drive clear business decisions based on data.
Depending on the approach used, the sales team may devote resources to different geographic areas. The time and money spent on establishing new sales leads represent a significant investment—one that should be made based on accurate analysis.
(This scenario draws on a technique called hot-spot analysis. To learn more, see the sidebar on the right.)
Making Data Work for Businesses
For business executives, it has never been more important to have a strong understanding of data analysis: its power, its weaknesses, and its applications. By analyzing data in ways that approximate reality as closely as possible—approaches that are nuanced and rich in information—business leaders can more closely predict sales, develop customized marketing plans, accurately allocate resources, enrich product development cycles, and more.
Data has tremendous potential to mislead. But in the right hands, and with the right tools, data has an infinite capacity to reveal the truth and drive better business decisions.
The Esri Brief
Trending insights from WhereNext and other leading publicationsTrending articles

December 5, 2024 |

April 7, 2026 |

May 12, 2026 | Multiple Authors |

February 17, 2026 |

March 10, 2026 | Multiple Authors |
July 25, 2023 |