displaying
Use # to search tags and @ for authors
By Christa Campbell | ArcGIS Insights |
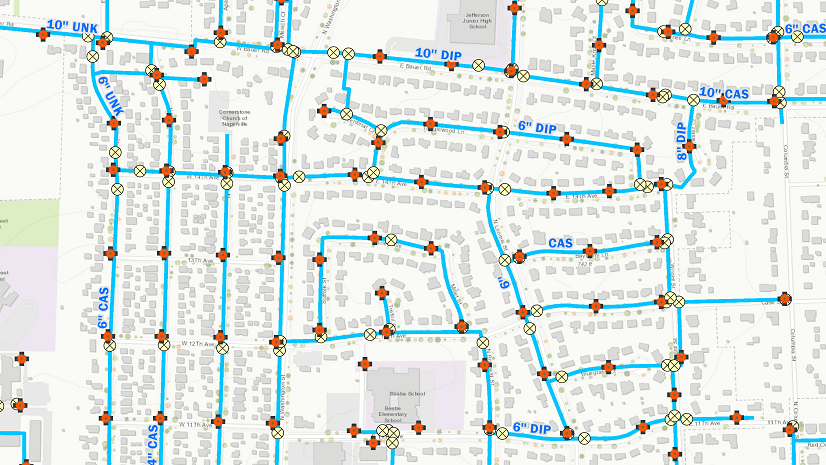
Is your GIS living up to its potential? With today’s technology, your GIS can be so much more than a system of record. I know GIS is gr...

By Vicki Lynn Cove | ArcGIS Insights |
Box plots are a simple chart type that helps you to understand the distribution of your data. They also happen to have a lot in common with cats.
By Esri Press Team | ArcGIS Insights |
By Christian Harder and Clint Brown. Insights for ArcGIS is a browser-based analytic workbench that enables you to interactively explore...
By Vicki Lynn Cove | ArcGIS Insights |
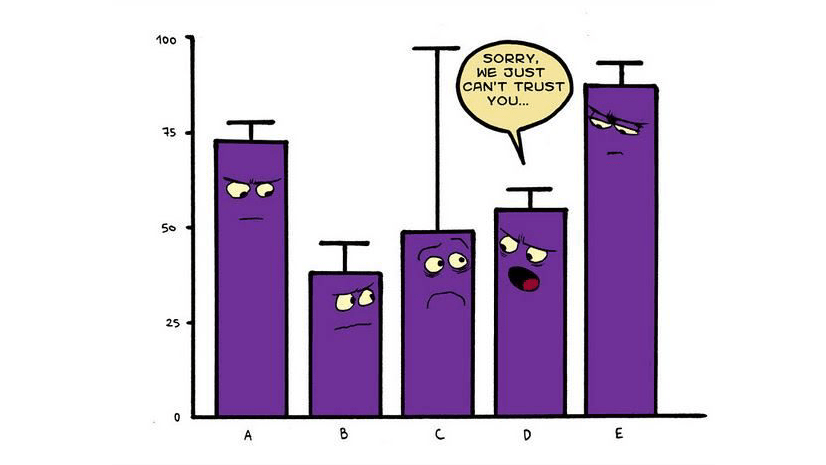
Learn everything you need to know about bar charts, including what happens when three statisticians walk into a bar.