Violence is an unfortunate reality the world must face. You may have seen it personally, in your community, or on the world stage throughout the years, and it’s always a scary sight. Often, the perpetrators of these violent crimes rely on the inability to trace crimes across states and jurisdictions. This is where ArcGIS AllSource can shine a light on an otherwise dark subject of reality. ArcGIS AllSource is an intelligence software built for investigative, geospatial, and link analysis. It is designed for intelligence professionals working in law enforcement, military, civilian agencies, and the private sector. By using ArcGIS AllSource, you can uncover these hidden connections and quite possibly save lives.
Investigating Violent Crimes
When a firearm is discharged, it creates distinct markings on the shell casings, which serve as a unique identifier for that specific weapon. In the United States, the shell casings found at crime scenes can be submitted to the National Integrated Ballistic Information Network (NIBIN). The NIBIN allows for the capture and comparison of ballistic evidence to aid in solving and preventing violent crimes involving firearms. NIBIN leads are key tools that the Crime Gun Intelligence Centers (CGIC) of the Bureau of Alcohol, Tobacco, Firearms, and Explosives (ATF) use to identify violent shooters and their sources of firearms. NIBIN technology compares images of submitted ballistic evidence from shooting scenes and recovered firearms and produces a list of possible similar results.
Law enforcement agents need to seamlessly combine NIBIN leads with other data – like information on the suspect/victim information, crime locations, and gun purchase location from multiple sources to investigate violent crimes. In this example, we demonstrate how law enforcement agents can use ArcGIS AllSource to fuse NIBIN lead data with other disparate data to better analyze, visualize, and respond to a multi-state criminal network investigation.
Crossing State Lines
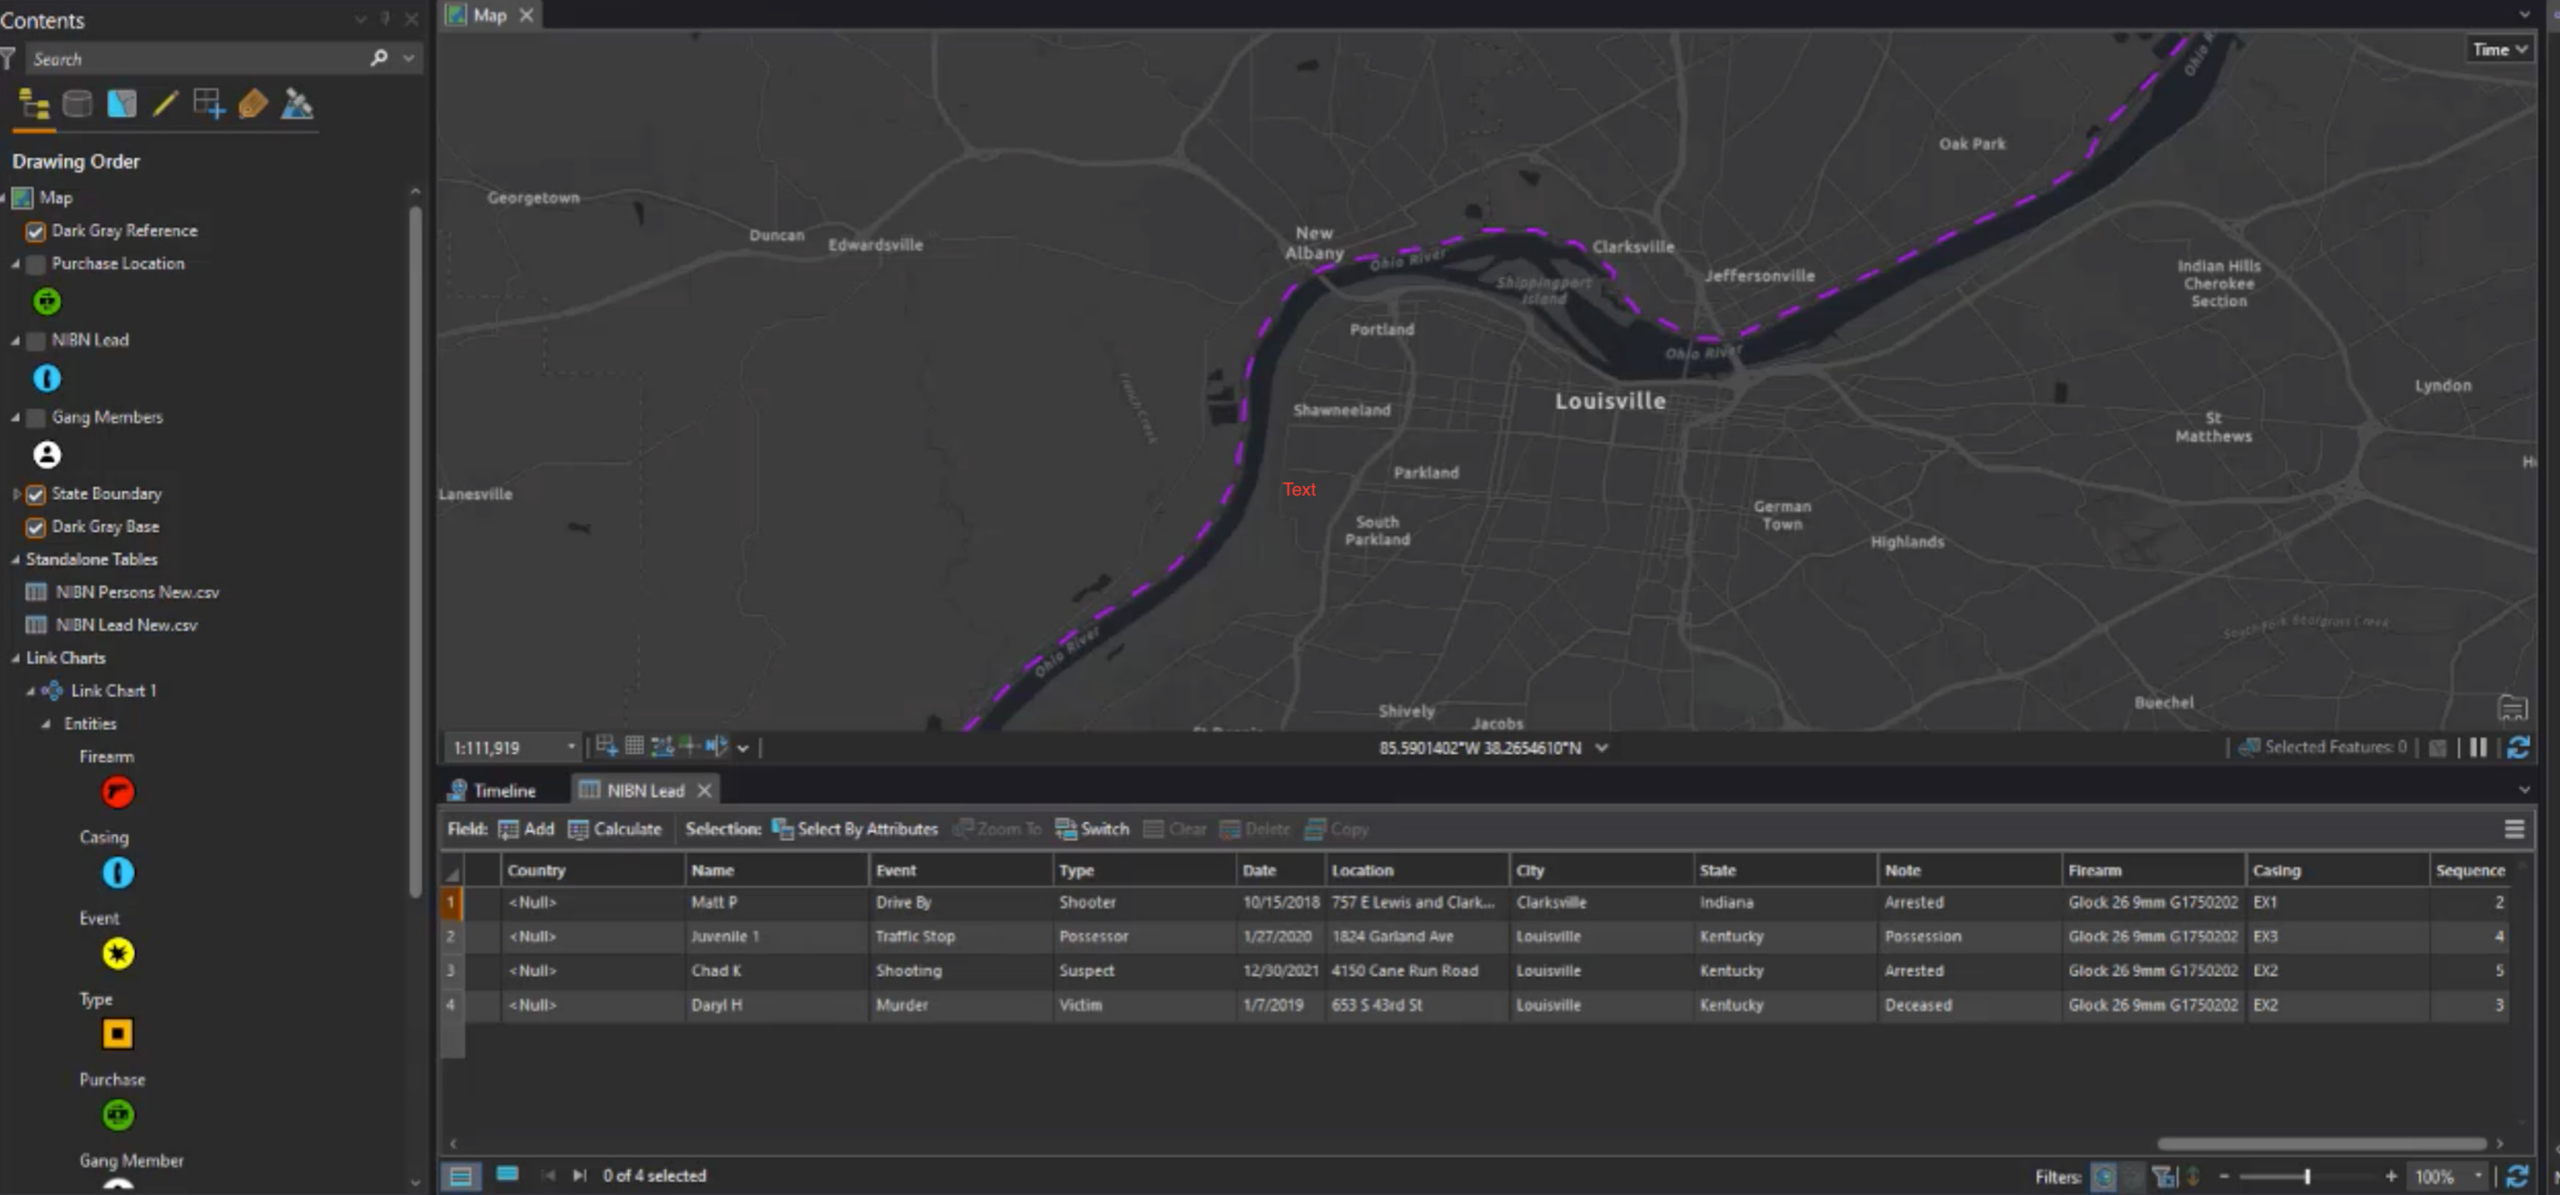
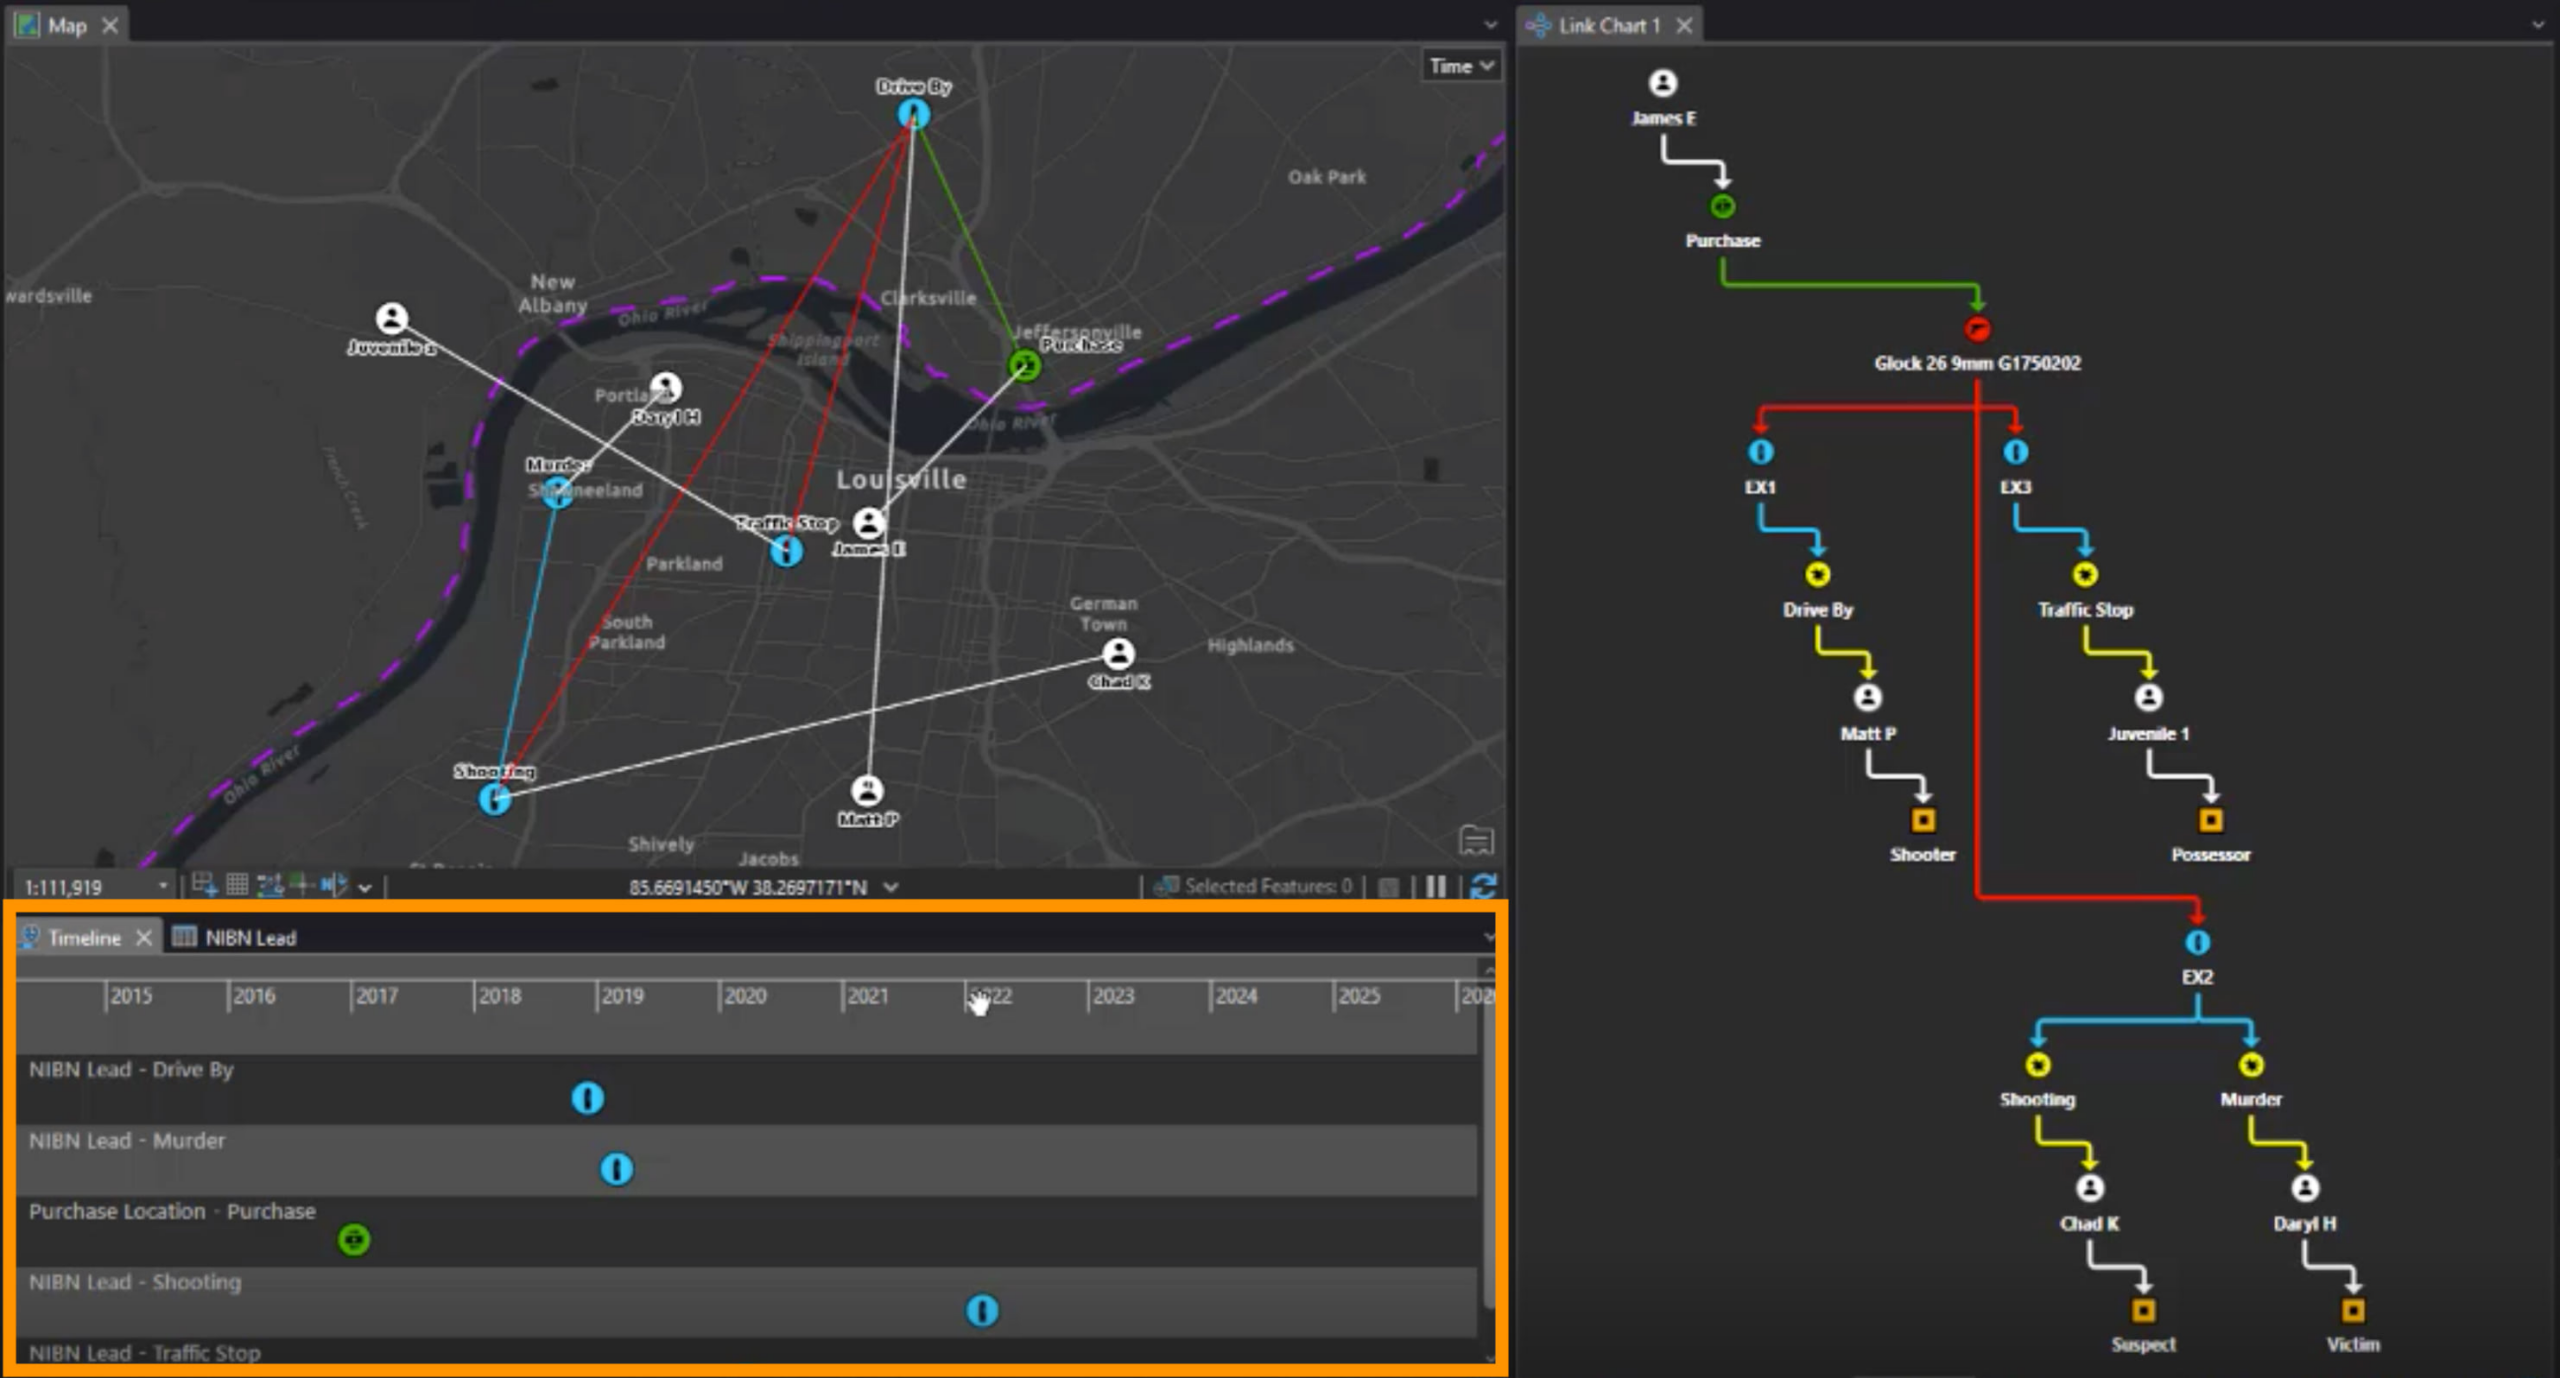
In our mock data set, we have firearm information, bullet casing information, crime event locations, and known gang member home locations. This data set was used to create three separate layers within our analysis: NIBIN Lead, Gang Members, and Purchase Location.
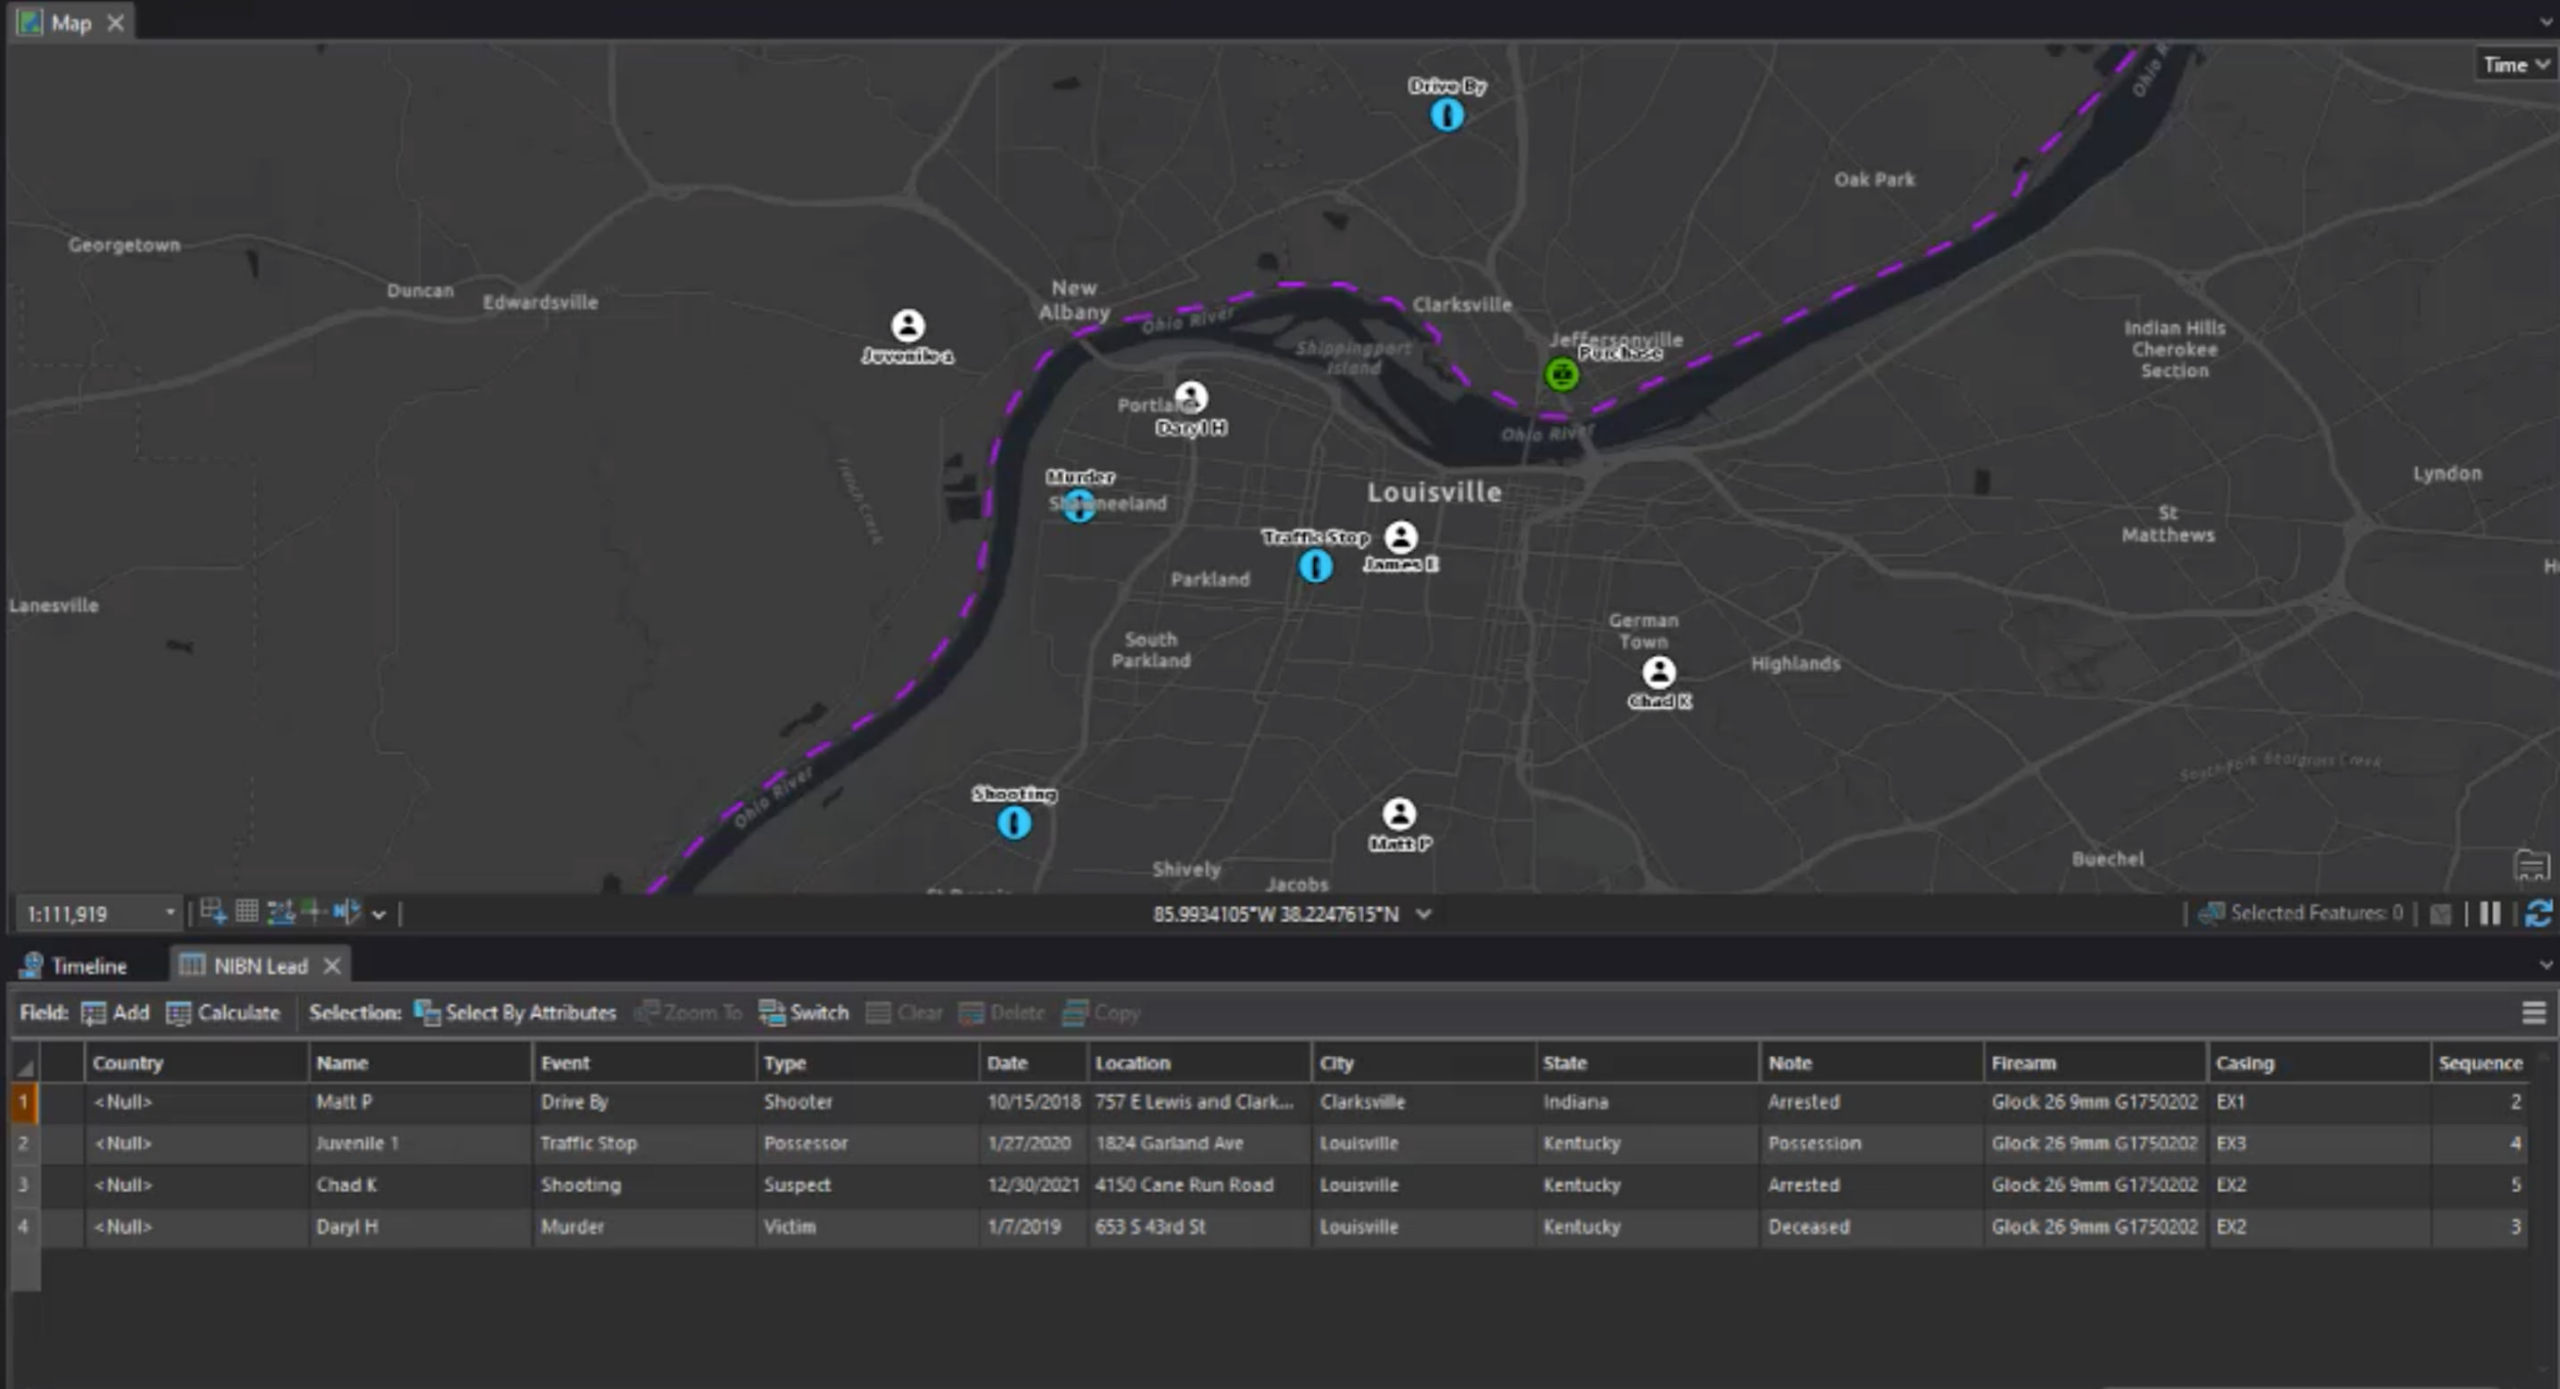
With the map, we can see the subjects’ locations in proximity to each crime event, as well as subjects and events that took place across the Kentucky and Indiana border.
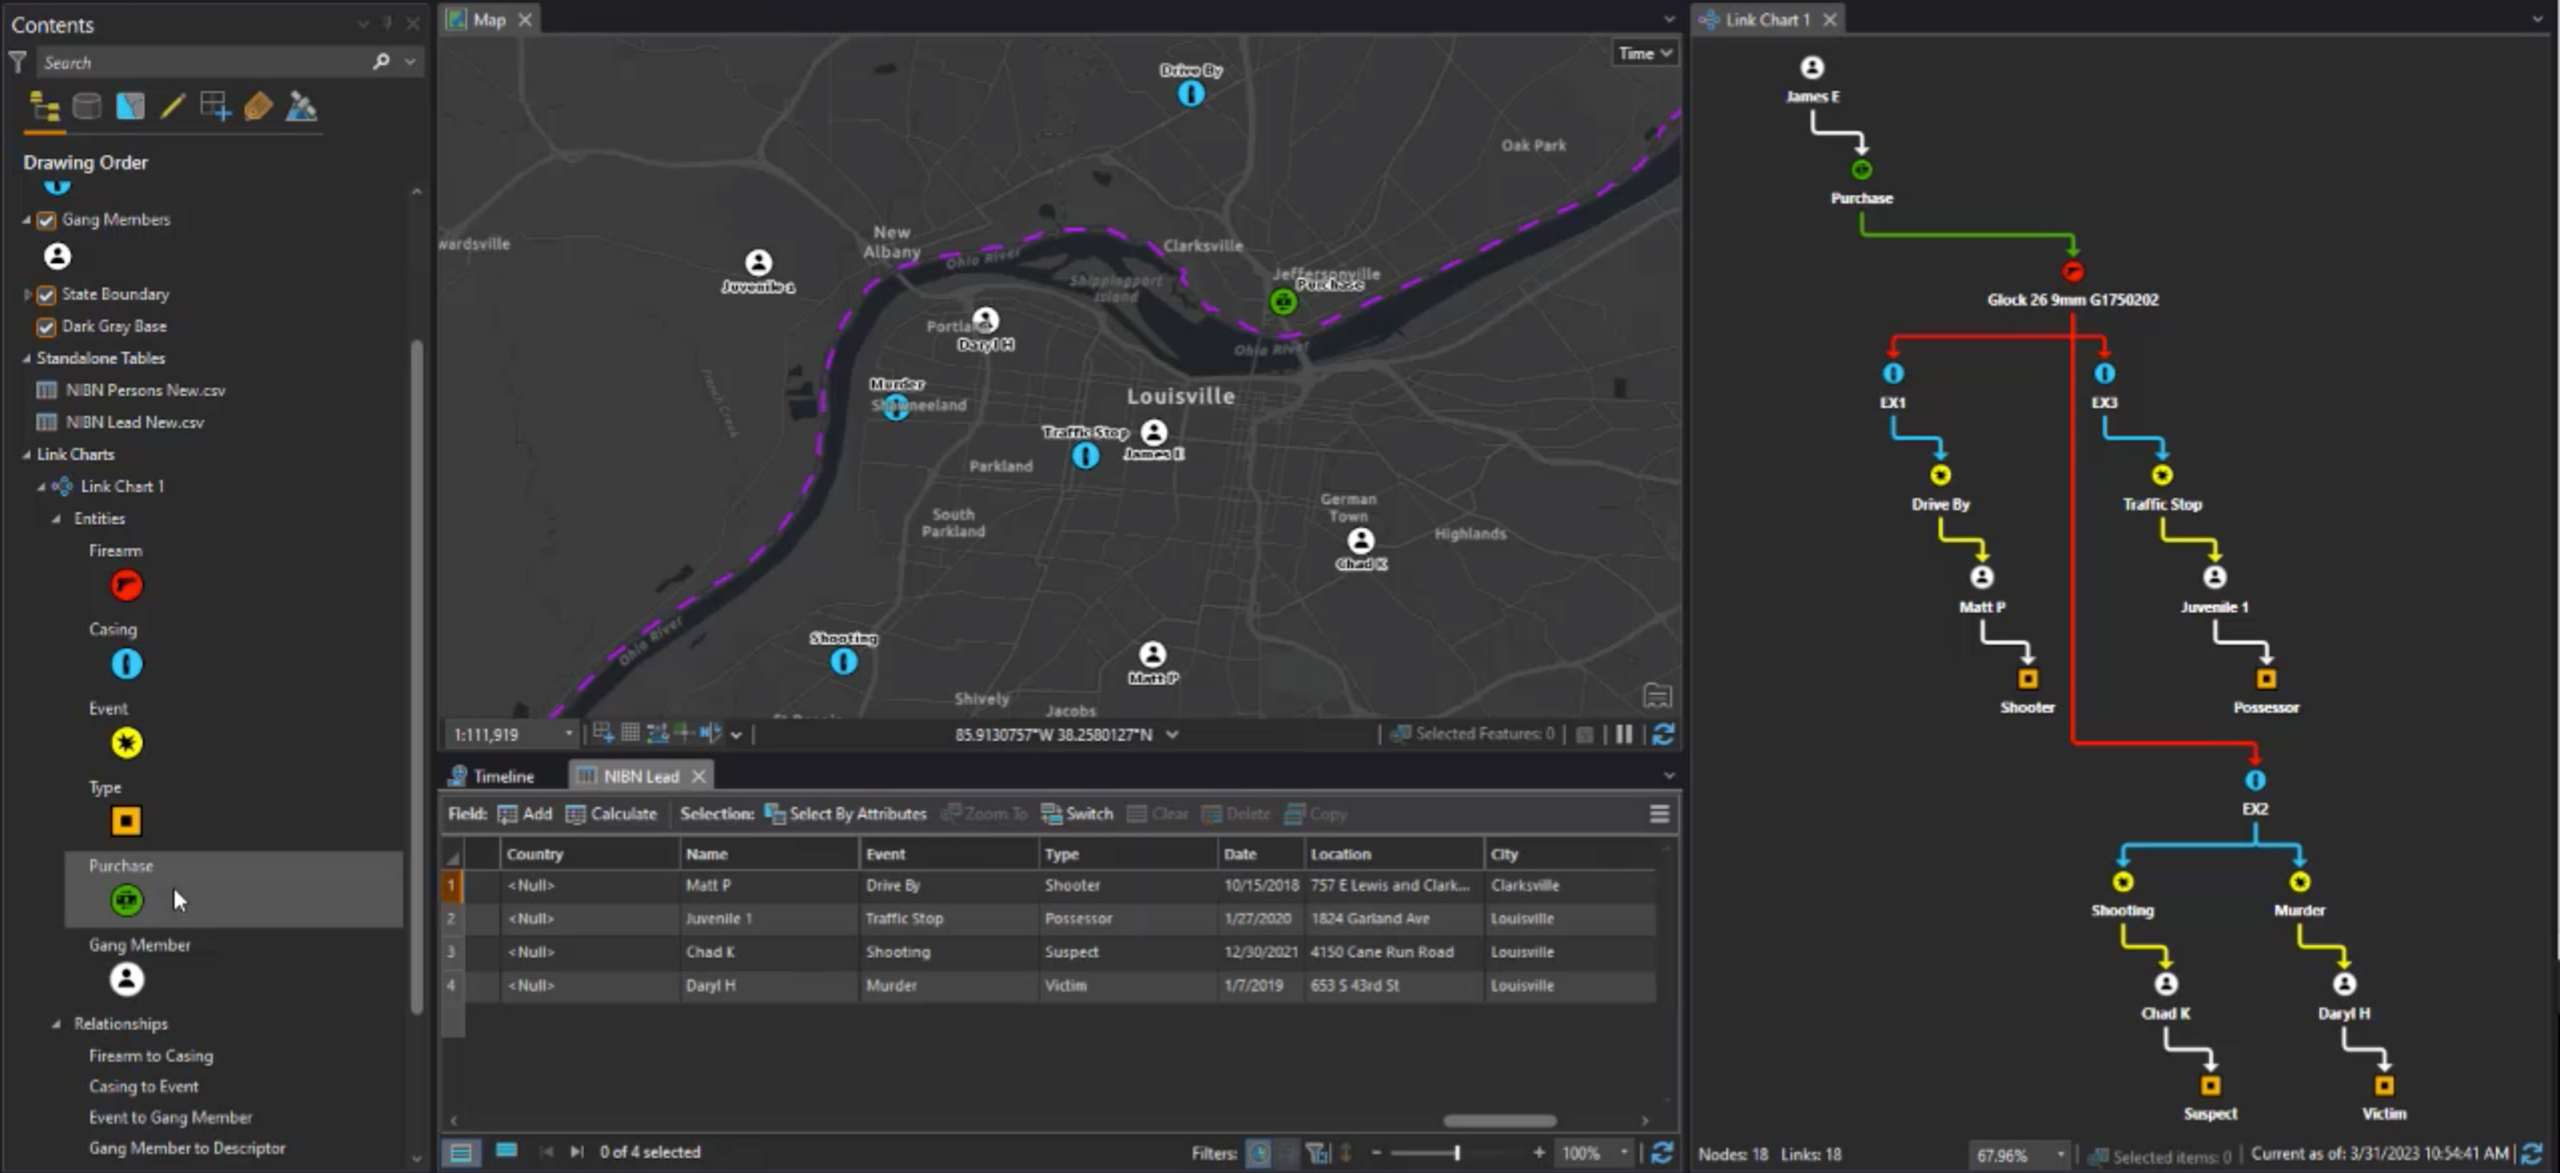
A link chart is used to better visualize the connection between the crime events and subjects, using the NIBIN lead information tied to the firearm used in each event. Here we have entities for firearm, casing, event, subject type, purchase, and gang member. Next, we related these entities with the following created relationships: firearm to casing, casing to event, event to gang member, gang member to type, purchase to firearm, and gang member to purchase.
Connecting with Time
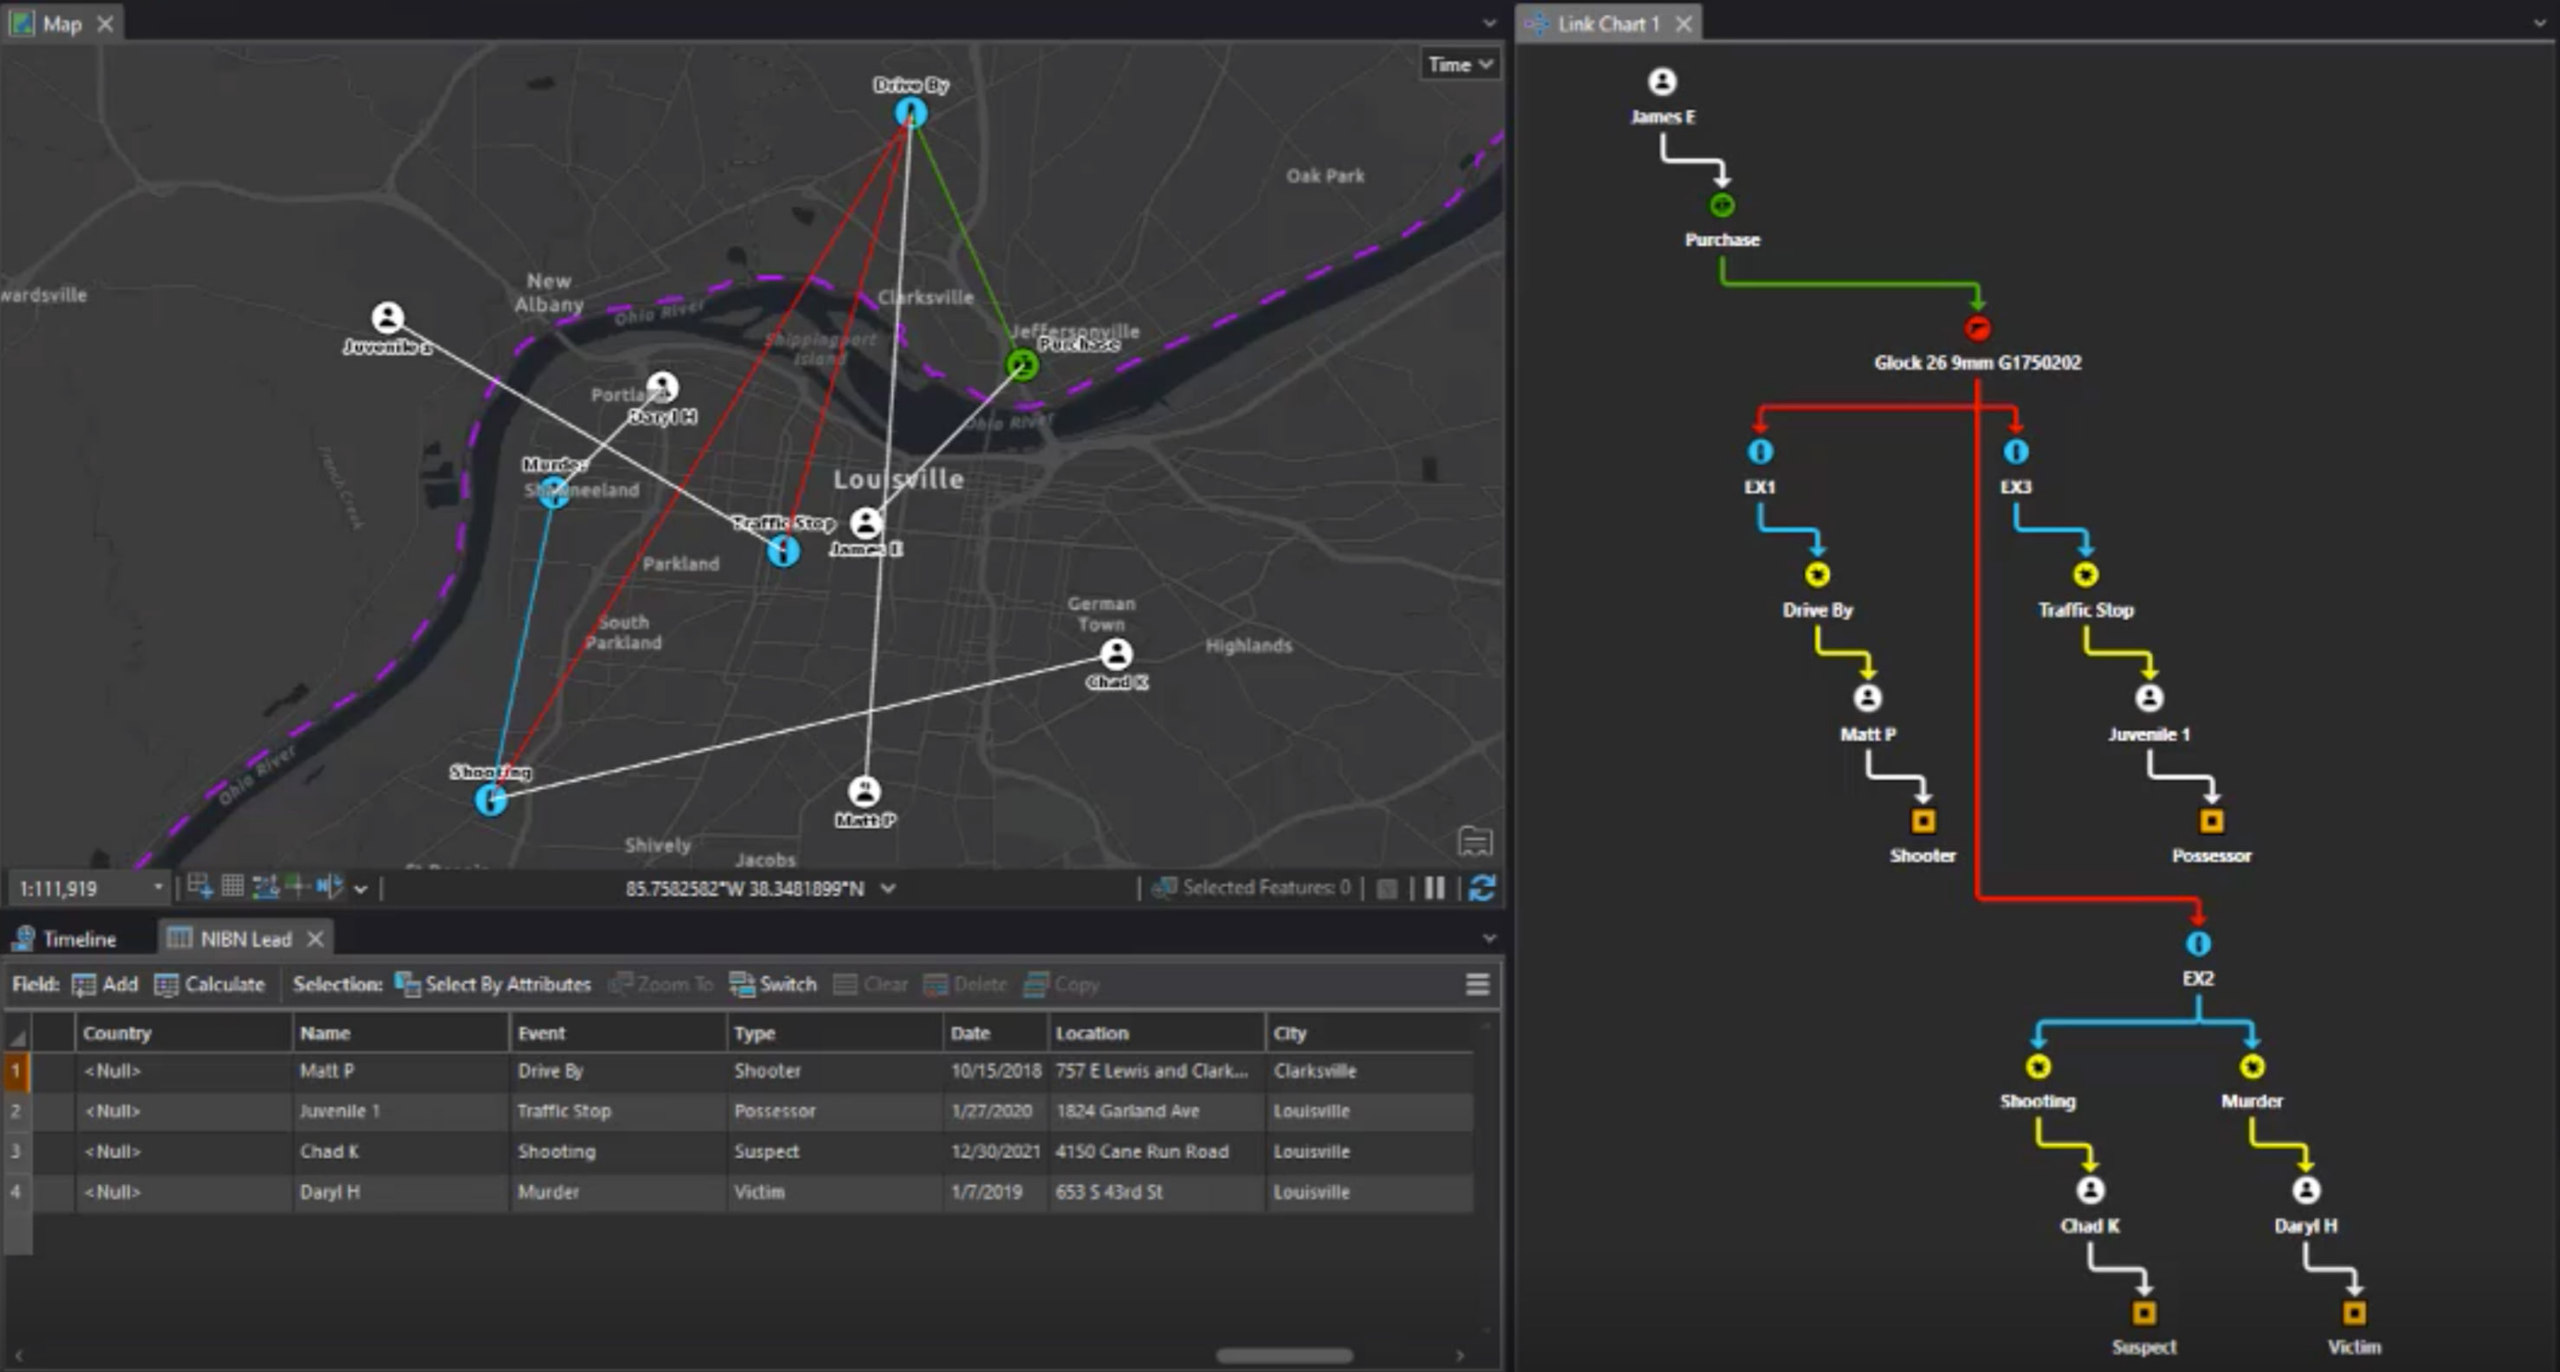
Not only does the link analysis show us a hierarchal view of the relationship between the firearm, gang members, and crime events, but it helps show which gang members were tied to each specific crime event by displaying the relational links on the map. It also shows us which gang members crossed state lines for an event.
Finally, a timeline with our data visually shows the events in sequence, beginning with the purchase of the gun and ending with the last event, spanning the five-year period.
AllSource enables law enforcement agents to quickly reveal hidden connections between violent crimes in different states and jurisdictions with ease. It allows analysts to integrate data from multiple sources to conduct multidimensional visualization, advanced link analysis, and intelligence production for crime investigations – all in a single desktop environment. Analysts can see their data in maps, link charts, timelines, and tables, all while managing multiple simultaneous views in a single project-based workflow. This enables them to perform spatial, temporal, and relational data analysis to answer questions and forecast events for investigations. Additionally, they can disseminate their intelligence products with key stakeholders, or in presentations for grand juries and court visualization. AllSource streamlines collaboration and cooperation across departments and agencies during investigations.
To get started with ArcGIS AllSource check out the resources below or contact your Esri representative.
Related Resources
- To learn more, visit the ArcGIS AllSource website.


Article Discussion: